What is Prometheus?
Prometheus is a powerful open-source monitoring solution that scrapes metrics from targets via HTTP endpoints. It is widely used to gather critical system and application metrics, store them in a time series database, and enable complex querying using its native language, PromQL. Additionally, Prometheus features built-in alerting that allows you to define rules for notifying teams when specific thresholds are exceeded.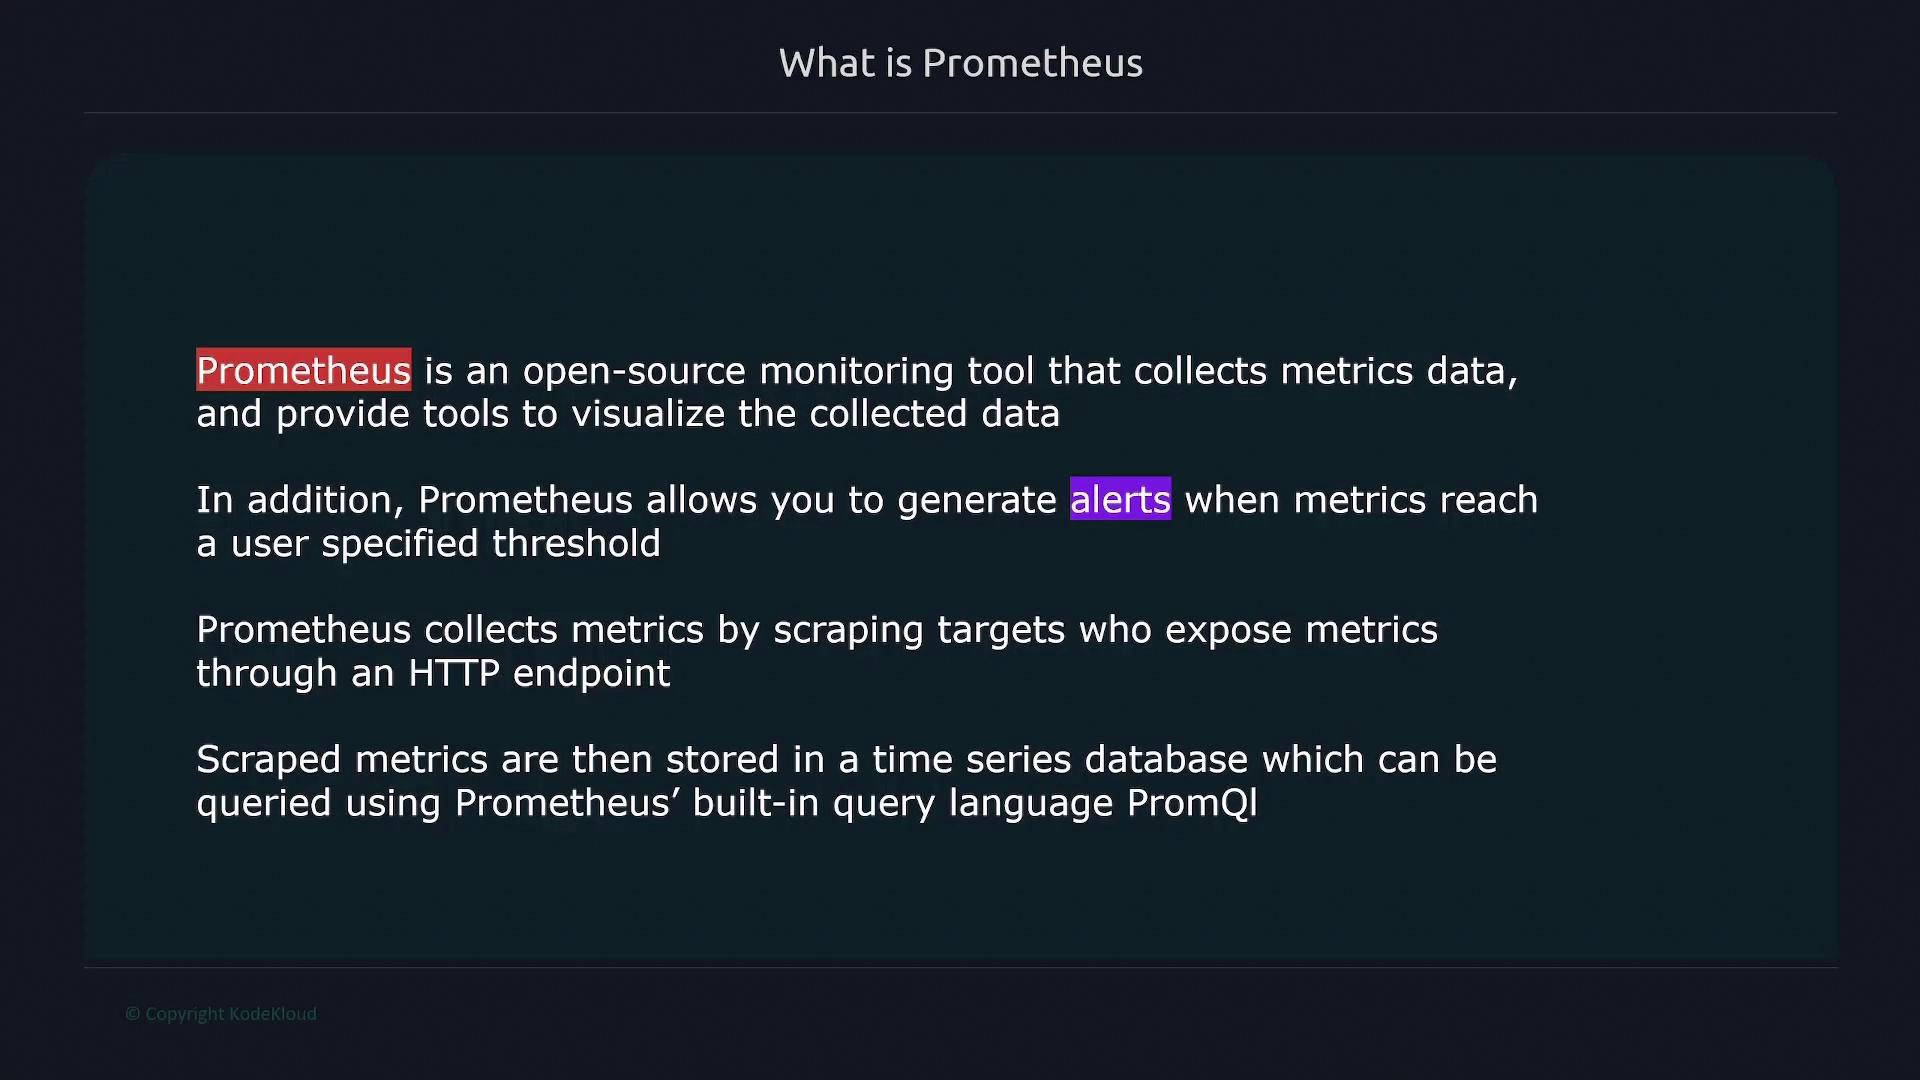
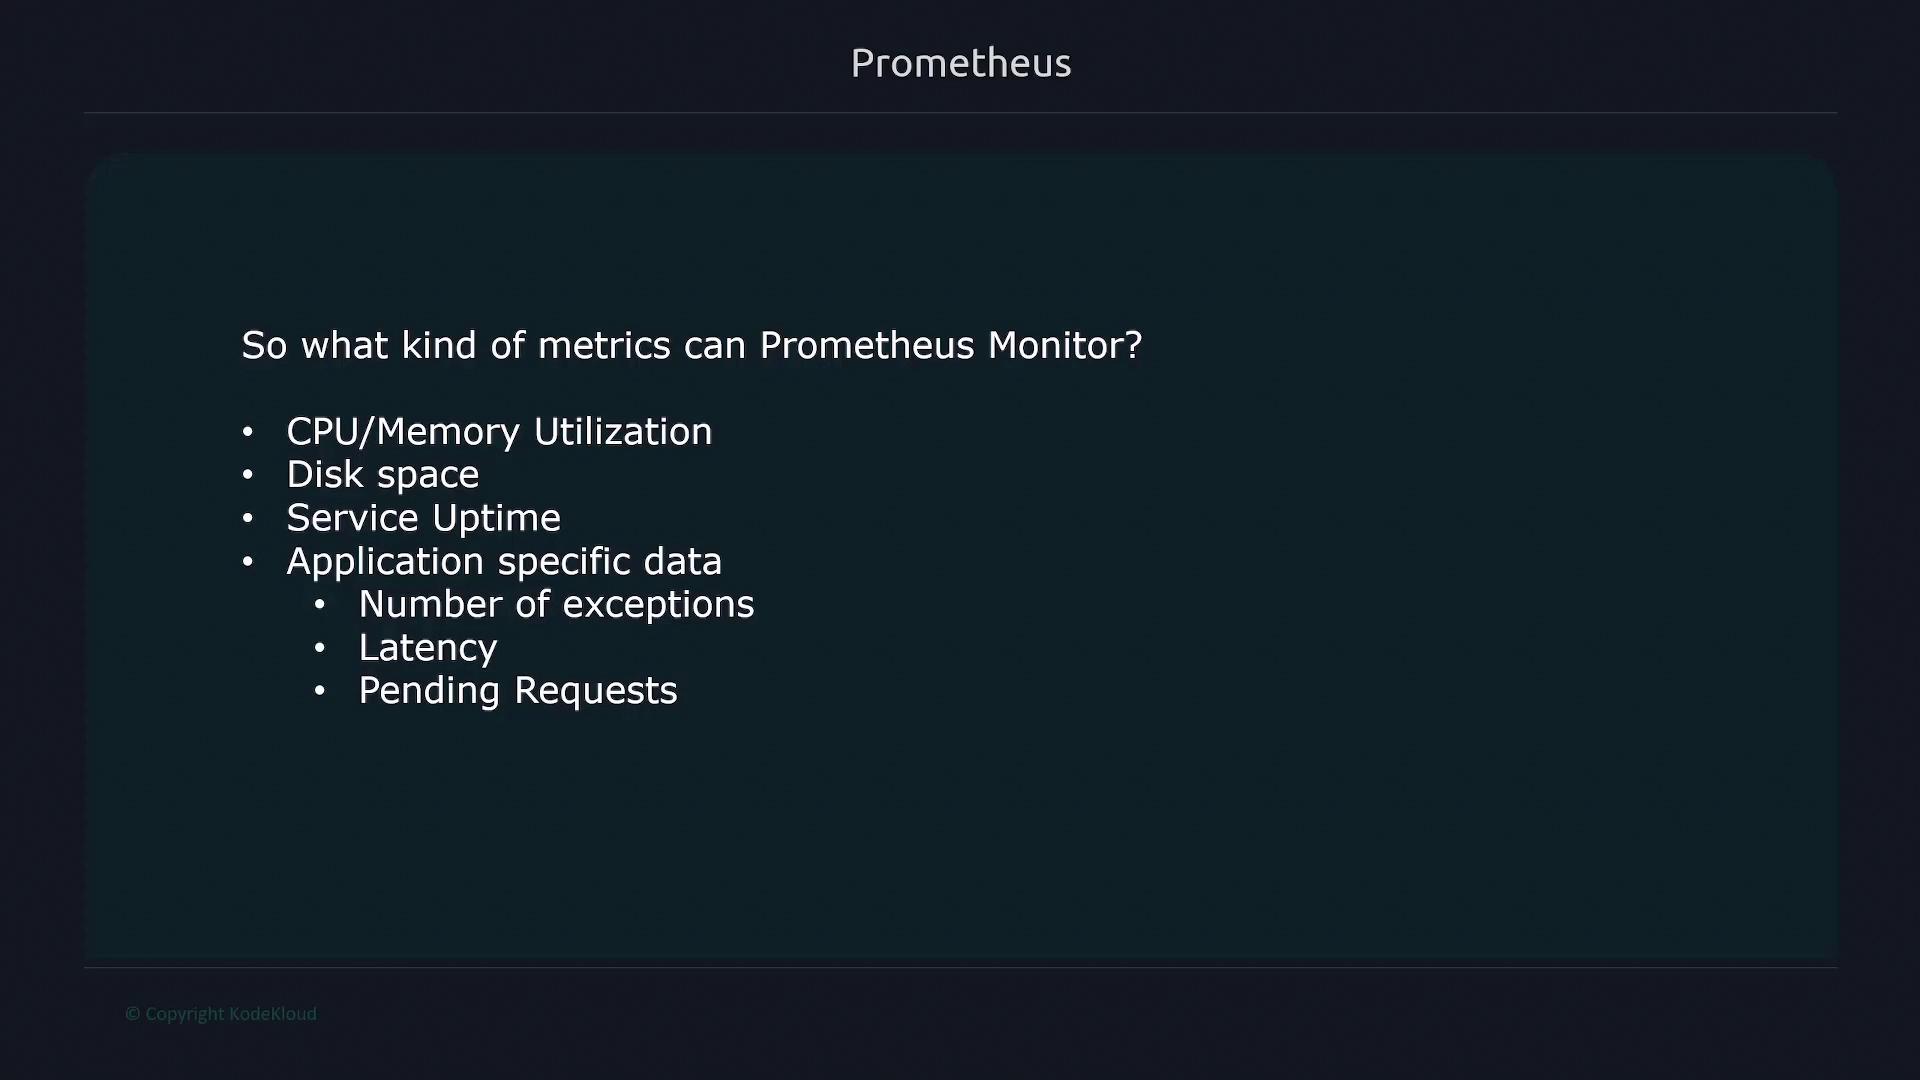
Types of Metrics Monitored
Prometheus is versatile in monitoring a broad range of metrics, including:-
System Metrics:
- CPU utilization
- Memory usage
- Disk space usage
- Service uptime
-
Application-Specific Metrics:
- Exception counts
- Latency measurements
- Number of pending requests
Data Integration
Prometheus is built to seamlessly collect metrics from a diverse range of sources—not just applications and operating systems but also networking devices, databases, and other critical IT infrastructure components. Its extensive integration capabilities make it a favorite among IT professionals.Prometheus is highly extensible, enabling custom metric collection tailored to your specific requirements.
Focused on Numeric Data
Prometheus specializes in capturing numeric time-series data. It is engineered for metric collection and analysis, meaning it is not designed to monitor events, logs, or traces.
Background and Development
Originally developed with sponsorship from SoundCloud, Prometheus has evolved significantly since its inception. In 2016, it joined the Cloud Native Computing Foundation, further solidifying its role in the cloud-native ecosystem. The tool is primarily written in Go, contributing to its performance and scalability.
Additional Resources
For further insights into Prometheus and modern monitoring practices, consider exploring the following resources:| Resource Type | Use Case | Example Command or Link |
|---|---|---|
| Monitoring Tool | Setting up system and application metrics | Prometheus Documentation |
| Cloud Native | Integration with cloud-native solutions | Cloud Native Computing Foundation |
| Open Source | Community-driven tools and contributions | GitHub - Prometheus |