Architecture Overview
Rather than embedding networking concerns within each microservice, a service mesh injects a sidecar proxy alongside every service instance. These proxies form the data plane, managing all east–west traffic. A control plane centrally configures and orchestrates the proxies, enabling dynamic routing, security policies, and telemetry collection.
- Dynamic Traffic Routing: Canary releases, blue/green deployments, circuit breaking, retries
- Mutual TLS (mTLS): Automatic encryption and authentication of service calls
- Observability: End-to-end metrics, logs, and distributed tracing
- Service Discovery: Automatic registration and lookup of service instances
A service mesh is platform-agnostic—popular implementations include Istio, Linkerd, and Consul Connect.
Core Responsibilities
The following table summarizes a service mesh’s primary capabilities:| Capability | Description | Example Tools/Config |
|---|---|---|
| Service Discovery | Maintains registry of healthy instances for dynamic lookup | Envoy, Consul Catalog |
| Health Checking | Removes unresponsive instances to prevent routing to unhealthy pods | HTTP/gRPC probes, custom health checks |
| Load Balancing | Distributes traffic based on round-robin, least connections, or locality | Envoy LB algorithms |
| Security (mTLS) | Encrypts and authenticates all inter-service traffic | Istio PeerAuthentication, Linkerd identity service |
| Traffic Management | Applies retries, timeouts, fault injection, and traffic splitting policies | Istio VirtualService, Linkerd ServiceProfile |
| Observability | Collects metrics, logs, and traces for end-to-end visibility | Prometheus, Jaeger, Grafana |
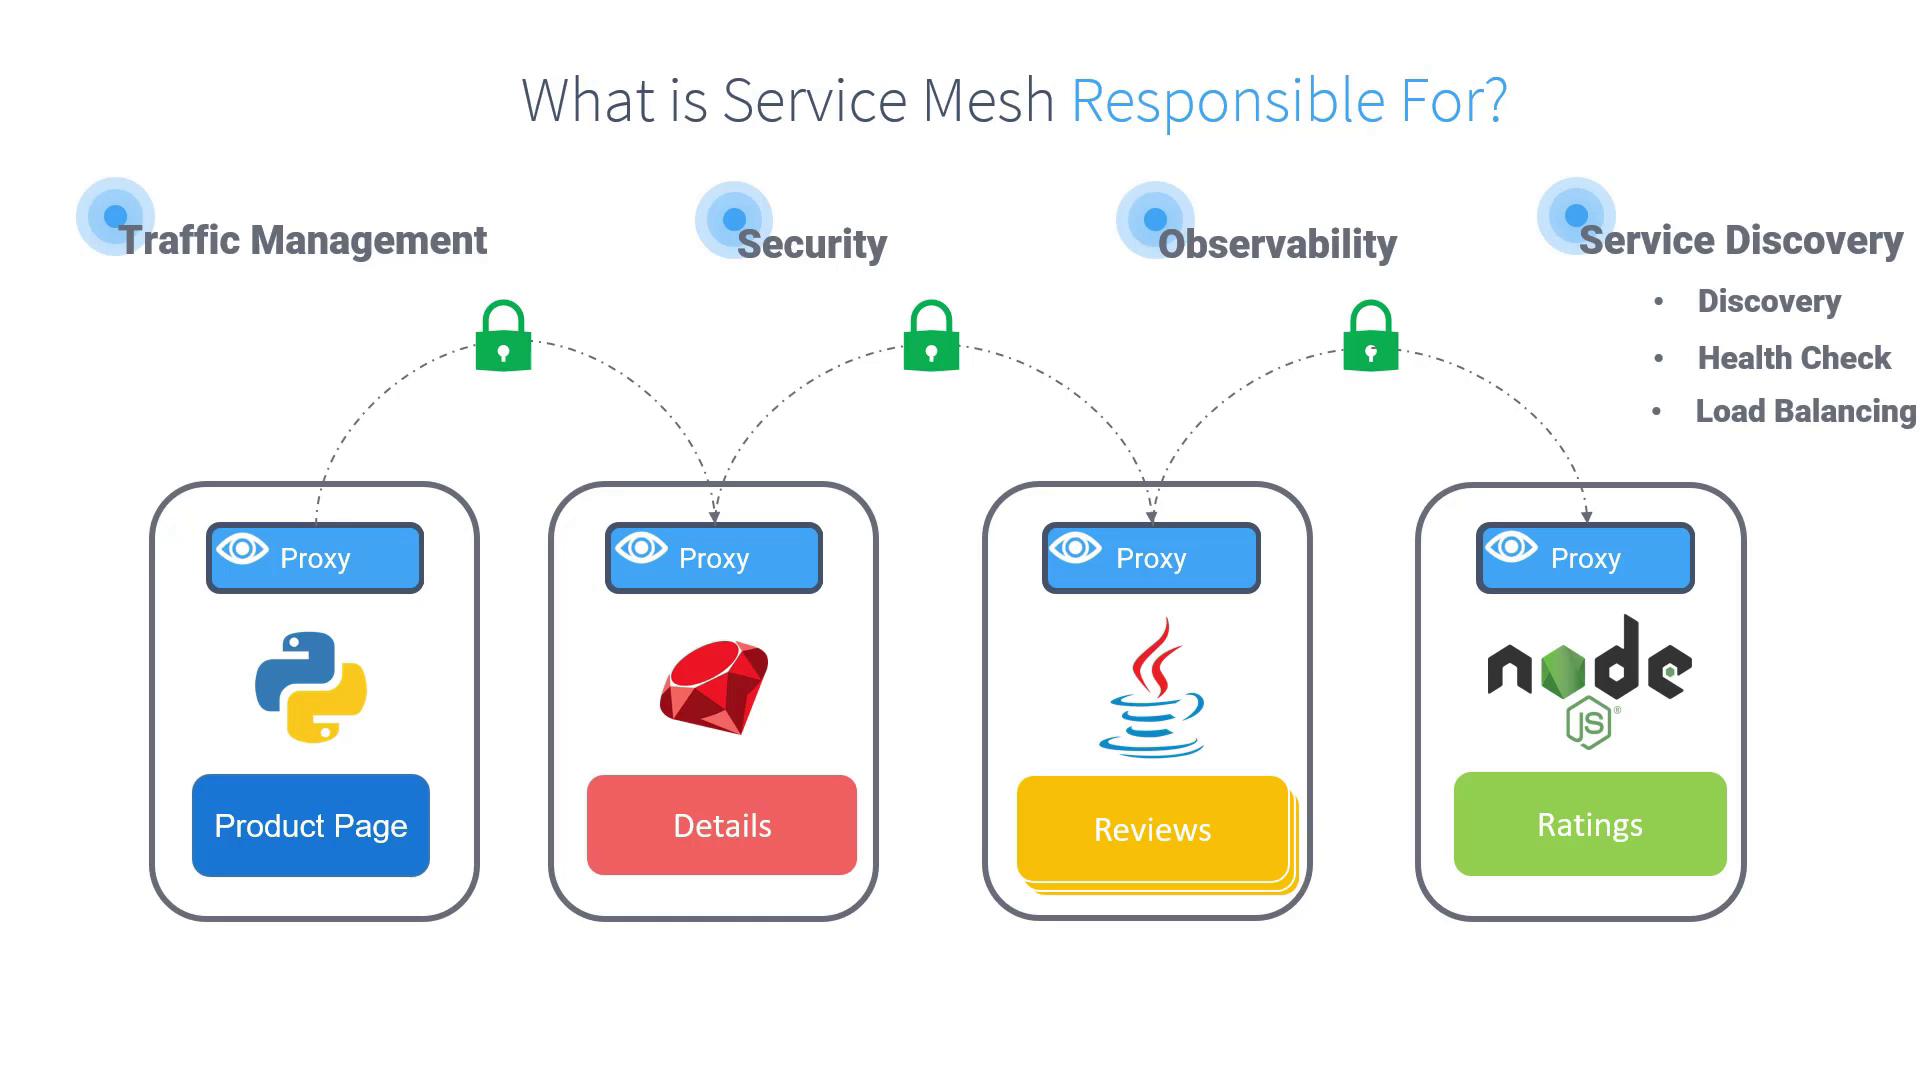
- Service Discovery
Proxies query a centralized registry to resolve healthy service endpoints dynamically. - Health Checks
Continuous probing ensures unresponsive instances are excluded from load-balancing pools. - Load Balancing
Traffic is distributed using configurable algorithms (e.g., round-robin, least requests). - Security (mTLS)
Automatic certificate issuance and rotation secure all traffic with mutual TLS. - Traffic Management
Fine-grained policies for fault tolerance: retries, timeouts, circuit breakers, and canary releases. - Observability
Telemetry from each proxy yields metrics, logs, and distributed traces, aiding root-cause analysis.