

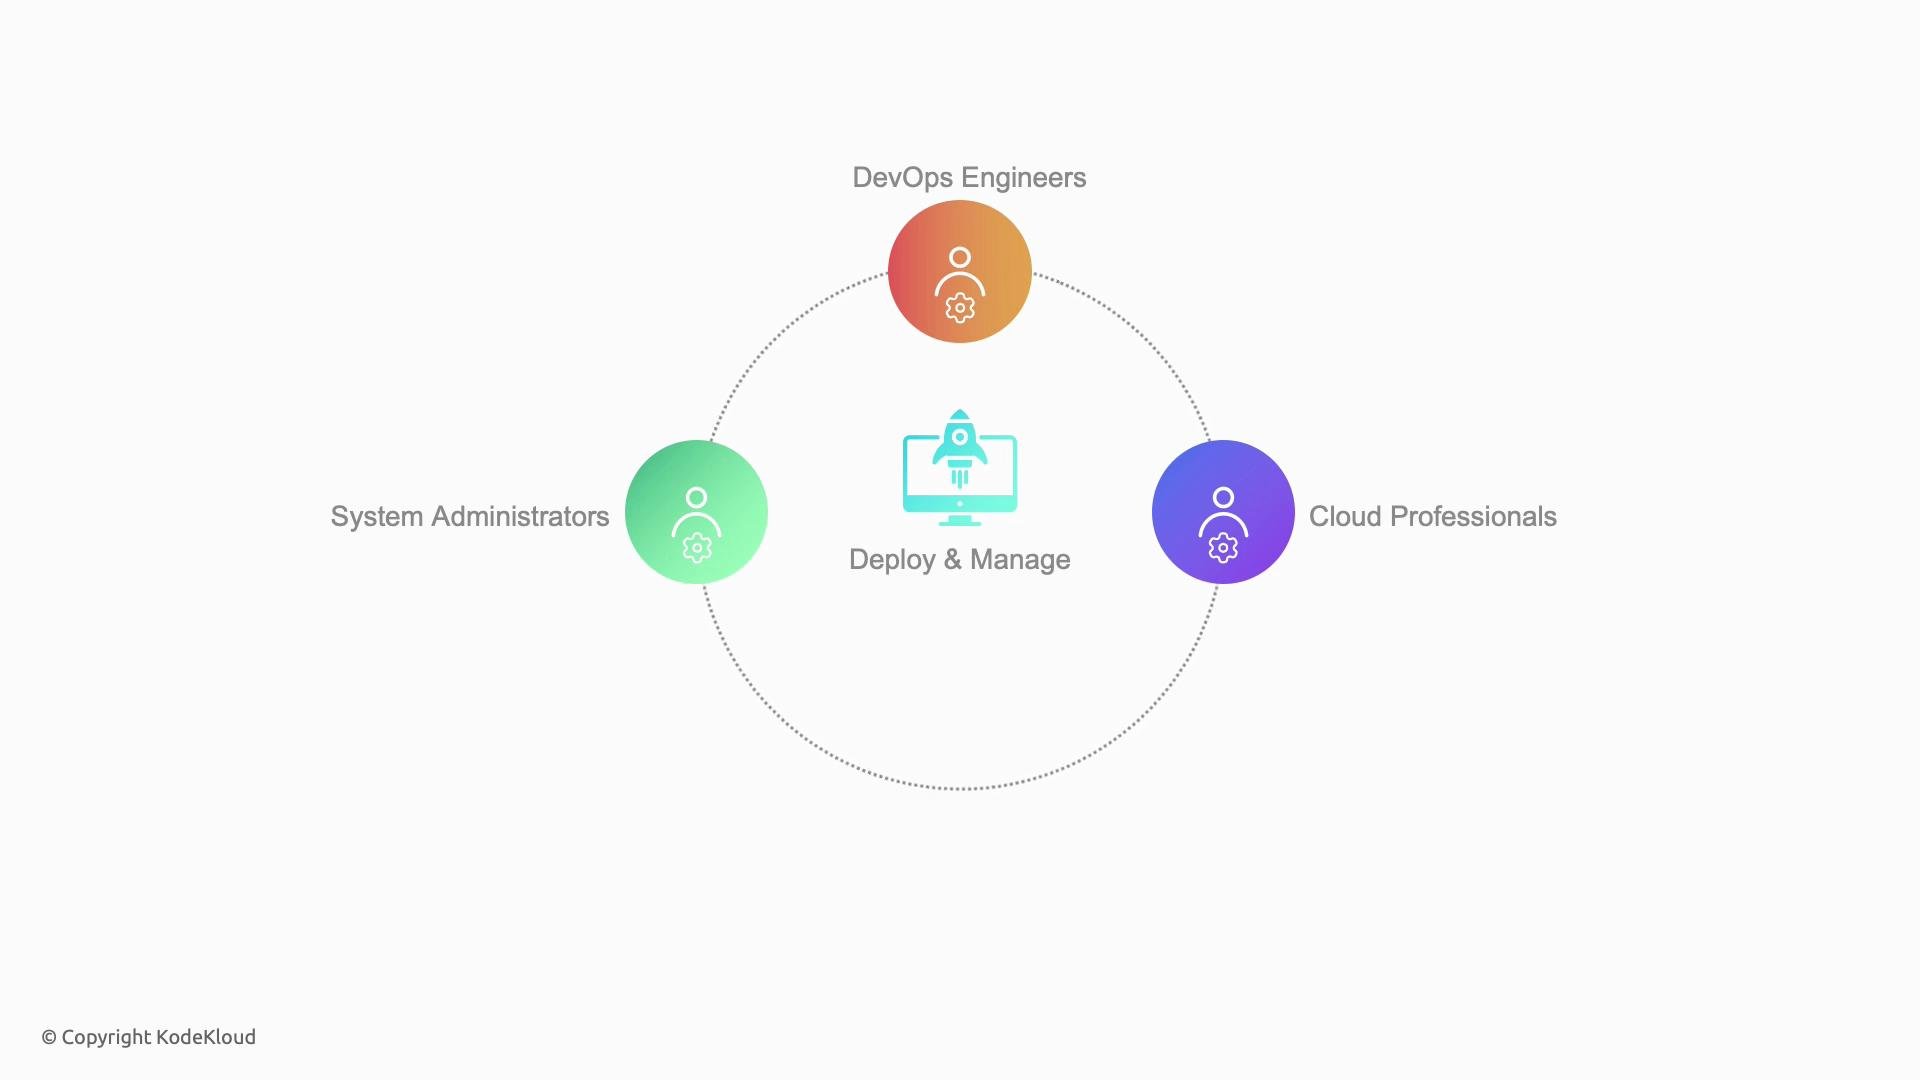
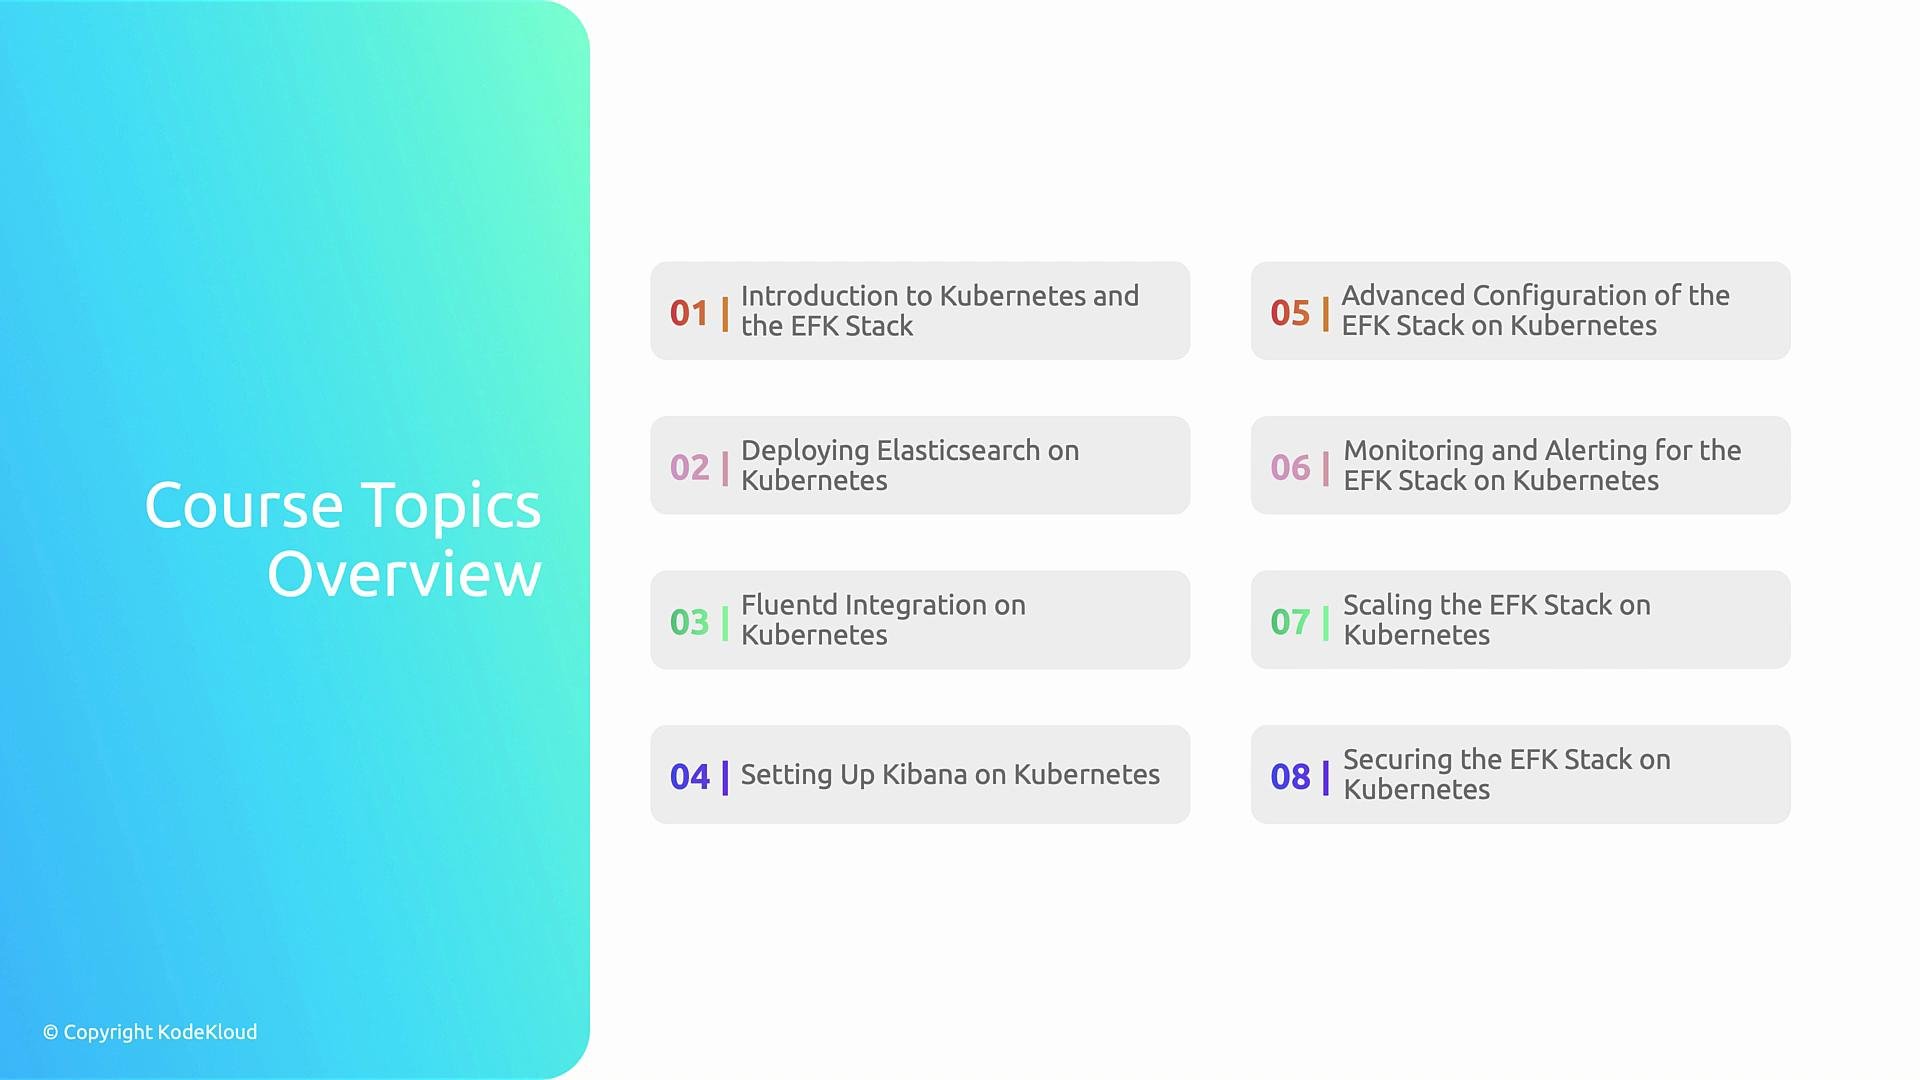
- Deploy Elasticsearch on Kubernetes to store and index logs.
- Collect and forward logs using Fluentd as the aggregator/log shipper.
- Visualize and explore logs with Kibana dashboards.
- Configure persistence, resource requests/limits, and cluster scaling.
- Monitor cluster health and secure the EFK stack for production use.
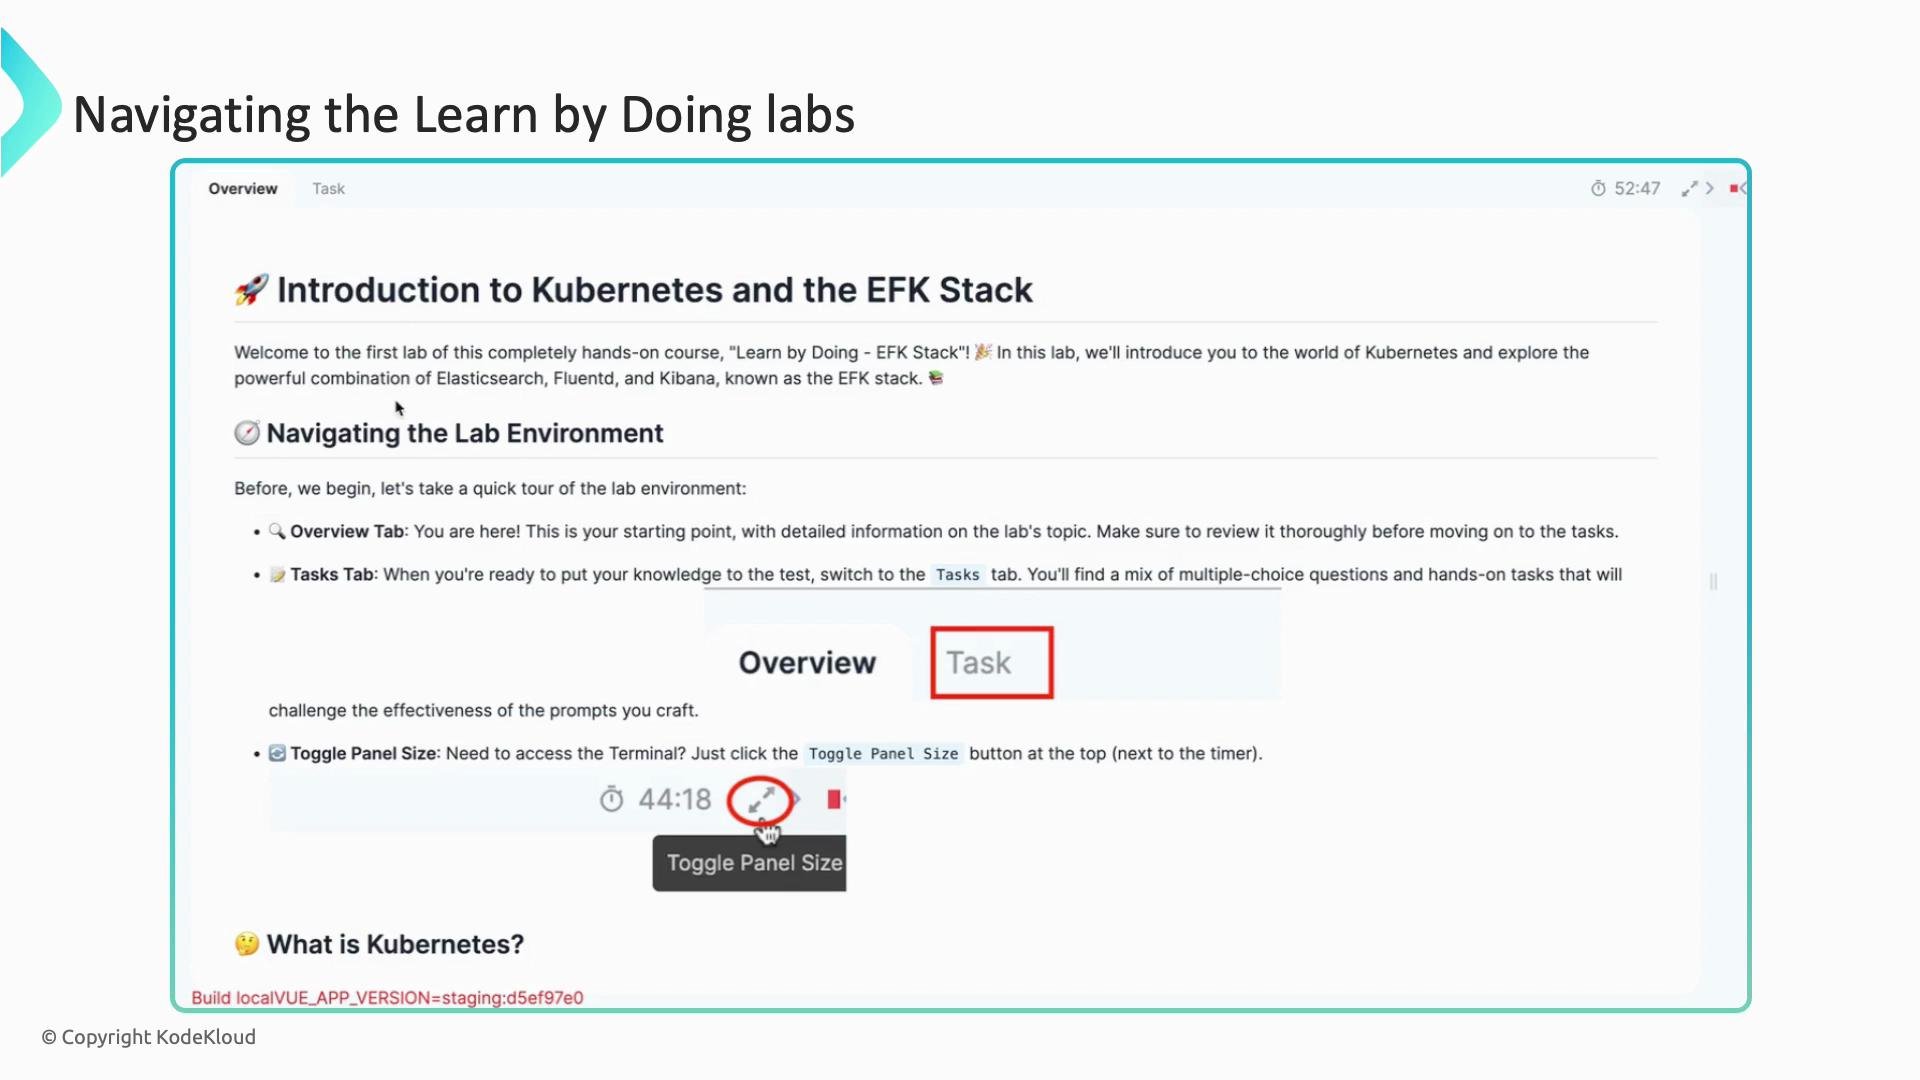
- Open the terminal in the lab by clicking the toggle icon. This connects directly to a live Kubernetes cluster provisioned for the exercise.
- Use the Hint and Solution tabs if you get stuck; they’re designed to guide rather than replace the learning.
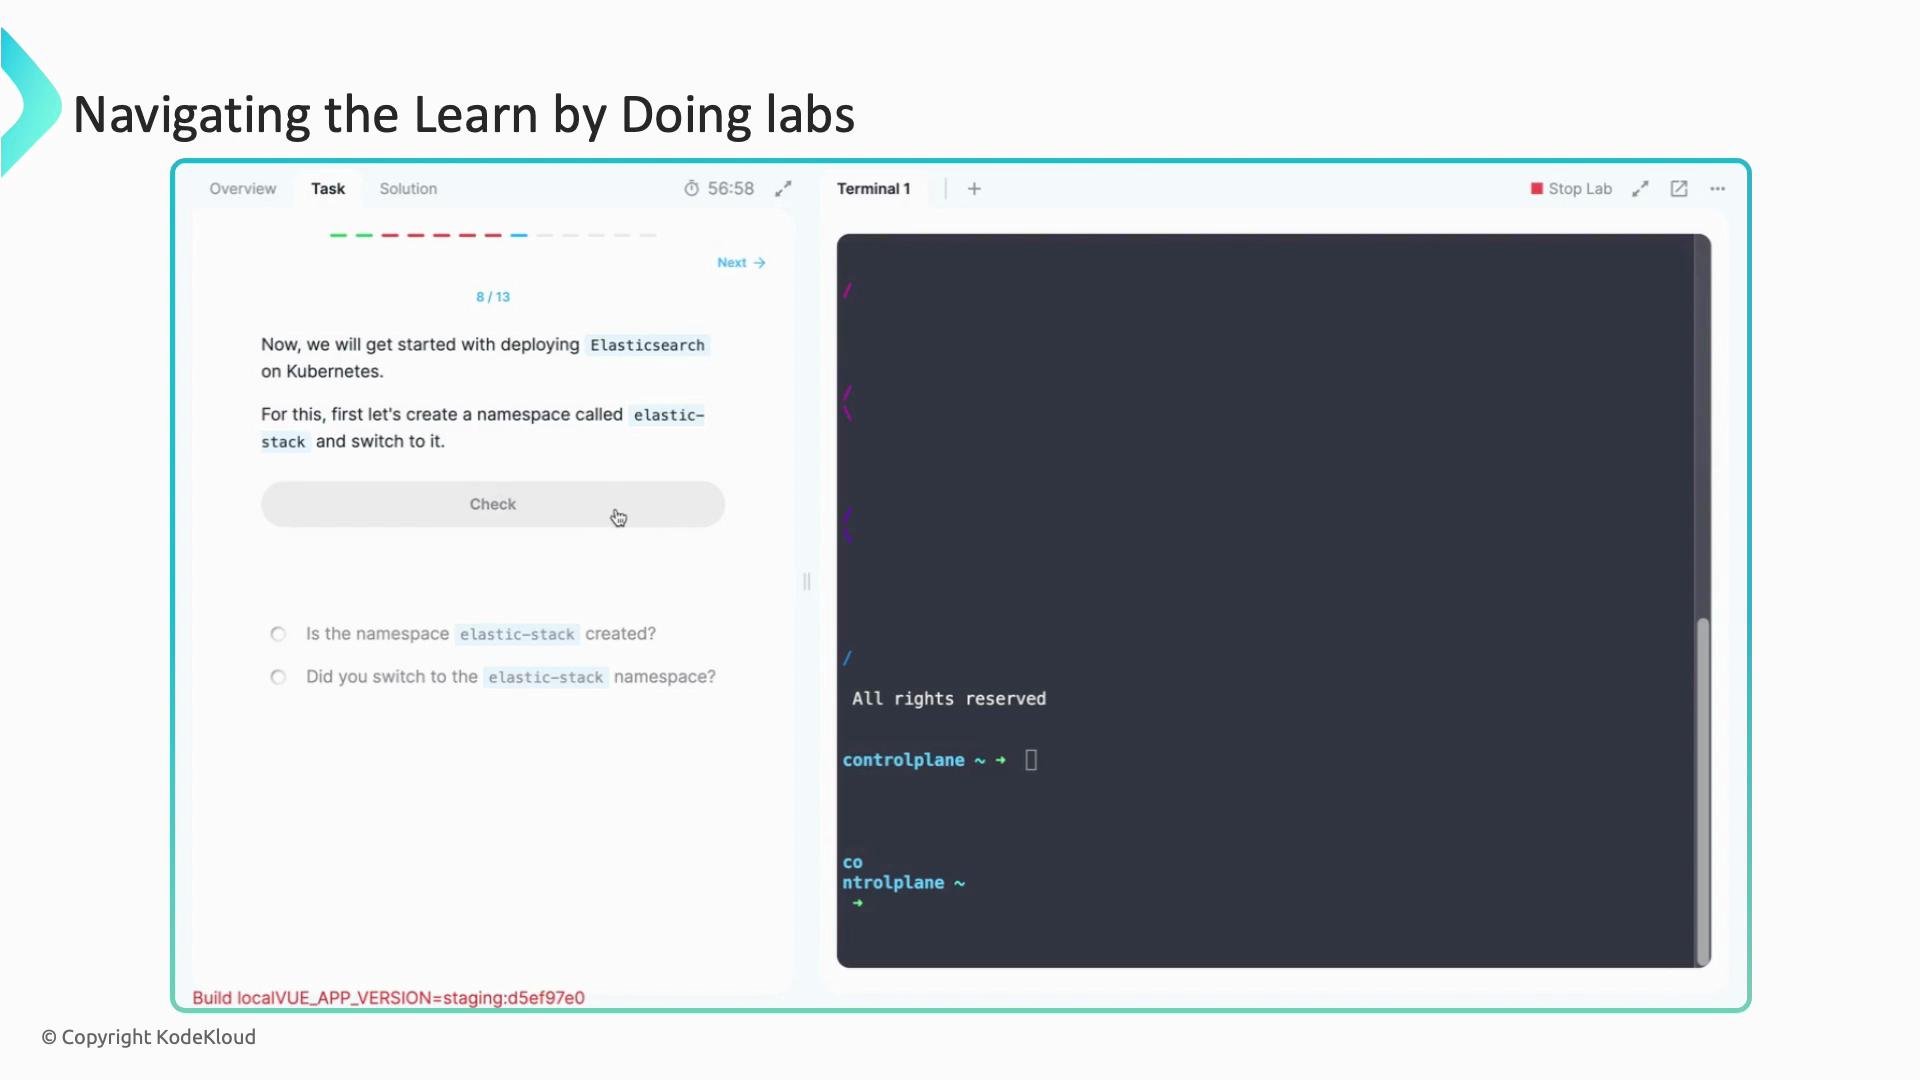
- After you complete a step, click the Check button to validate the task and unlock the next step.
Use the terminal to run Kubernetes commands against the live cluster. If a task asks you to create or switch to a namespace, follow the exact command shown in the Tasks tab and then use the Check button to validate. Example namespace creation and switch:
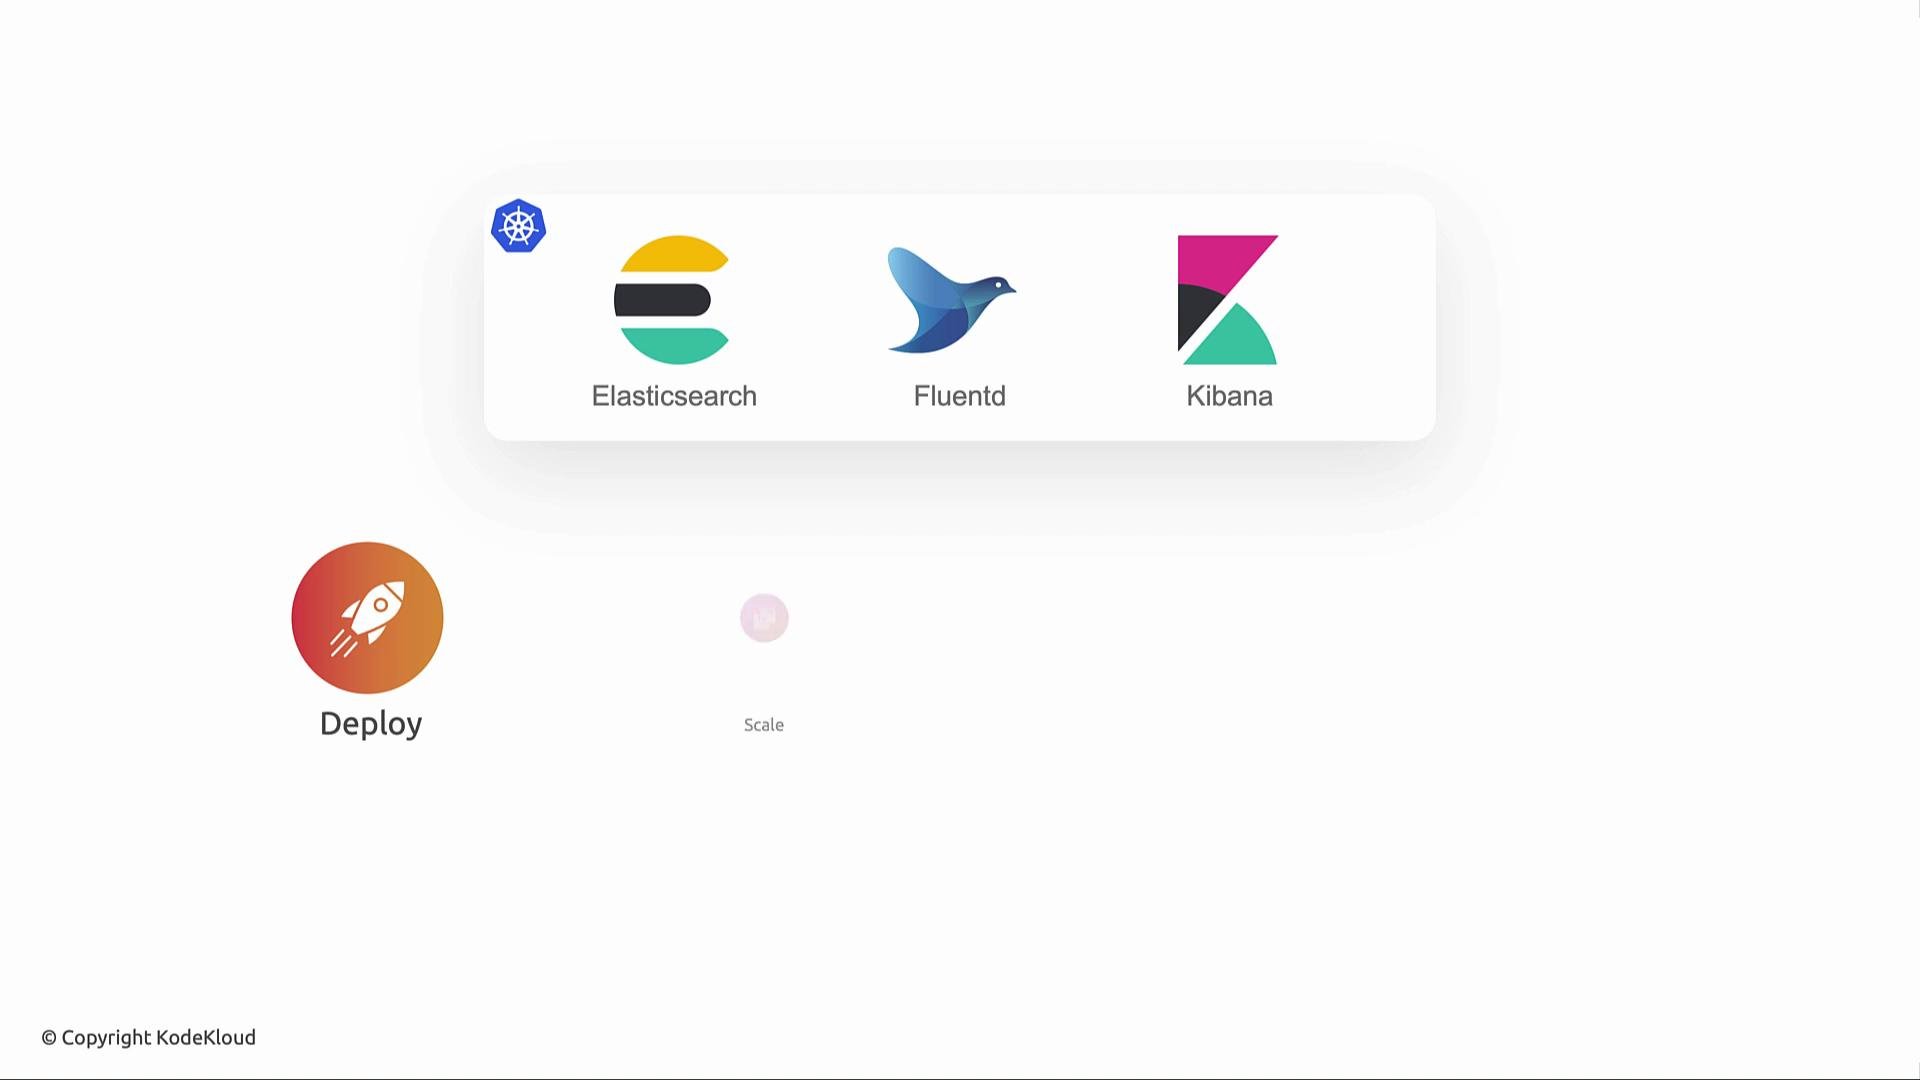
- Overview tab: read the conceptual context and objectives for the module.
- Tasks tab: follow workbook-style instructions with exact commands and validations.
- Terminal: run commands directly against the sandbox cluster.
- Toggle Panel Size: expand or collapse the terminal panel for better visibility.
- Use namespaced resources (for example, use
elastic-stackas the deployment namespace). - Define resource requests and limits to ensure stable performance.
- Persist Elasticsearch data using appropriate StorageClasses and PersistentVolumeClaims.
- Run Fluentd as a DaemonSet to collect logs across nodes.
- Secure Kibana and Elasticsearch endpoints for production access.
This course uses a live sandbox Kubernetes cluster for labs. Do not use production credentials or expose sensitive data while completing exercises. Always follow your organization’s security policies when applying these patterns to production.
elastic-stack namespace and proceed through the deployment, configuration, and validation steps.
Links and references