Overview of Metrics
Azure metrics represent time-series data that capture the state of your resources at any given moment. They provide near real-time visualizations to help you monitor critical performance indicators such as CPU usage, memory consumption, and network traffic. Once a resource is deployed, its metrics are immediately available through the resource’s overview blade or the Metrics Explorer.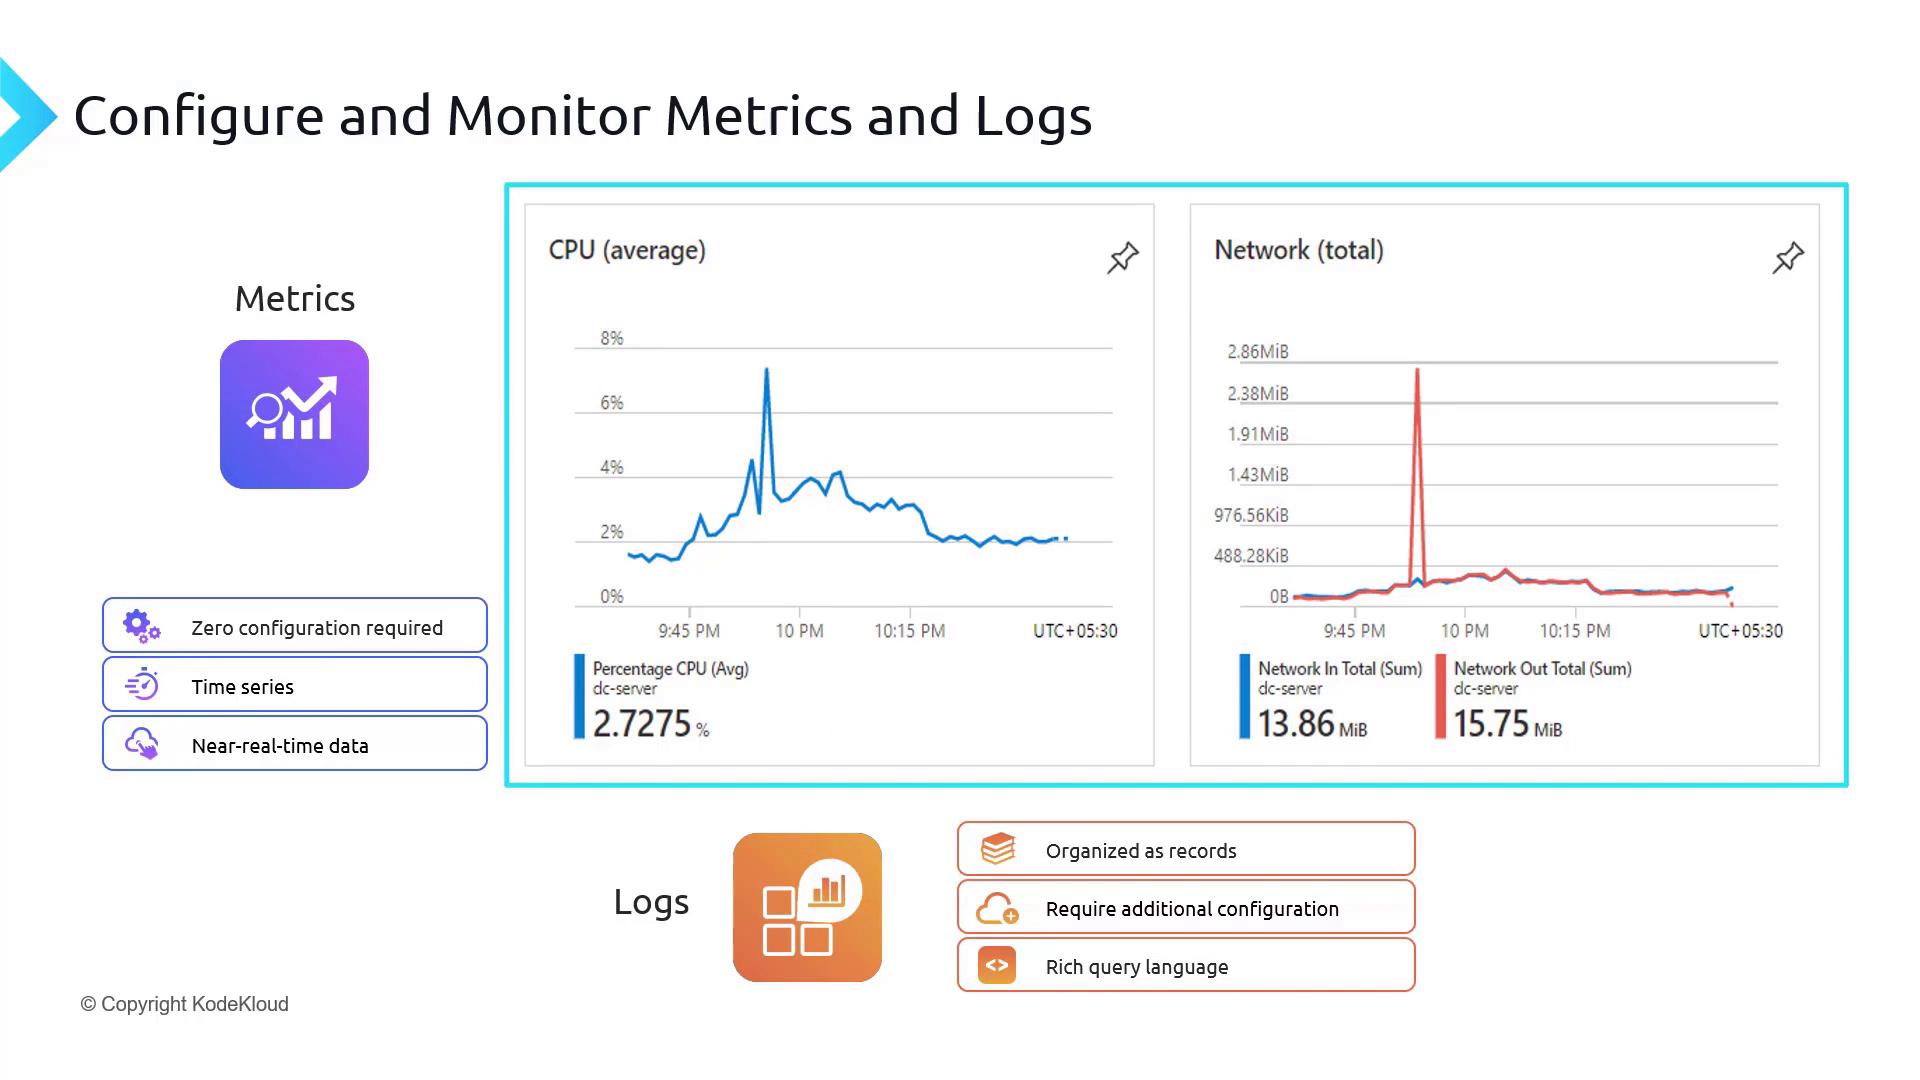
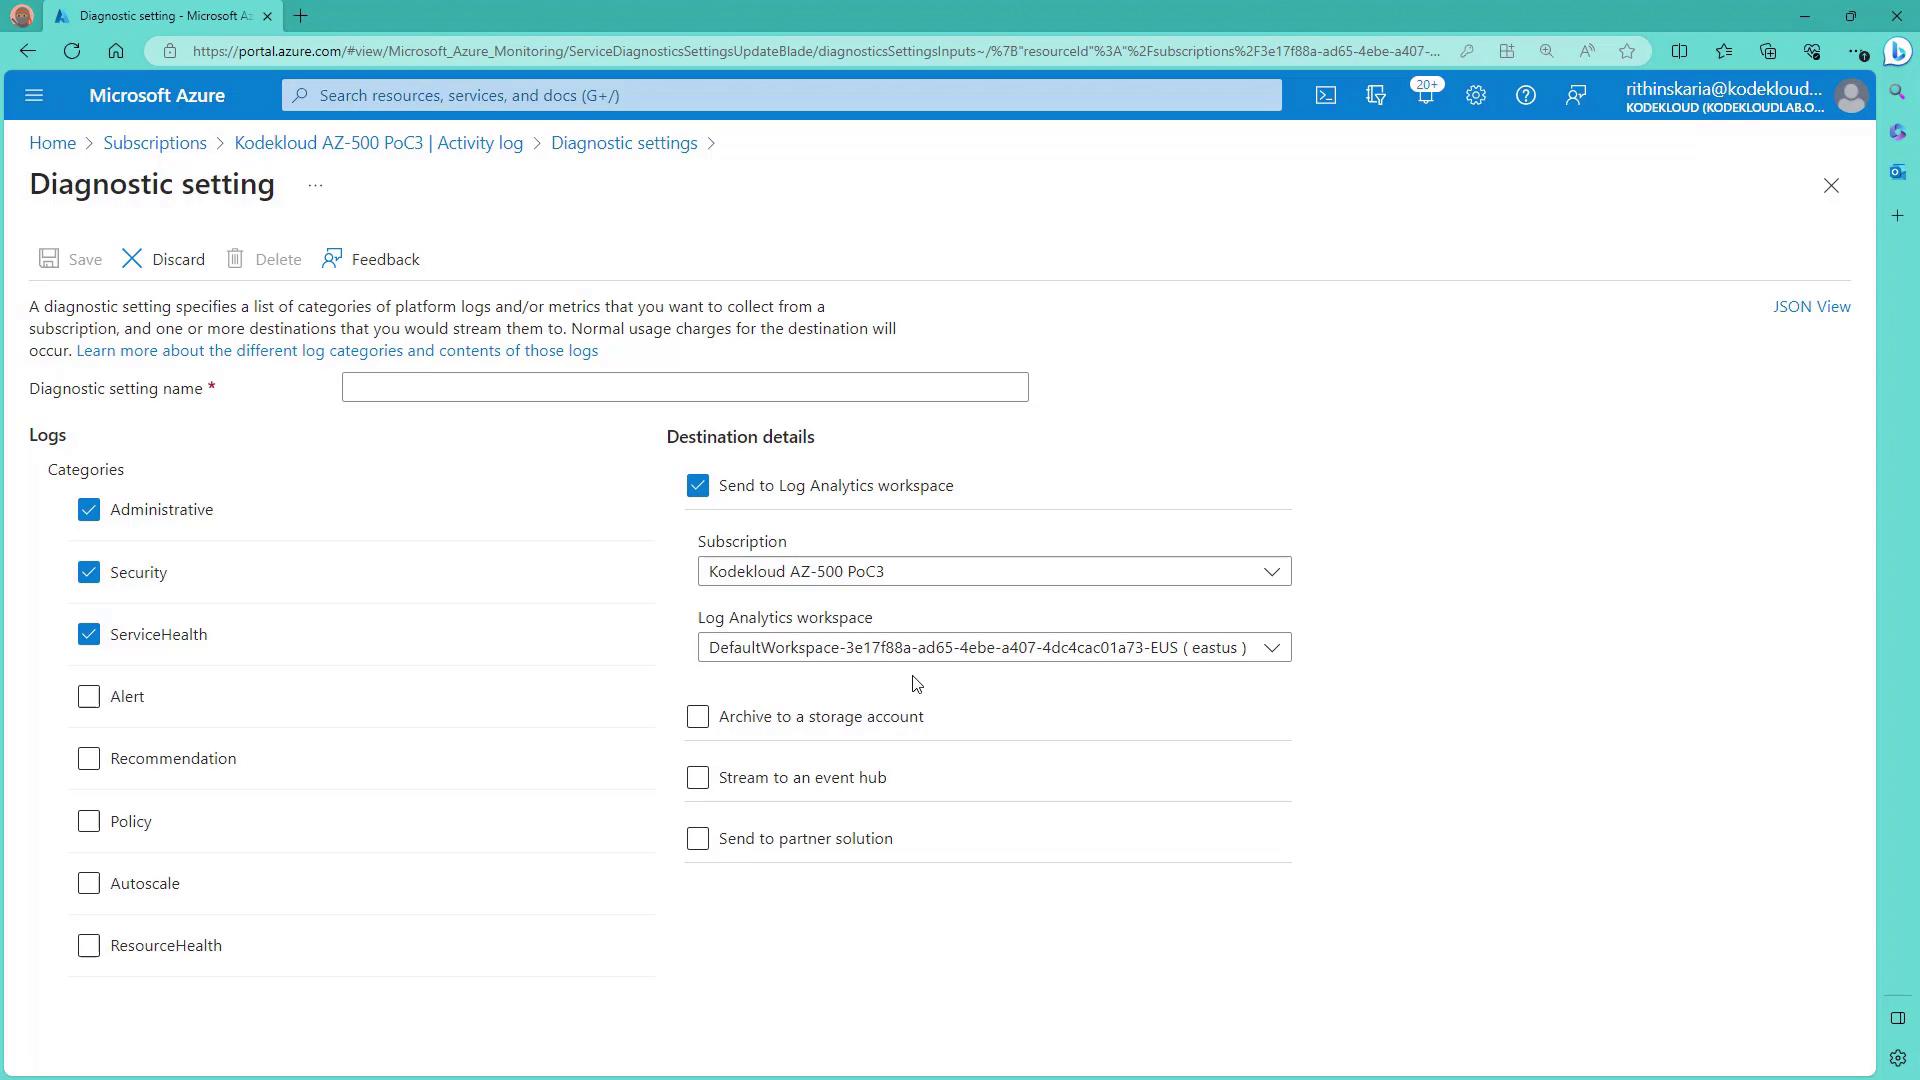
Understanding Logs
In contrast to metrics, logs capture discrete events in the form of records. They require further configuration. For example, to collect logs from an application server, SQL database, or virtual machine, you might need to enable diagnostic settings or install the Azure Monitor agent. Some Azure resources, such as SQL databases, offer native log collection by simply enabling auditing. Azure’s robust Kusto Query Language (KQL) enhances log analysis with support for complex queries, joins, aggregations, and detailed analytics. Below is an example query filtering SQL security audit events:Azure logs provide deep insights into your resource events, allowing you to perform detailed analysis and troubleshooting.
Azure Activity Log
The Azure Activity Log is a subscription-level tool that records critical events related to Azure Resource Manager operations and other subscription events. Key points about the Activity Log include:- Operation Tracking: Captures create, update, and delete operations (e.g., PUT, POST requests); GET requests are not logged.
- Audit Trail: Provides information about who initiated the operation, when it occurred, and its outcomes.
- Retention Policy: Activity Logs are enabled by default with a 90-day retention period. After 90 days, logs are purged unless exported or forwarded to a storage account or Log Analytics workspace.
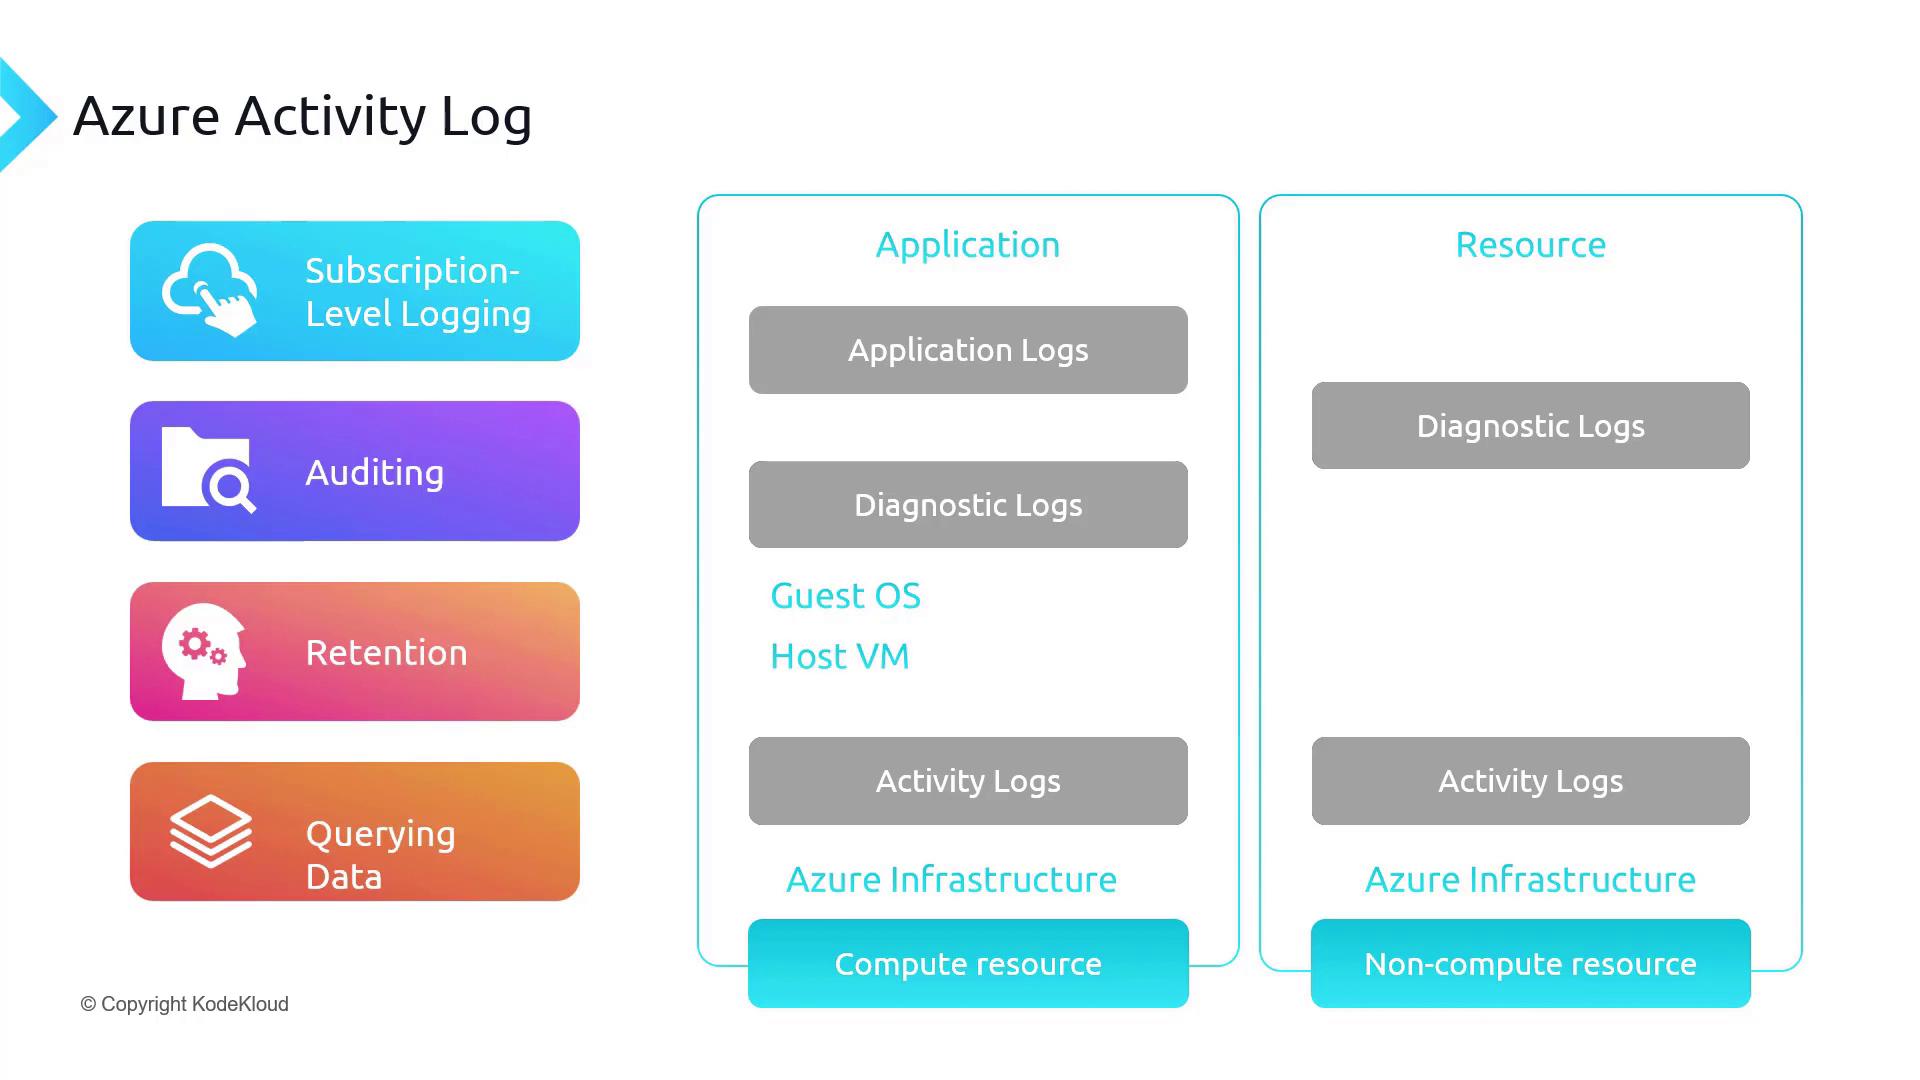
The Activity Log only captures Azure infrastructure-level events. It does not record events that occur within the guest operating system.
Navigating the Azure Portal
When managing your virtual machine or other resources in the Azure portal, you can easily access both metrics and Activity Logs.Viewing Metrics
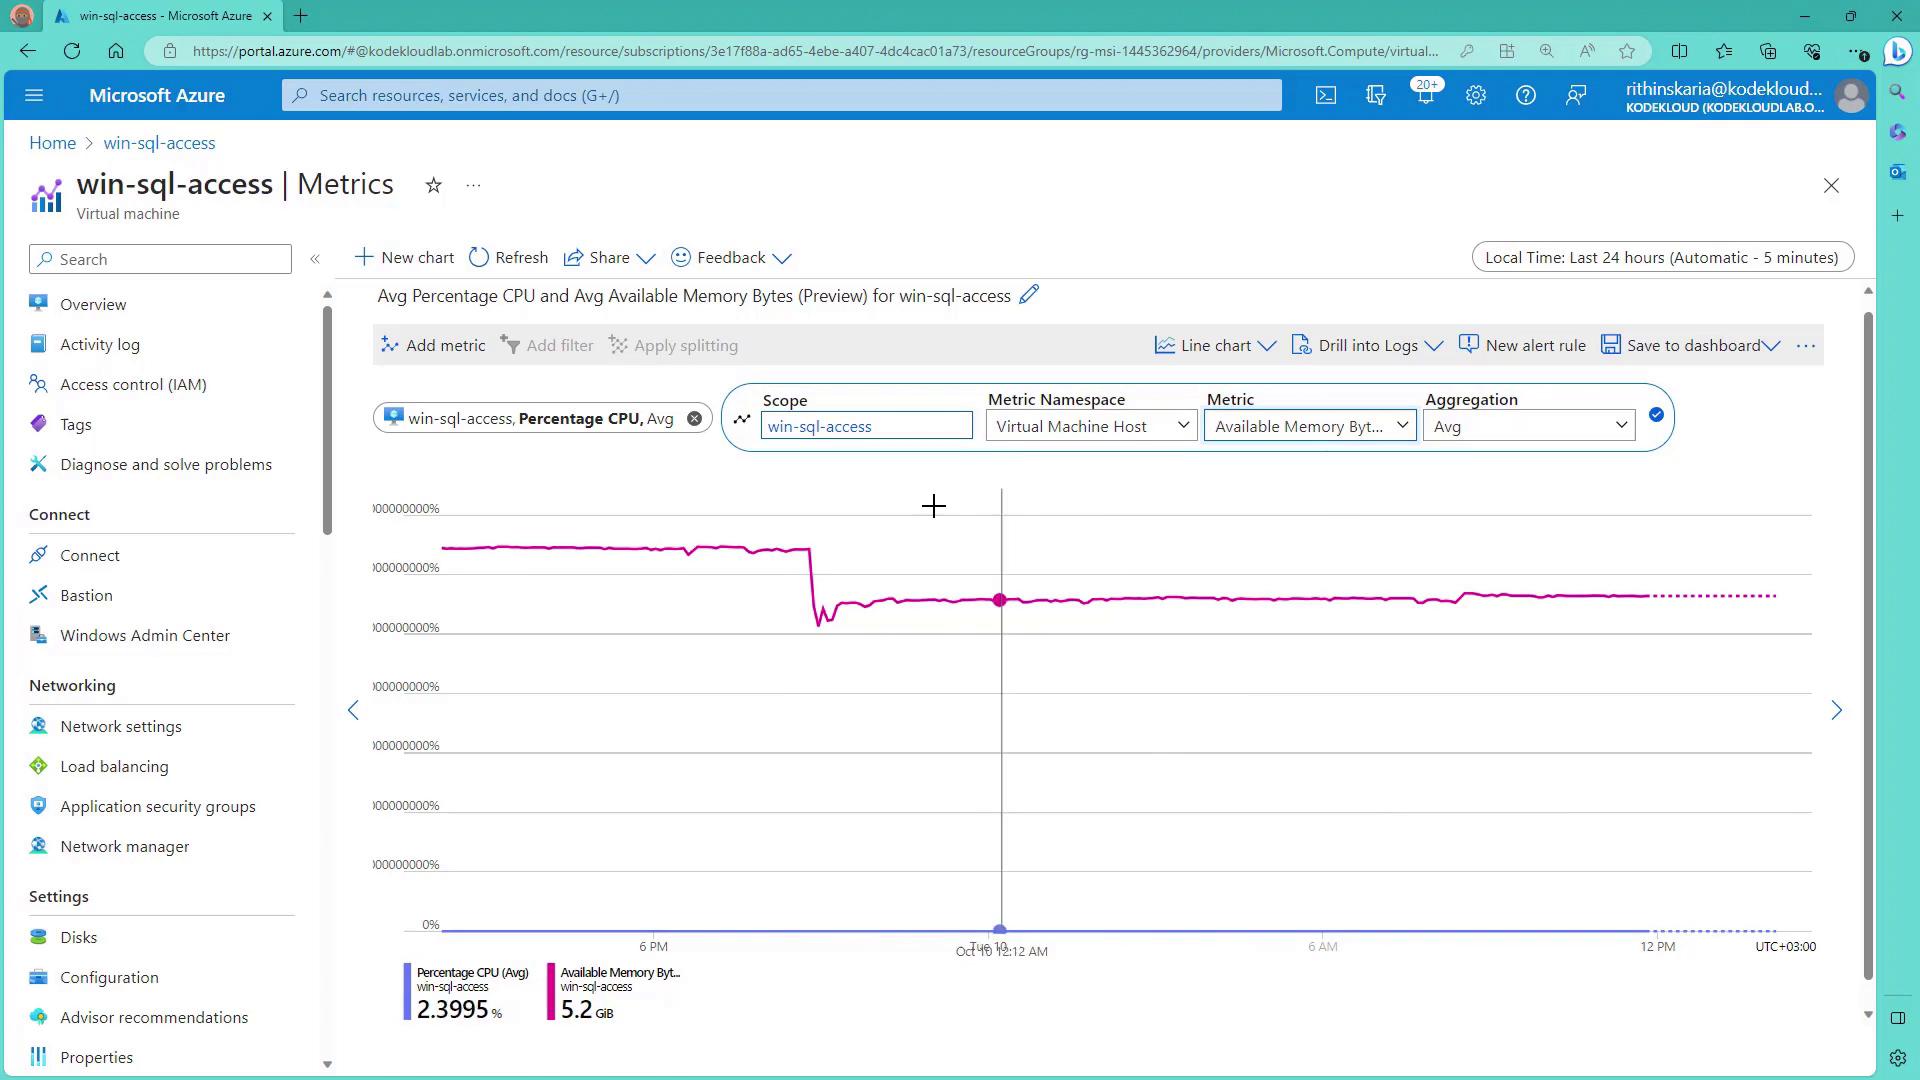
By navigating to the “Monitoring” section of a resource, you can view platform metrics such as CPU usage, memory consumption, and network throughput. Clicking on See all metrics opens the Metrics Explorer.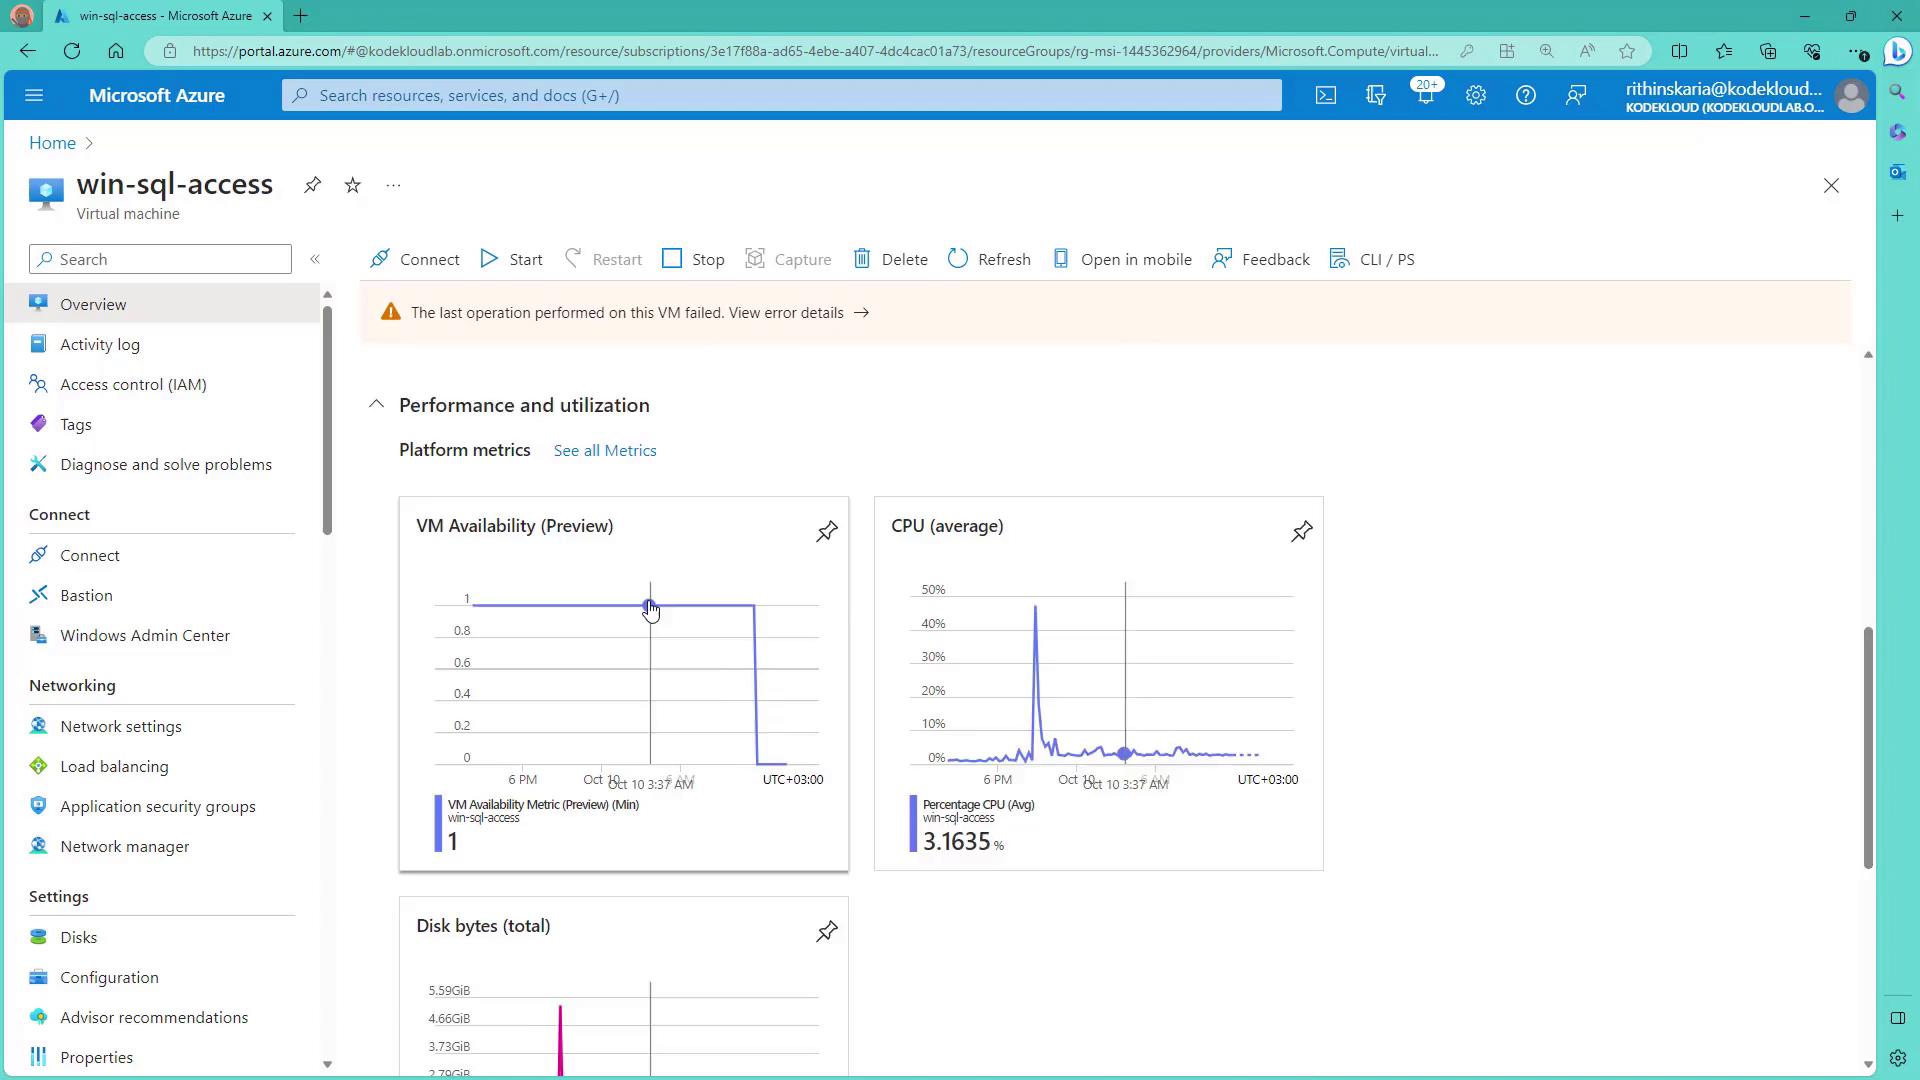
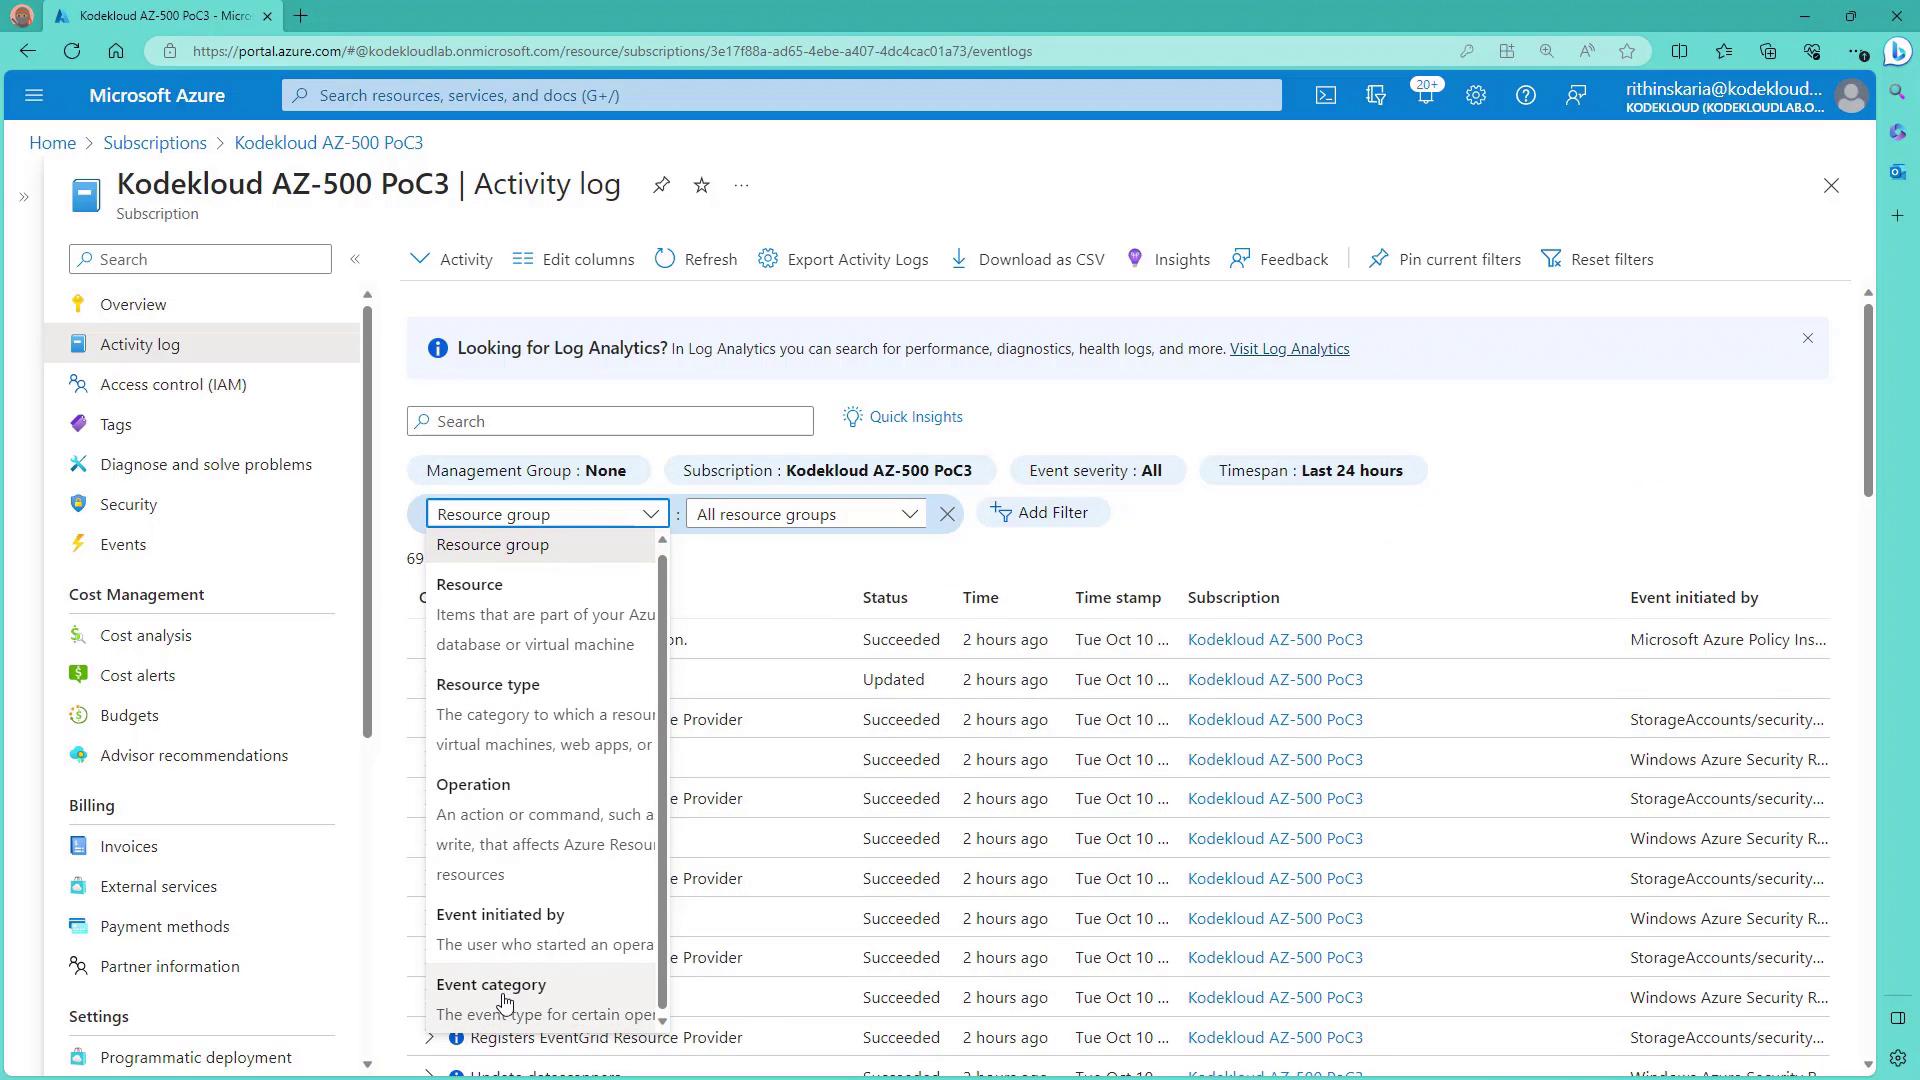
Accessing the Activity Log
To view the Activity Log, select the corresponding blade within the Azure portal. This log can be filtered based on time range, resource group, specific operations, user or service, and event severity. The following categories are available:| Event Category | Description |
|---|---|
| Administrative | Actions performed by administrators, service principals, or user accounts. |
| Security | Alerts from Microsoft Defender for Cloud. |
| Service Health | Indicates the availability and operational status of Azure services. |
| Alerts | Logs triggered by monitoring alerts. |
| Recommendations | Advice from Azure Advisor. |
| Policy | Actions taken as a result of policy enforcement. |
| Auto Scale | Activities related to automatic scaling. |
| Resource Health | The health status of specific resources. |