Microsoft Azure Security Technologies (AZ-500)

Azure Monitor

Enable Log Analytics

Azure Log Analytics is a powerful service that stores, analyzes, and visualizes log data from a wide range of sources—including Azure resources, other cloud providers, and on-premises systems. This guide covers the key features of Log Analytics, how to set up a workspace, and best practices for data collection, visualization, and retention.

Data Collection and Visualization

Azure Log Analytics collects log data by ingesting outputs from various resources into a centralized workspace. Once the data is stored, you can leverage the Kusto Query Language (KQL) to generate detailed reports and visualizations. For instance, the sample query below retrieves the count of successful SQL database authentications over time, then renders the results as a time chart:

AzureDiagnostics
| where Category == 'SqlSecurityAuditEvents' and action_page_s == 'DATABASE AUTHENTICATION SUCCEEDED'
| summarize count() by TimeGenerated, server_principal_name_s
| sort by TimeGenerated
| render timechart

The resulting time chart provides insights into user authentication activities, making it easier to monitor system access and detect anomalies.

Tip

For more information on crafting efficient queries with KQL, refer to the Kusto Query Language documentation.

Creating a Log Analytics Workspace

Before you can ingest data, you need to create a Log Analytics workspace in Azure. This workspace serves as the centralized repository where you collect, analyze, and visualize data from your resources. You can deploy multiple workspaces across different regions based on business needs or compliance requirements.

Data Isolation Consideration

If your environment spans production and disaster recovery (DR) regions, consider setting up separate workspaces. This approach helps maintain data isolation and ensure that production data remains compliant with designated regional policies.

After creating a workspace using the Azure Portal—typically starting with the default "pay-as-you-go" pricing tier—data ingestion begins immediately. If your usage exceeds 100 GB per day, switching to a commitment tier can help reduce the per-gigabyte cost.

Pricing and Data Retention

Log Analytics pricing is determined mainly by:

  1. Data Ingestion Costs – billed per gigabyte of data ingested.
  2. Data Retention Costs – based on the duration logs are retained.

By default, the service includes 30 days of free data retention. Should your requirements call for longer retention (for example, 180 days), you'll need to adjust the workspace settings accordingly. This may involve additional costs, particularly when extending retention for data types such as activity logs, which default to 90 days.

Onboarding and Integrating Resources

A Log Analytics workspace can aggregate data from numerous sources including:

  • Azure, AWS, GCP, and on-premises environments.
  • Agents and services such as Azure Arc.
  • Data collected from Application Insights and Microsoft Sentinel.

Keep in mind that if you integrate with Sentinel, additional charges apply to both Sentinel and the associated Log Analytics data ingestion.

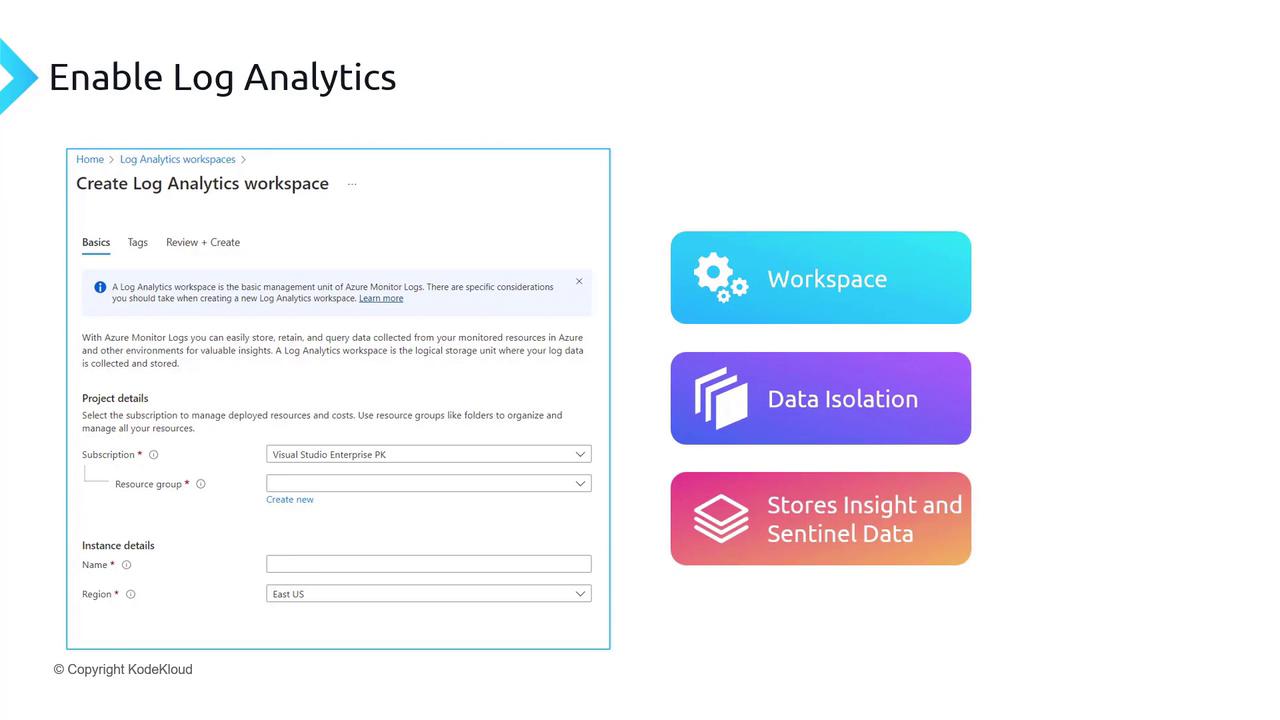
Setting Up a Workspace in the Azure Portal

To set up a new Log Analytics workspace, follow these steps:

  1. Locate and click on "Log Analytics workspaces" in the Azure Portal.
  2. Create a new workspace by specifying a resource group (e.g., "RG Monitoring") and a workspace name (e.g., "LAW Monitoring").
  3. Choose the region where the workspace will reside (e.g., East US).
  4. Confirm the pricing tier, which defaults to pay-as-you-go. Upgrade to a commitment tier if you expect high data ingestion volumes (greater than 100 GB per day).

After completing these steps, onboard your resources to begin collecting and analyzing log data.

The image shows a setup interface for creating a Log Analytics workspace in Azure, alongside features like workspace, data isolation, and storage of insights and sentinel data.

This concludes the walkthrough on setting up and understanding the basics of Log Analytics. Stay tuned for more insights on managing connected sources and optimizing your log analytics strategy.

For further reading, consider exploring these resources:

Watch Video

Watch video content

Previous
Configure and monitor metrics and logs