This article provides a guide on managing connected sources for Log Analytics in various environments, focusing on agent installation and data ingestion methods.
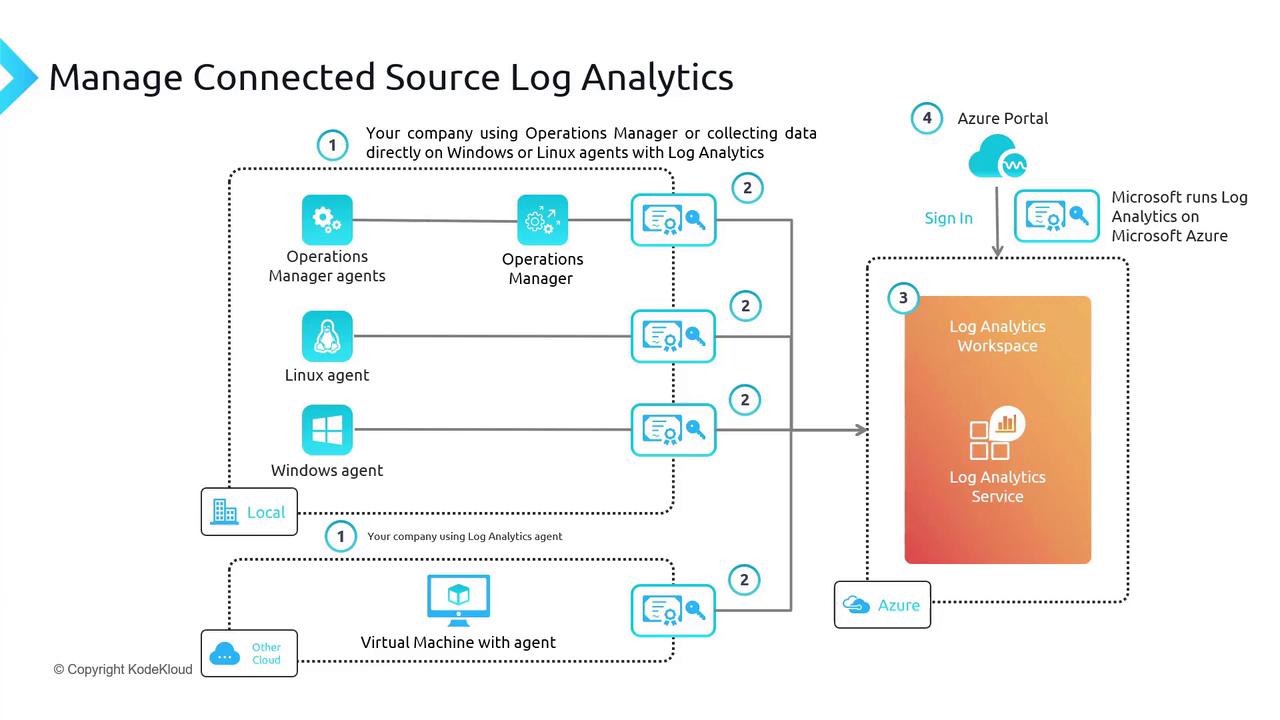
This article provides a comprehensive guide on managing connected sources for Log Analytics across various environments, including on-premises setups and other clouds such as AWS and GCP. Data from these environments can be ingested into Azure using agents. Note that the legacy Log Analytics Agent (also known as the Microsoft Monitoring Agent or MMA) is being deprecated; the recommended replacement is the Azure Monitoring Agent (AMA), onboarded via Azure Arc for non-Azure machines.Even though exam content has yet to be updated, both the legacy method (using MMA) and the new approach (using AMA with Azure Arc) are covered here to ensure you are well-informed from both an exam perspective and real-world implementation standpoint.
Traditionally, on-premises machines (or machines outside Azure) would have the Log Analytics Agent installed, along with the workspace key, to enable communication with Log Analytics. With Azure Arc, non-Azure machines can be managed and extensions pushed to them similarly as with Azure VMs. It is important to note that regardless of whether you use MMA or AMA, an agent must be installed on the machine to collect logs and metrics.Once machines are onboarded to Log Analytics, you can run queries in the Azure Portal to visualize and analyze the collected data.
Data ingestion is organized into various tables. For example, Windows event logs are stored in the “Event” table, while syslog entries appear in the “Syslog” table. The following sample queries demonstrate how to work with these tables:
Copy
Syslog| union Event| where SeverityLevel == "Error"
Copy
Heartbeat| where ComputerIP startswith "52" and Computer startswith "DC"| where OSType == "Windows" and OSName contains "2016"
Copy
Perf| where CounterName == "Available MBytes" and Computer == "JBOX00"| project TimeGenerated, CounterValue| sort by TimeGenerated asc| render timechart
The “Heartbeat” table verifies that each machine’s agent (whether MMA or AMA) is reporting back to Log Analytics, while the “Perf” table collects performance metrics. Custom logs can also be created using your own table names, and alert data is stored in an “Alert” table. All this data can be efficiently queried using the Kusto Query Language.
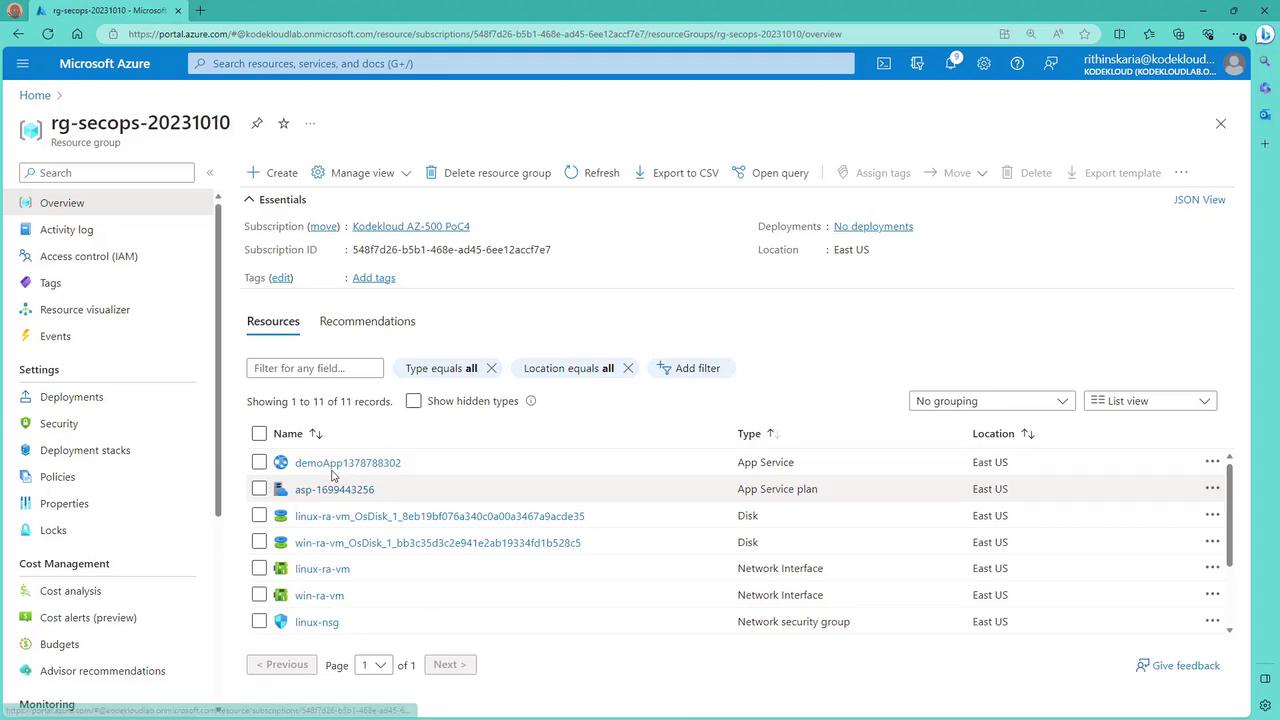
Machines can be onboarded to Log Analytics directly from the Azure Portal. This guide demonstrates both methods: the legacy MMA and the new AMA with Azure Arc. A script available in the Security Operations GitHub repository—named “monitoring prep infrastructure partial script”—can automatically create a resource group (e.g., “rgsecops”), two virtual machines (one Windows and one Linux), and a web app.After running the script, you will see all the created resources in the new resource group:
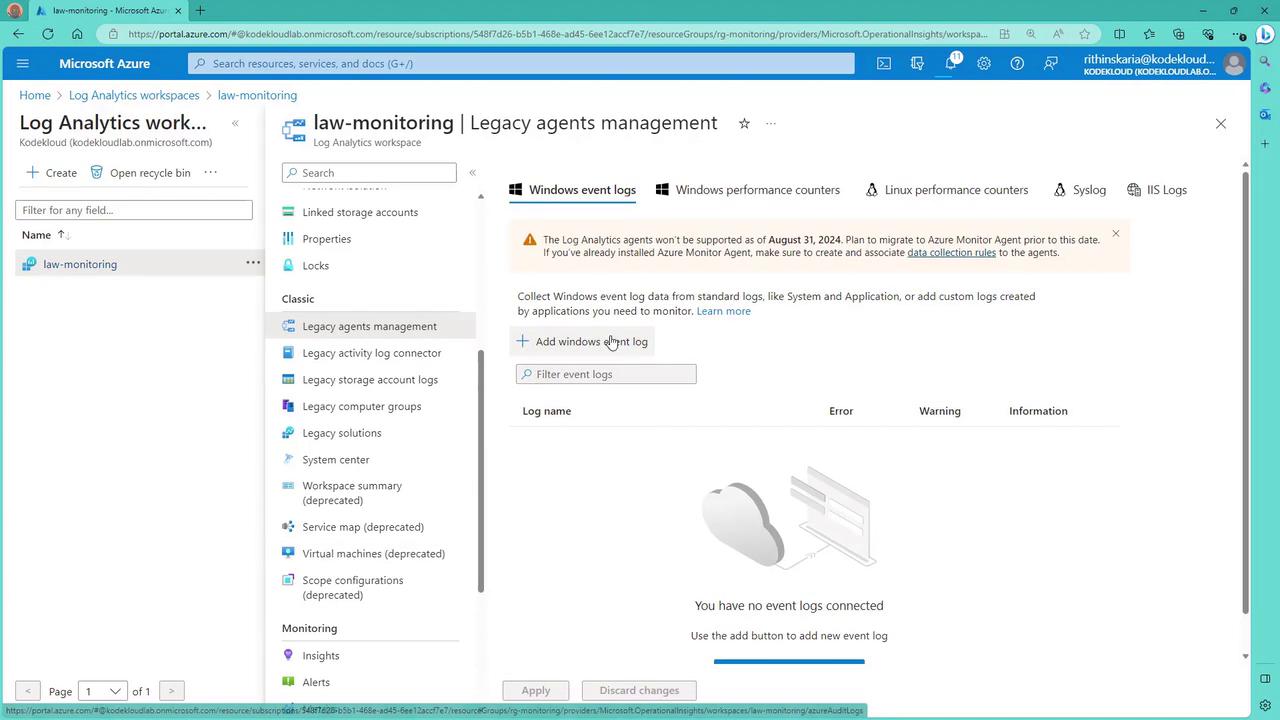
Let’s review the legacy method using MMA, which is scheduled for deprecation in August 2024. To onboard a machine with MMA, navigate in the Azure Portal to your Log Analytics workspace, then select “Sources” → “Virtual Machines” to view onboarded machines. Click “Connect” for the machine you wish to onboard.
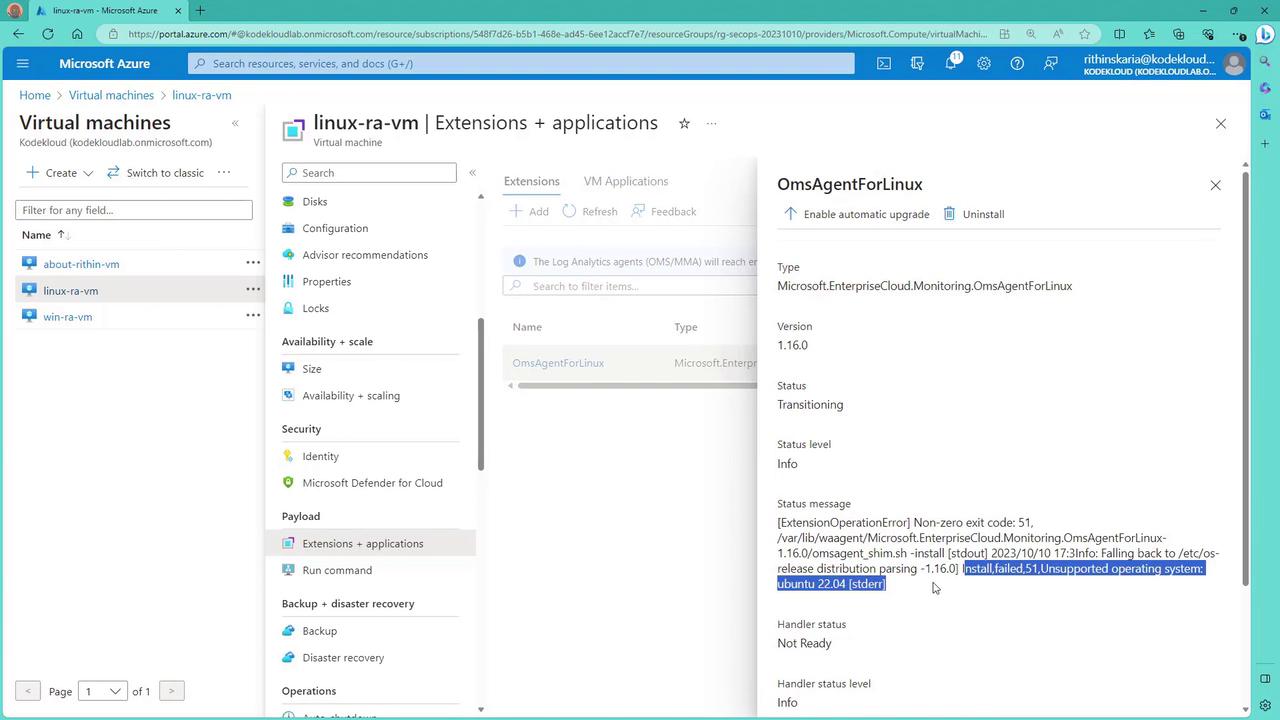
Not all operating systems are supported by MMA. For example, Ubuntu 22.04 may not be supported.
While the connection process is initiated, you can also manage legacy agents:
Check the virtual machine’s “Extensions” blade to confirm agent installation. If you encounter an error such as “Install failed unsupported operating system” for the OMS agent on Linux, it signals a need to migrate to AMA.
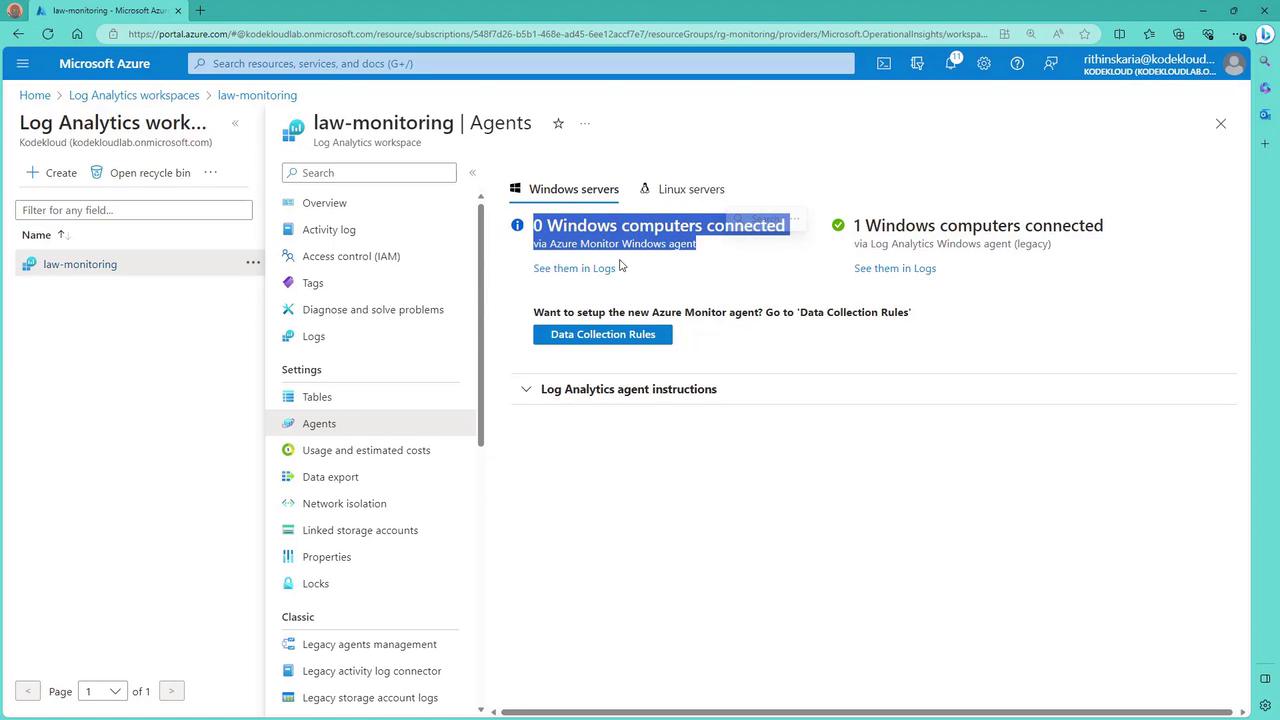
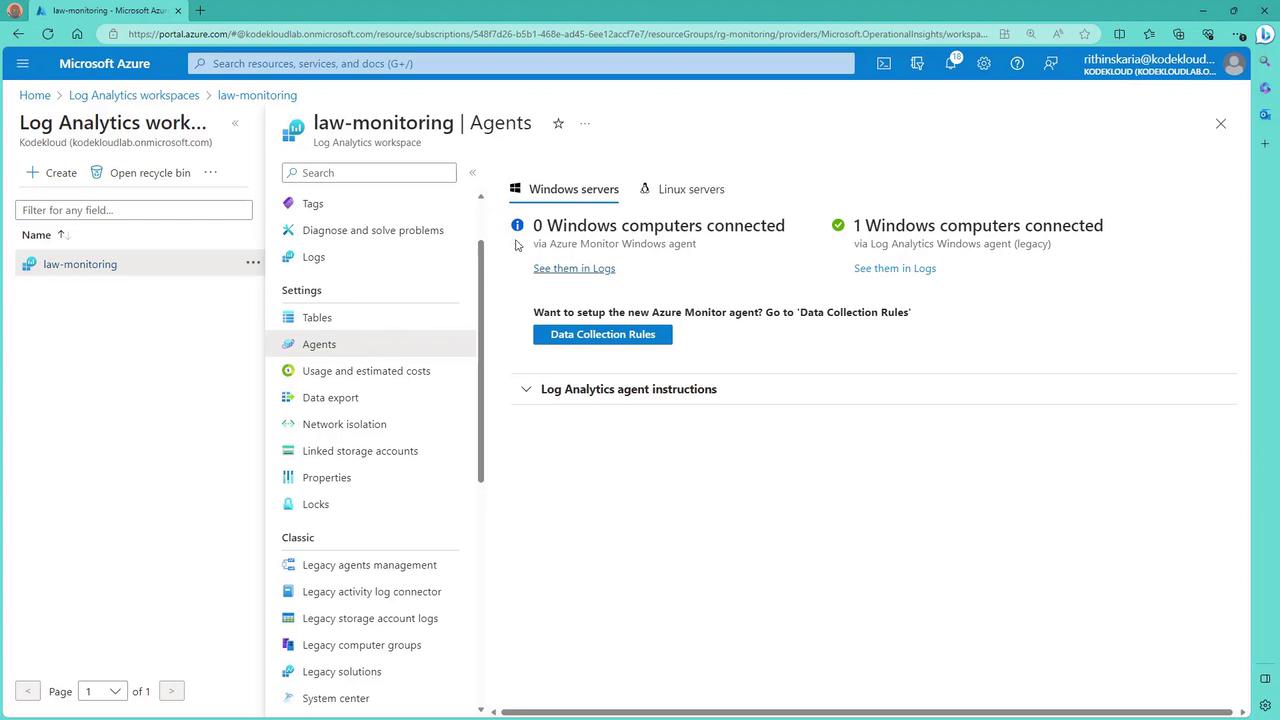
In your Log Analytics workspace, you will see one Windows machine connected using the legacy agent and no machines connected via the Azure Monitor Agent if it is not configured.
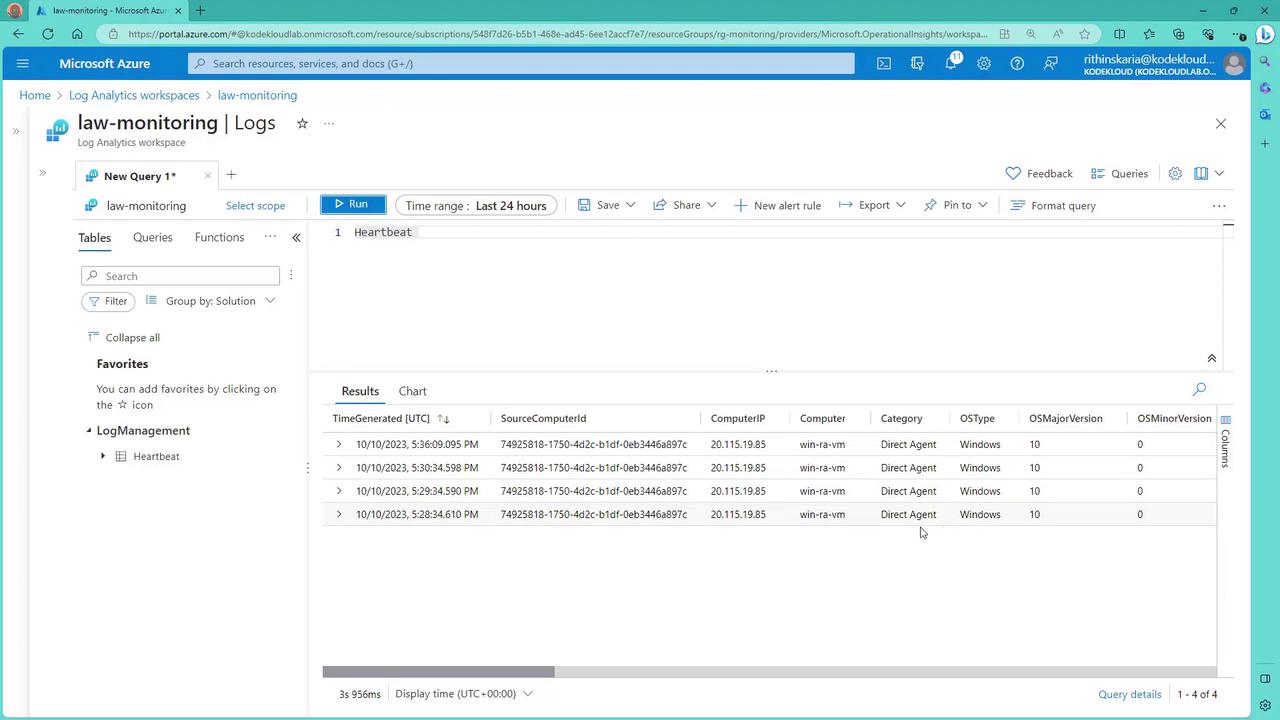
Opening the Logs section and executing a query for “Heartbeat” confirms the connection from the Windows machine:
Configuring Azure Monitor Agent (AMA) Using Data Collection Rules
To implement the newer approach, you will use the Azure Monitor Agent (AMA) with Data Collection Rules (DCRs). These rules specify which data to collect and from which resources. While both MMA and AMA can run concurrently, doing so will result in duplicate data being sent to Log Analytics, which can impact billing.Follow these steps to create a DCR using AMA:
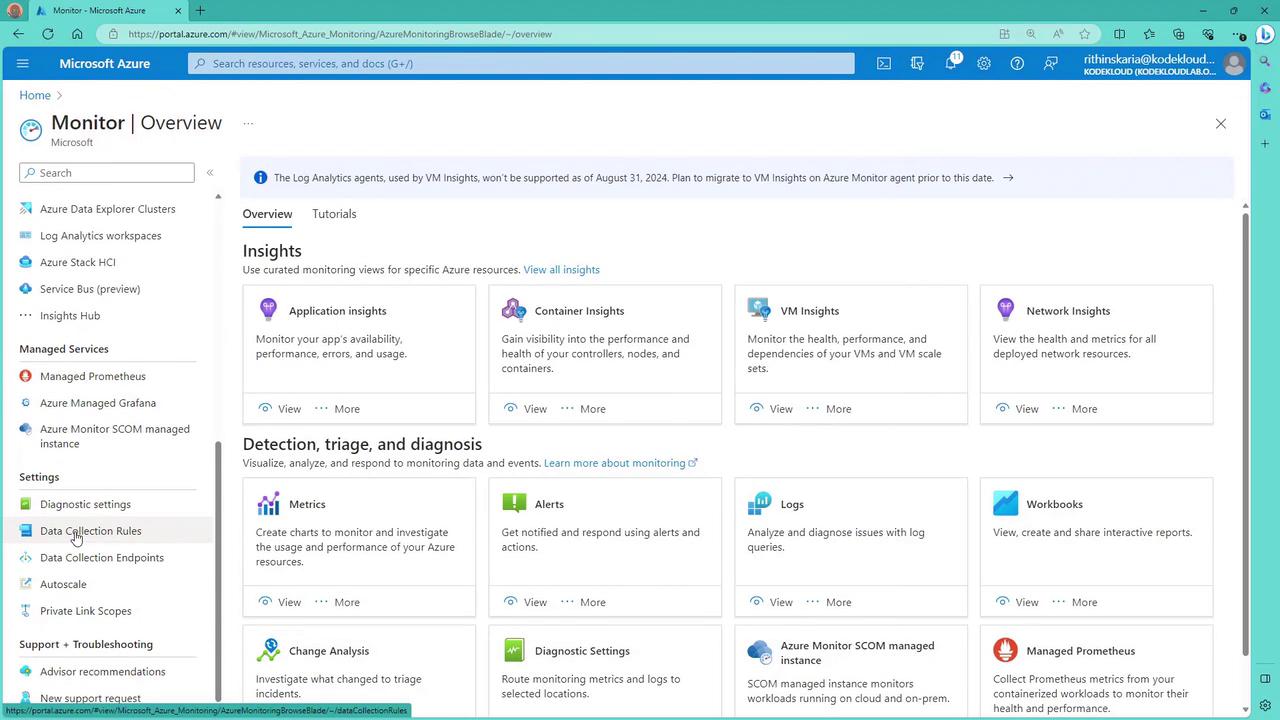
In the Azure Portal, navigate to “Monitor” then “Data Collection Rules.”
Create a new rule (e.g., “AMA DCR”) in your monitoring resource group.
Within the DCR creation interface:
Select the platform type (“All” to cover both Windows and Linux).
Add resources from your resource group (e.g., under “SecOps”).
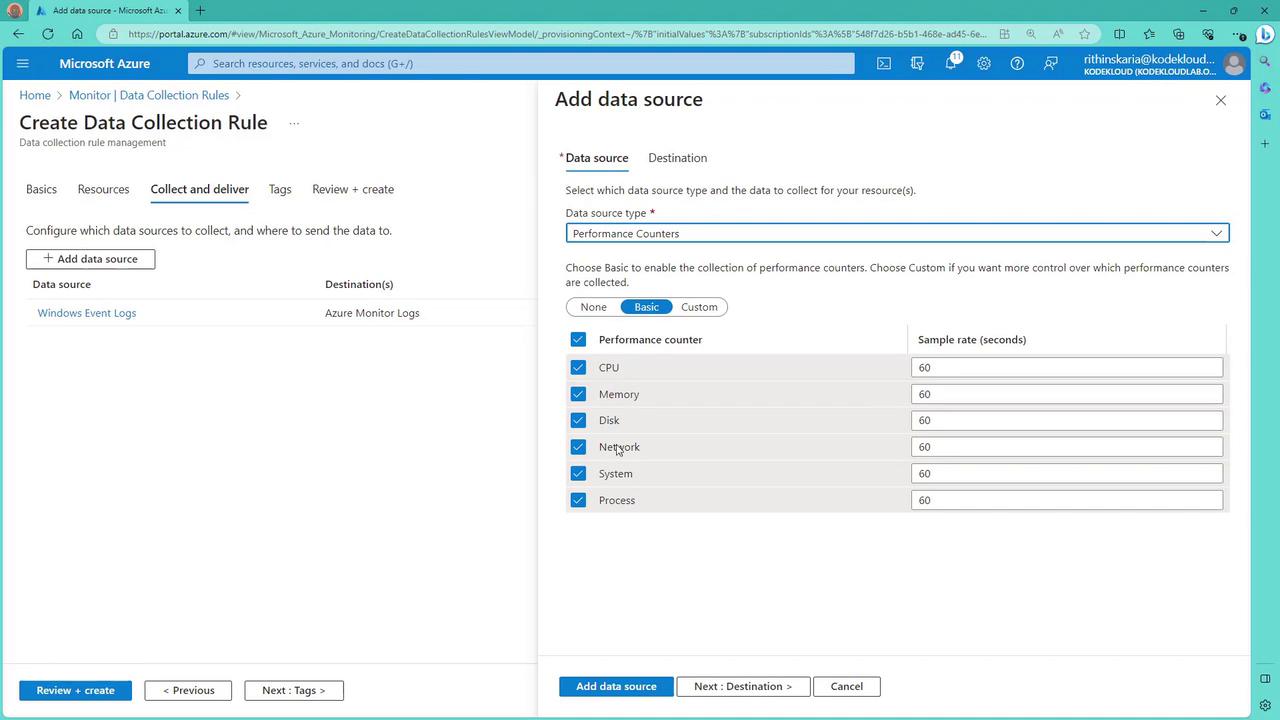
Add data sources such as Windows Event Logs, Performance Counters, and Linux Syslog.
For Windows Event Logs, configure the log levels (e.g., capture all critical events from Application Security) and set the destination to your Log Analytics workspace. Similar steps apply for adding performance counters like CPU, memory, disk, network, system, and process:
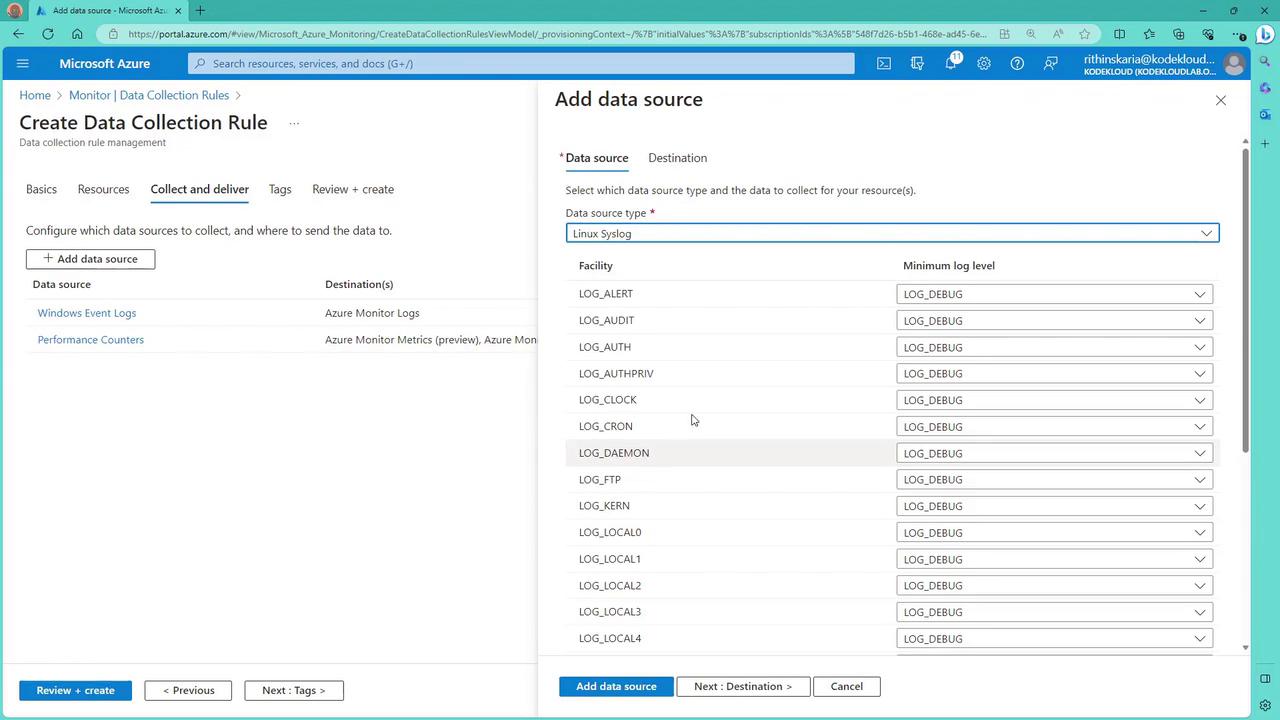
For Linux Syslog collection, configure the necessary log facilities and set the minimum log levels, directing the output to your Log Analytics workspace:
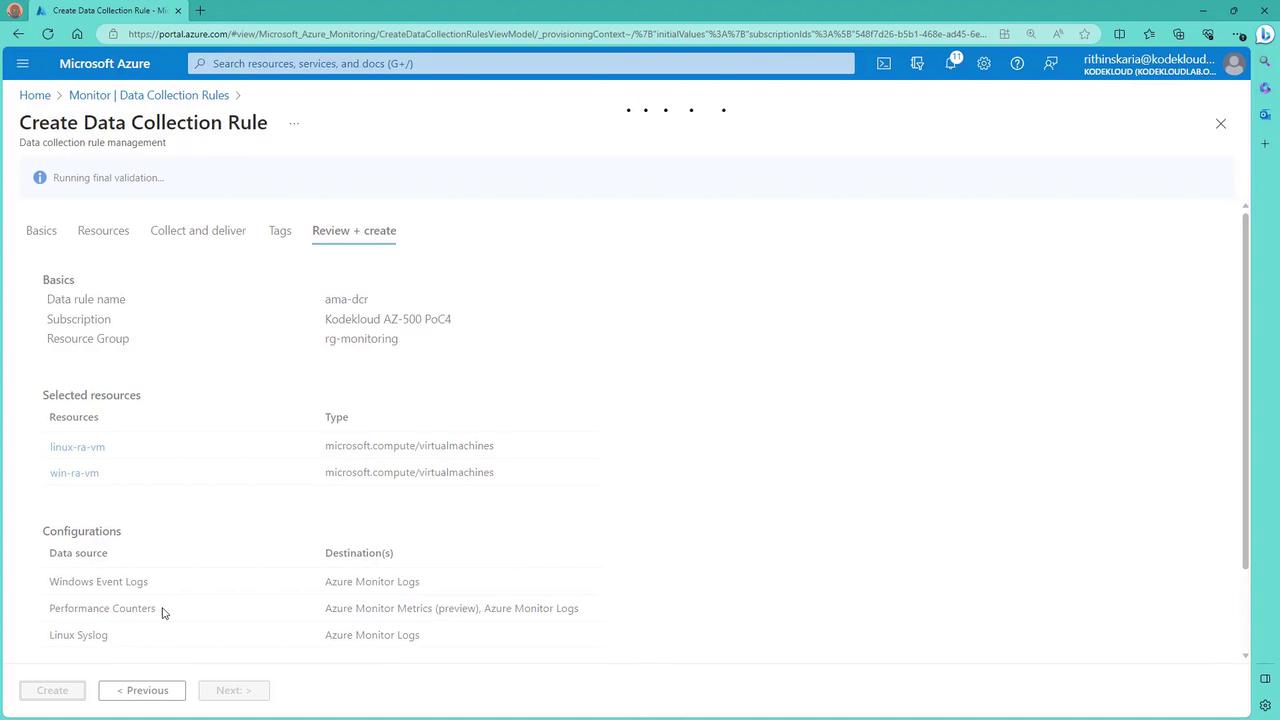
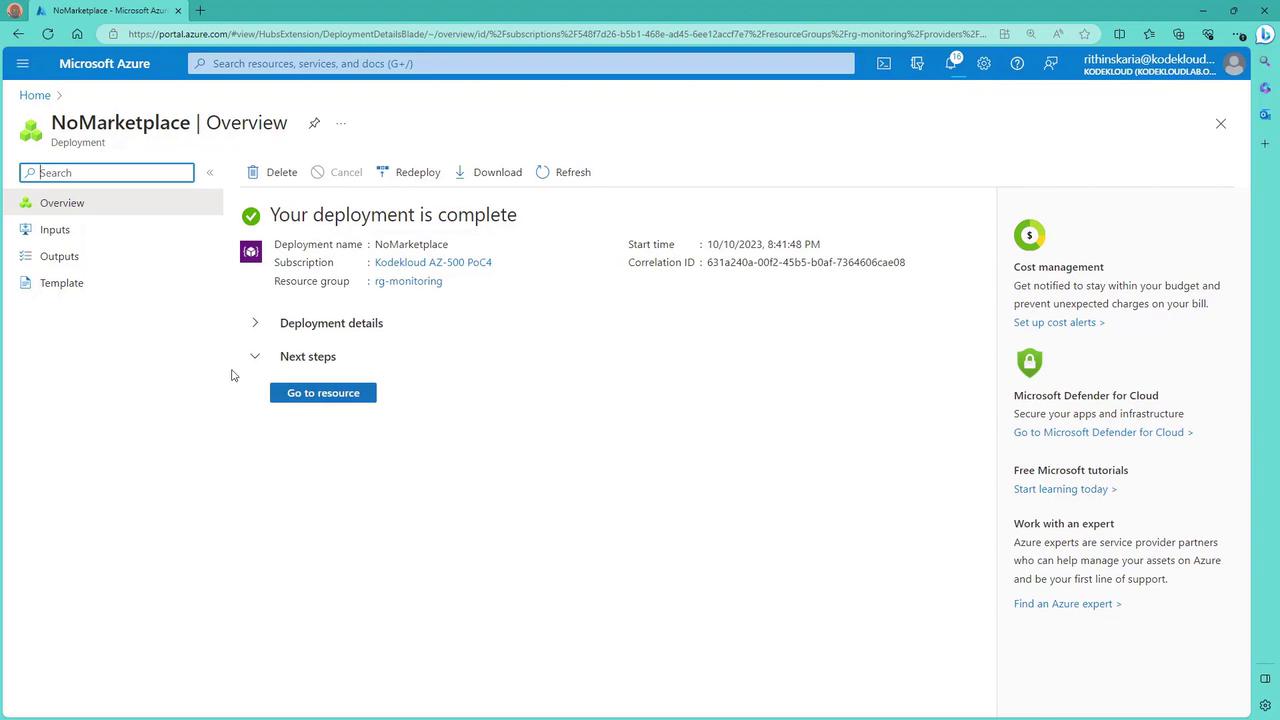
Review your settings and create the rule. During this process, a system-assigned managed identity is established for agent installation, and the extension installation is automatically initiated.
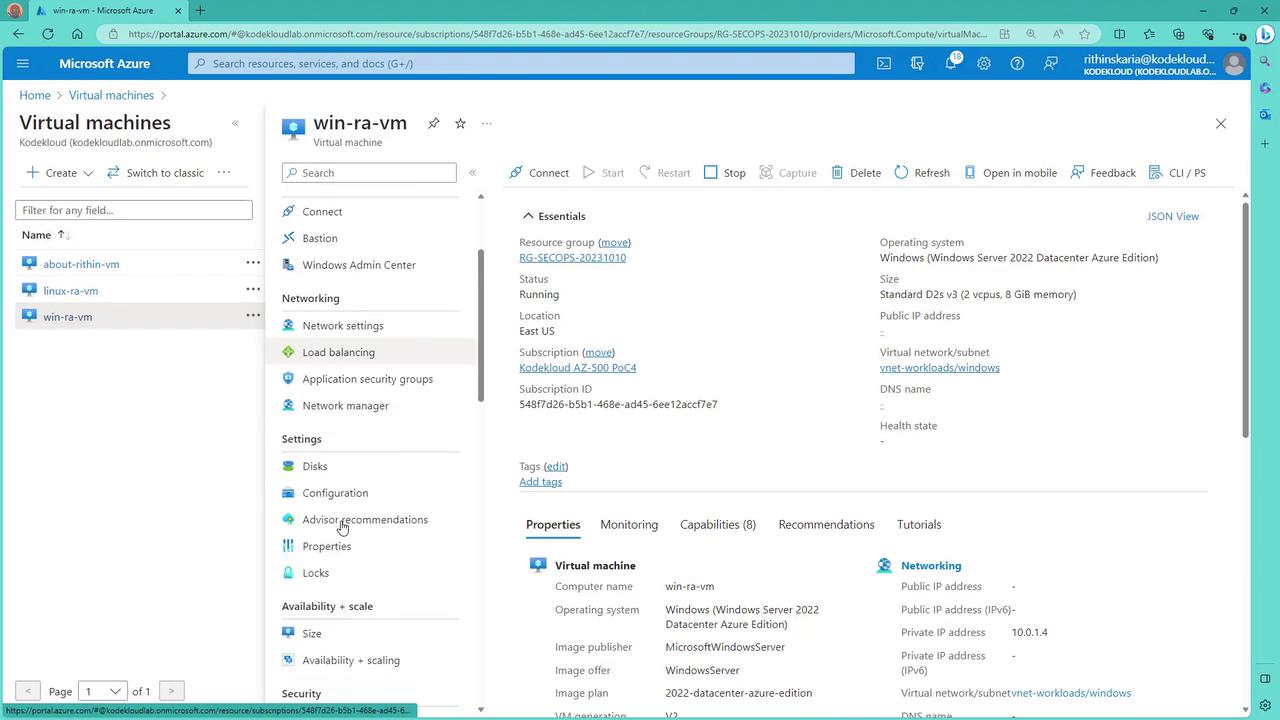
After deployment, verify the installation from the virtual machine extensions pane for both Windows and Linux:
Select your Windows machine and check its extensions:
At this stage, you should see the Azure Monitoring Windows Agent (AWM) installed. For Linux, the agent installation will update soon if it was previously unsupported. Return to the Log Analytics workspace to review agent statuses. Note that AMA data might not be immediately reflected; wait for the first heartbeat from the new agent.
After a short period, you should see one Windows computer and one Linux computer connected via AMA. Verify the heartbeat logs for the Linux machine with a query like the following:
Copy
Heartbeat| where OSType == 'Linux'| where Category == 'Azure Monitor Agent'| summarize arg_max(TimeGenerated, *) by SourceComputerId| sort by Computer| render table
To check distinct computers, execute:
Copy
Heartbeat| distinct Computer
And review heartbeat details along with category information using:
Copy
Heartbeat| distinct computer, category
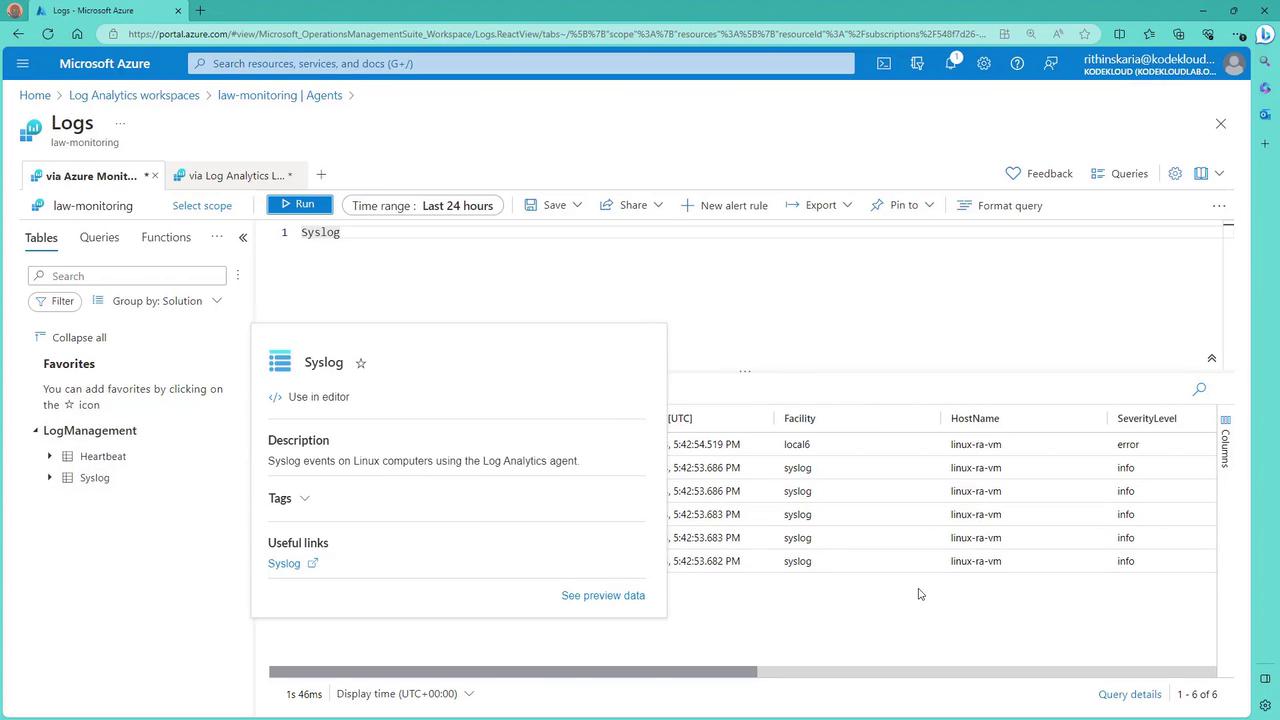
Some machines might report two heartbeats (one from the legacy agent and one from AMA) while others report only from AMA. You can also verify syslog messages being ingested:
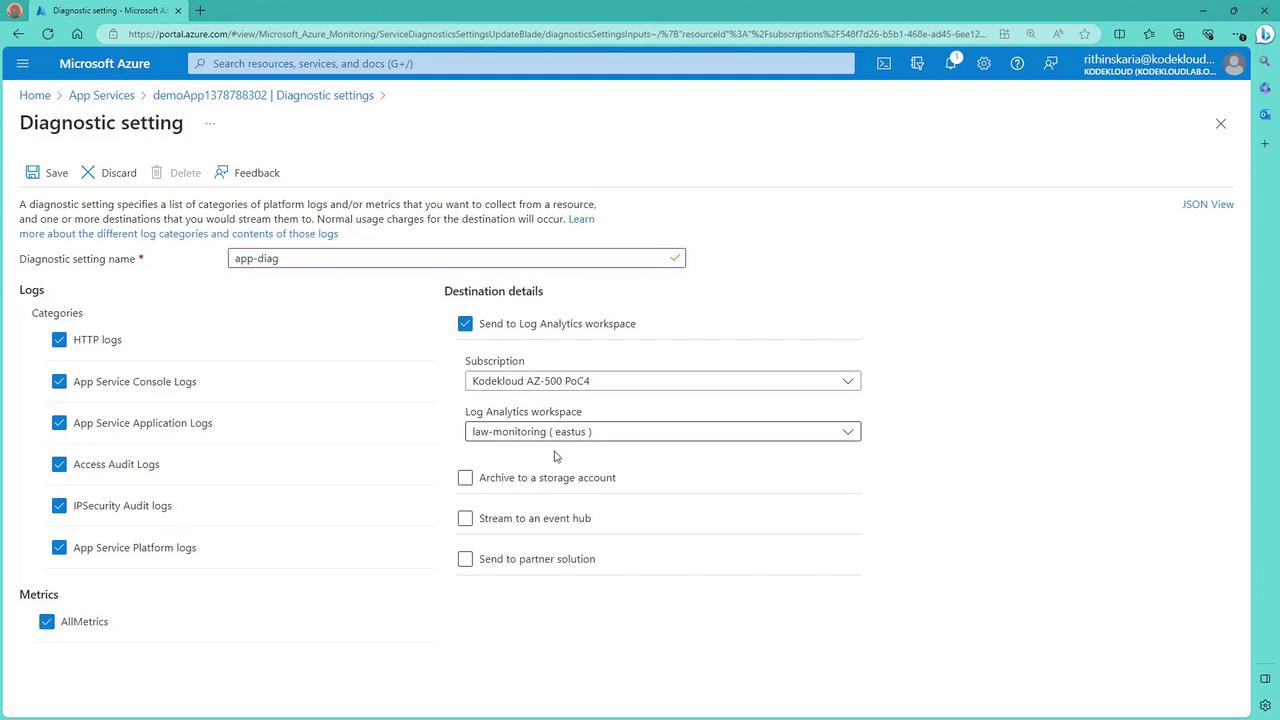
For Platform as a Service (PaaS) resources like app services, an agent installation is not required because the compute is managed by Microsoft. Instead, configure diagnostic settings to collect logs. In the Azure Portal, navigate to the web app, go to “Diagnostic Settings,” and create a new diagnostic setting. Select relevant log categories (e.g., HTTP logs, event logs) and direct the output to your Log Analytics workspace.
After configuration, review the logs in the Log Analytics workspace. A new table, such as “AppServiceHTTPLogs,” will display HTTP request details including status codes and query information:
Depending on the resource type, logs are stored either in dedicated tables (like “AppServiceHTTPLogs” for web apps) or in the generic “AzureDiagnostics” table (for resources such as SQL auditing). Adjust your queries accordingly to analyze the data.
This article has demonstrated how to onboard machines and other resources to Log Analytics using both the legacy MMA and the modern AMA (via Azure Arc and Data Collection Rules) approaches. For new deployments, it is recommended to adopt the Azure Monitor Agent (AMA) with ARM-based configurations. Although current exams might still focus on MMA, future updates are expected to incorporate AMA and Kubernetes monitoring.Next, we will explore Azure Monitor alerts.Explore More on Azure Monitor Alerts