Microsoft Azure Security Technologies (AZ-500)

Azure Monitor

Enable Azure monitor Alerts

This article explains how to enable Azure Monitor Alerts so you can receive notifications about events happening within your Azure subscription. With Azure Monitor Alerts, you get a unified authoring experience to create alerts from activity logs, service health events, log analytics, metrics, and more. This guide covers the four main components of an alert rule – Scope, Condition, Action, and Rule Details – and demonstrates how to set up notifications and automation using action groups.

Overview of Alert Rules

Azure Alerts allow you to assign severities (from zero to four) to prioritize alerts and categorize them by user response status (new, acknowledged, or closed). You can also integrate alerts with action groups to define your notification and automation preferences such as email, SMS, phone calls, automation accounts, function apps, logic apps, webhooks, and more.

There are four key stages when creating an alert rule:

  1. Scope: Define which resources are included in the alert (similar to RBAC or policy scopes).
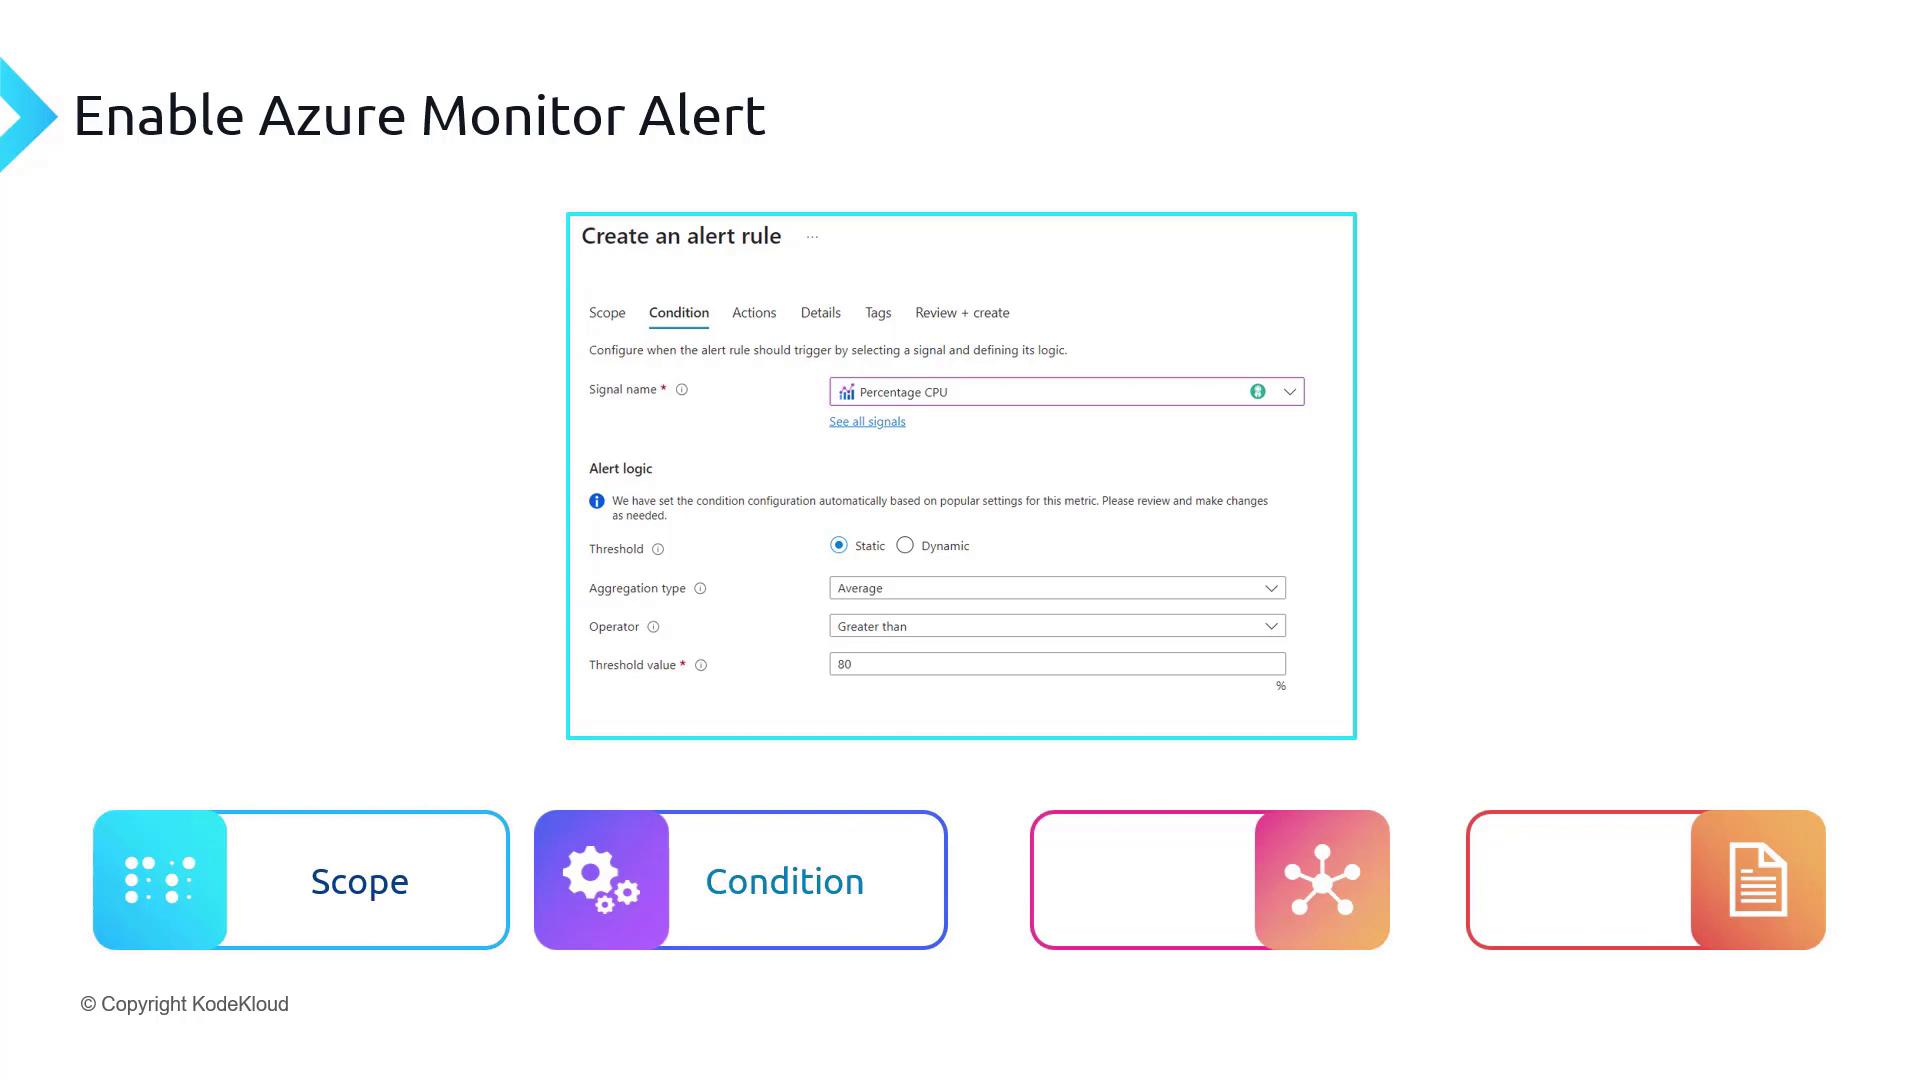
  2. Condition: Specify the signal (e.g., Percentage CPU) and the criteria (e.g., CPU utilization exceeding 80%) that trigger the alert.
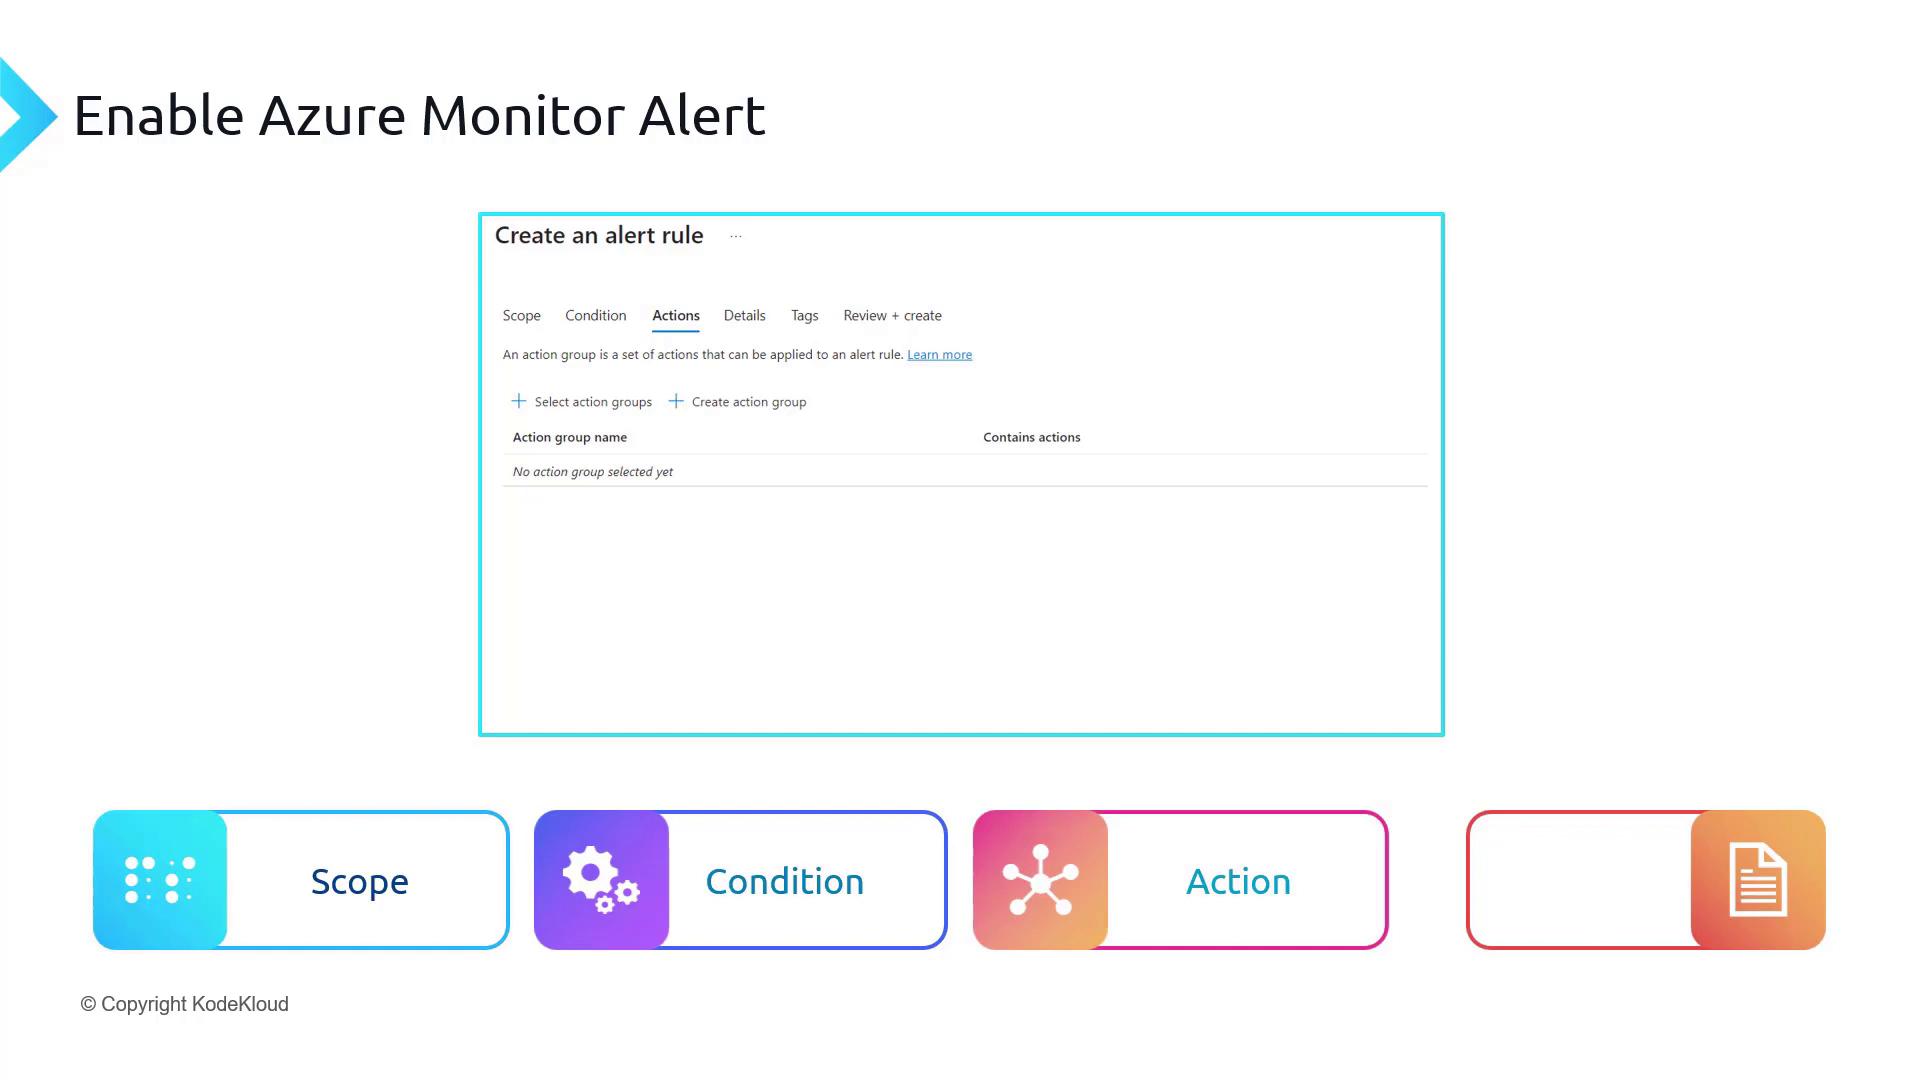
  3. Action: Configure an action group—the set of notification and automation actions to execute when the alert fires.
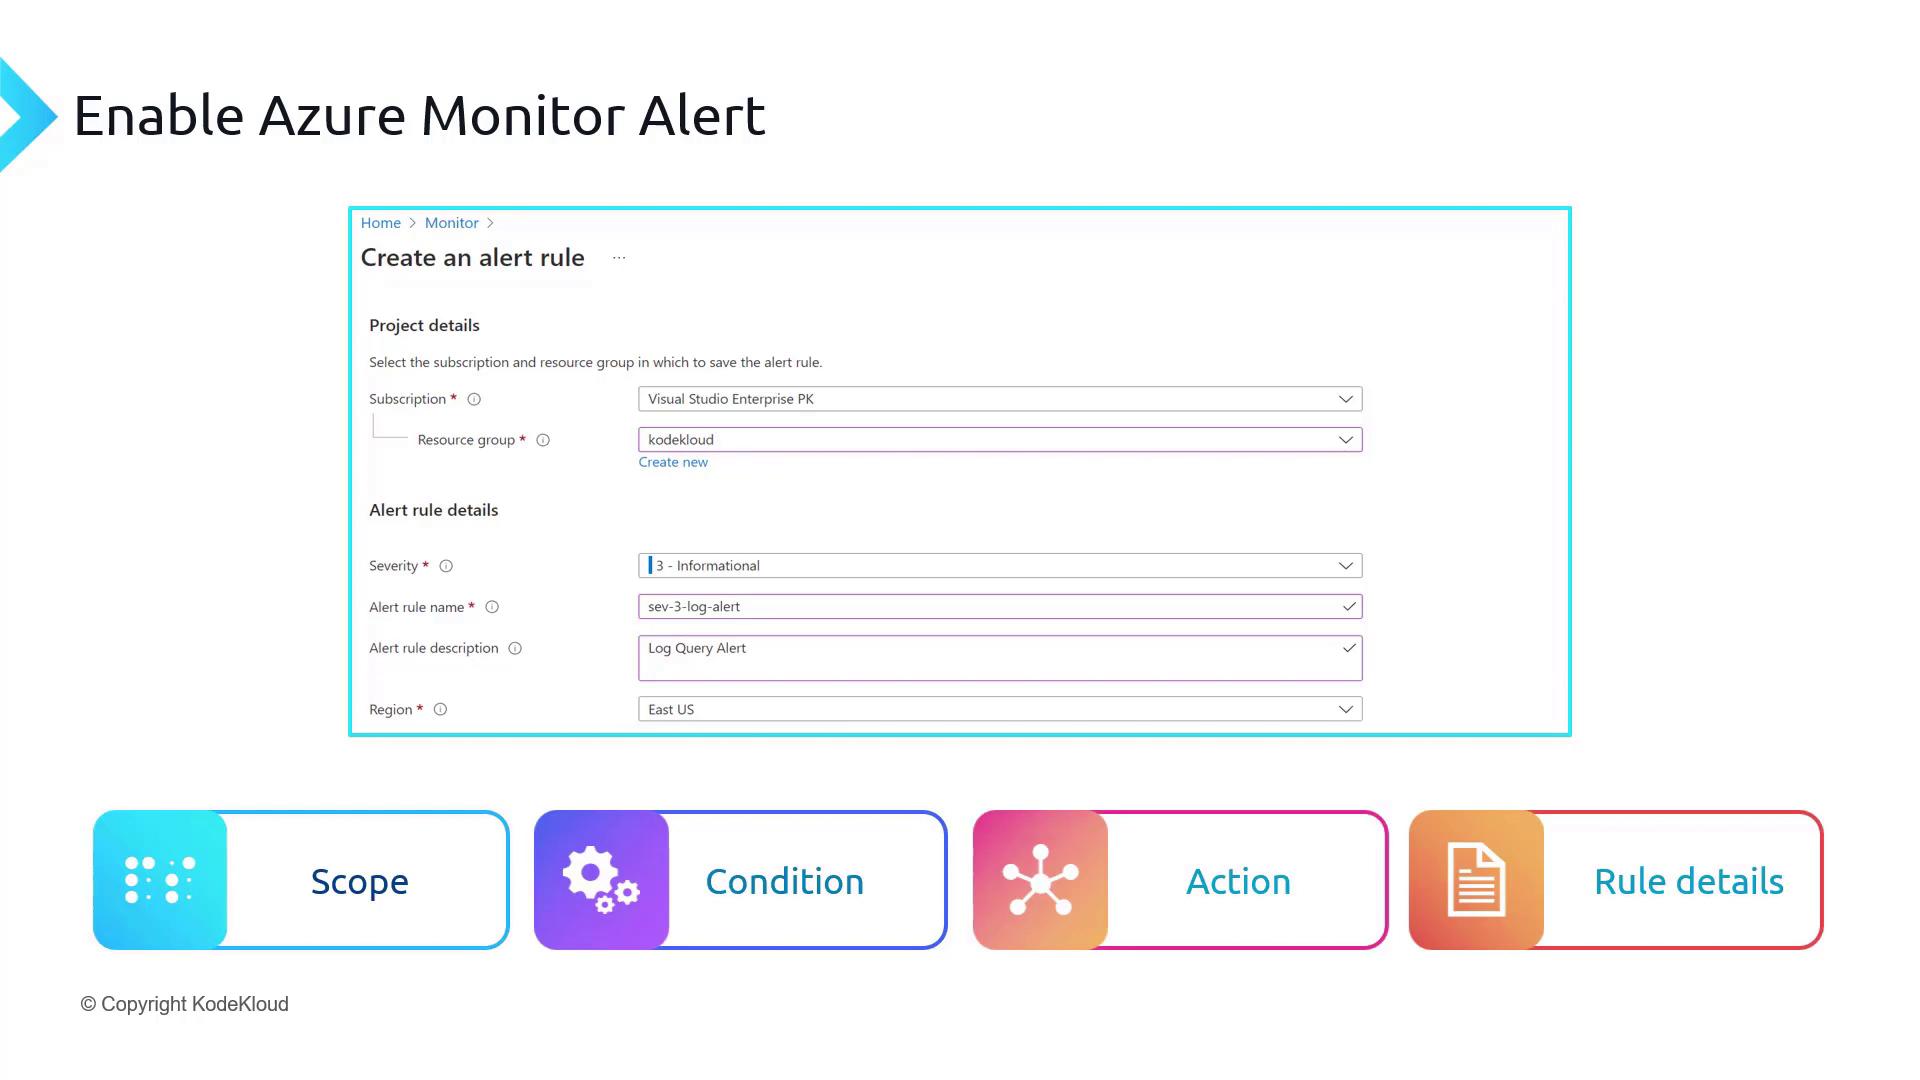
  4. Rule Details: Provide the alert rule name, description, and severity to help identify and prioritize alerts.

Below, each diagram is integrated with its relevant explanation.


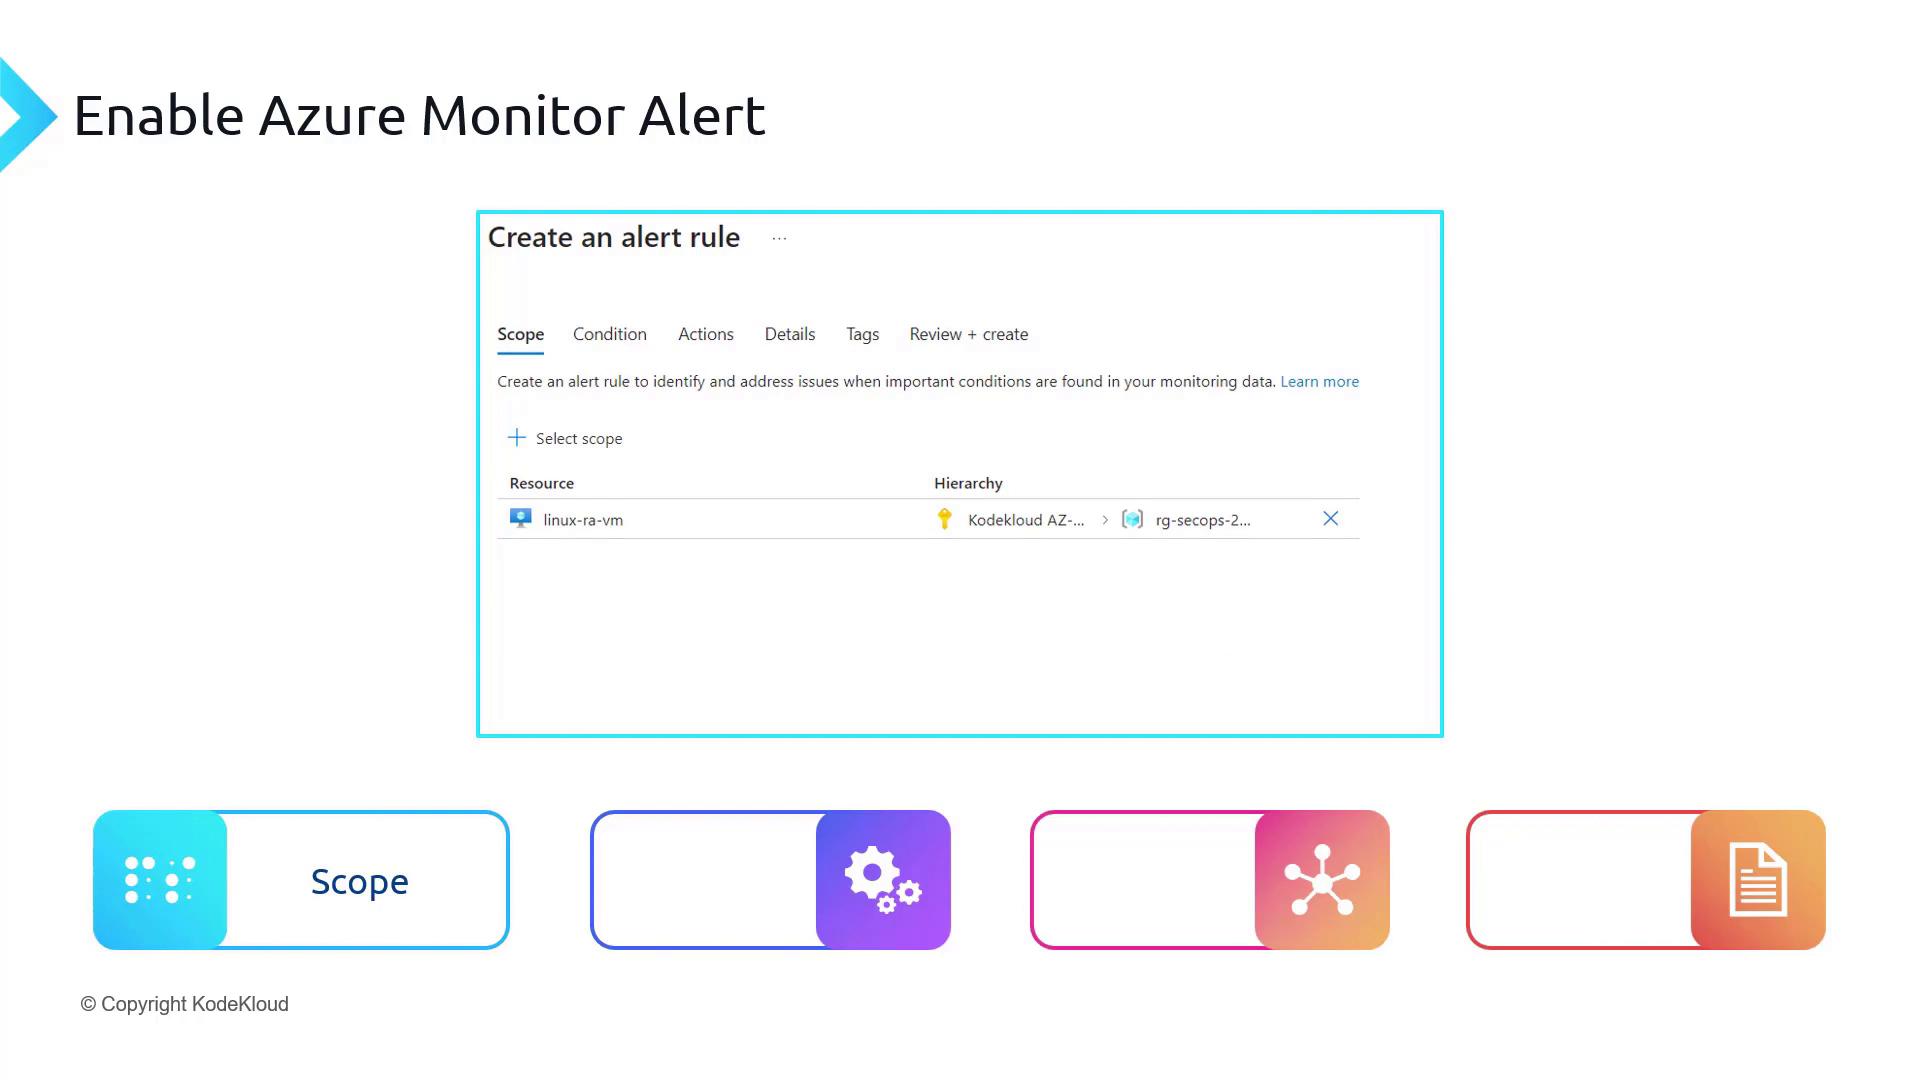
The following image illustrates how to select the resource scope for your alert. In this example, you can see the "Create an alert rule" interface in Azure Monitor with icons representing steps like Scope, Condition, Actions, and Details.

The image shows a screenshot of the "Create an alert rule" interface in Azure Monitor, focusing on setting the scope for an alert. Below are icons representing different steps in the process, such as Scope, Condition, Actions, and Details.

When setting the scope, choose the resources for which the alert should apply. For activity log or log query alerts, adjust the scope accordingly as shown in the demonstration later in this article.


Next, define the Condition. In this stage, you set up the signal (for example, Percentage CPU) and the criteria (for example, triggering the alert when CPU utilization exceeds 80%). When the measured value exceeds this threshold, the alert is activated.

The image shows a setup screen for creating an Azure Monitor alert rule, focusing on configuring conditions like signal name and threshold values. Below, there are icons labeled "Scope," "Condition," and others, indicating steps in the alert creation process.

For example, by setting CPU utilization as the signal with an 80% threshold, the alert will trigger whenever CPU usage goes over that value.


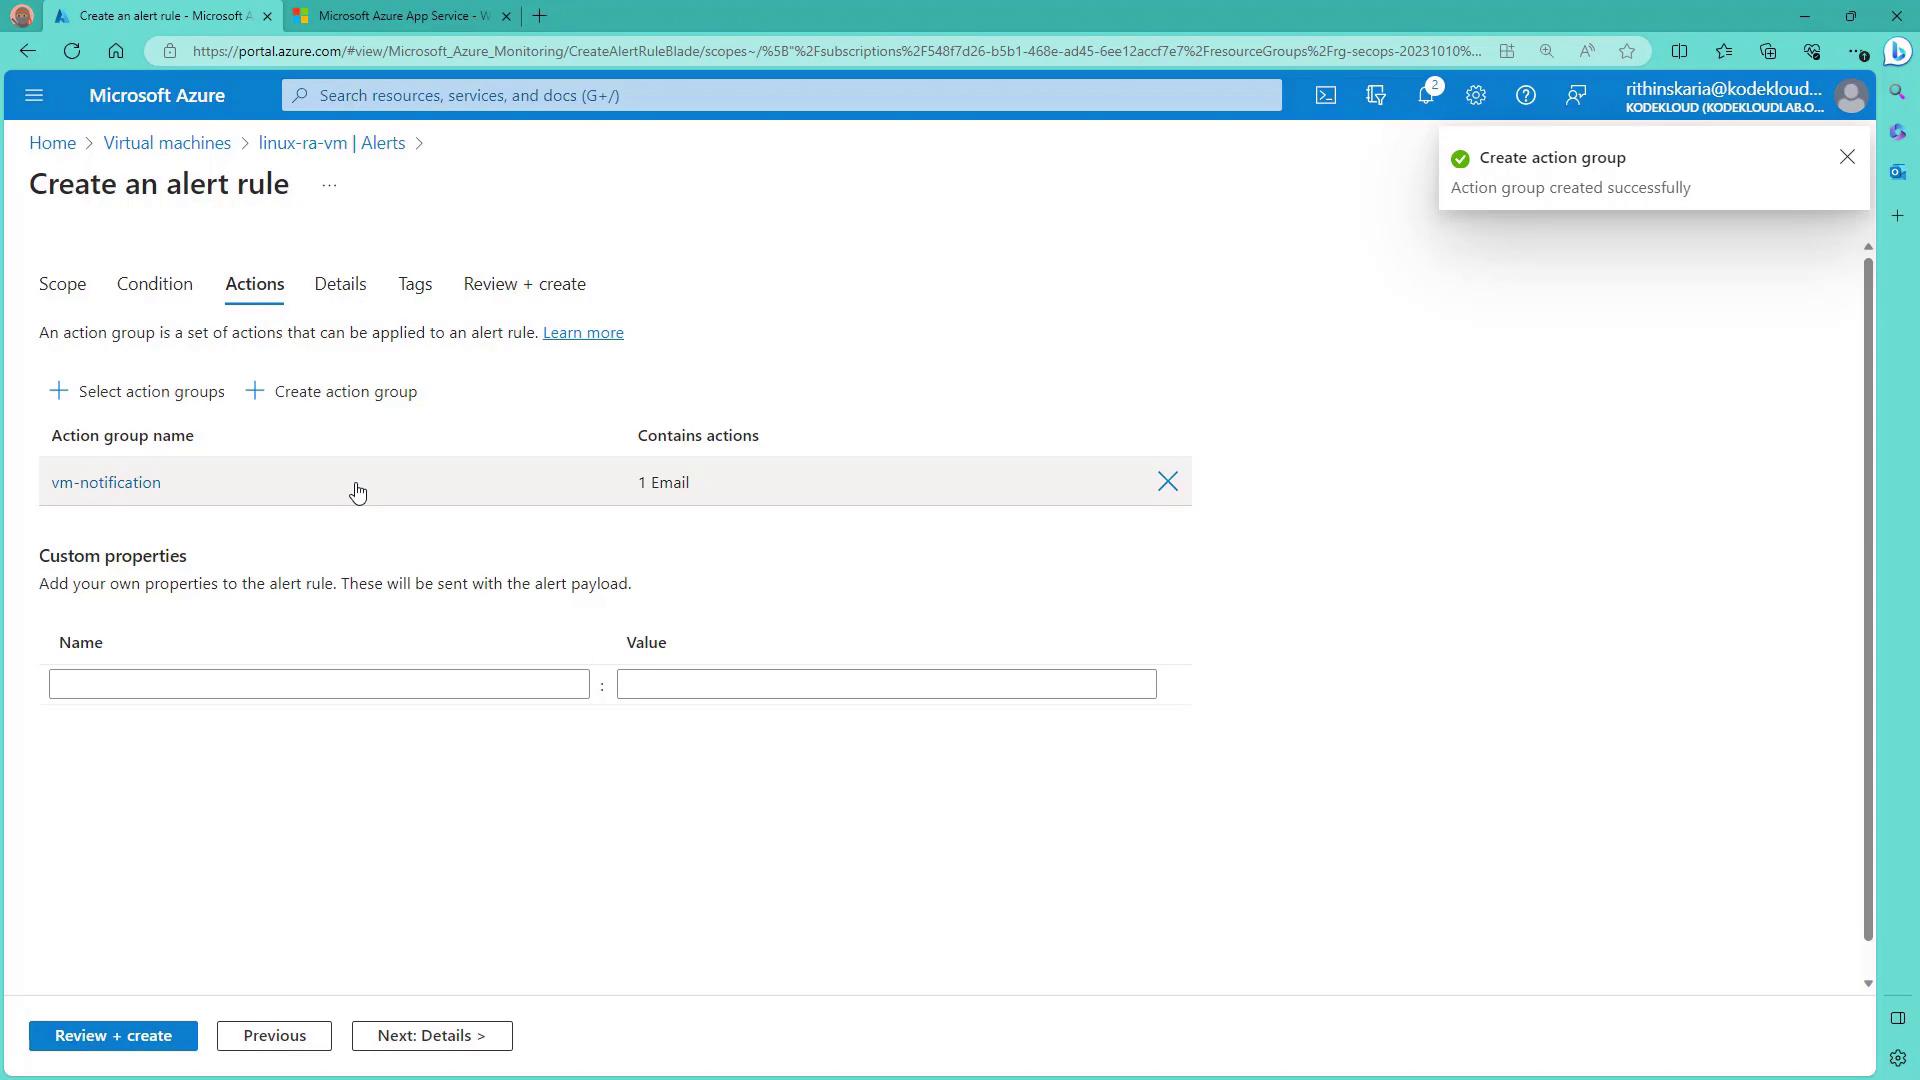
The Action stage involves assigning an action group. Action groups manage the notification and automation preferences, such as sending emails, SMS messages, or triggering an automation runbook when the alert is activated.

The image shows a screenshot of the "Create an alert rule" page in Azure Monitor, focusing on the "Actions" tab. Below the screenshot are colorful icons labeled "Scope," "Condition," "Action," and an unlabeled icon, representing the steps in the alert creation process.

Later in this guide, you will see how to create a new action group if needed.


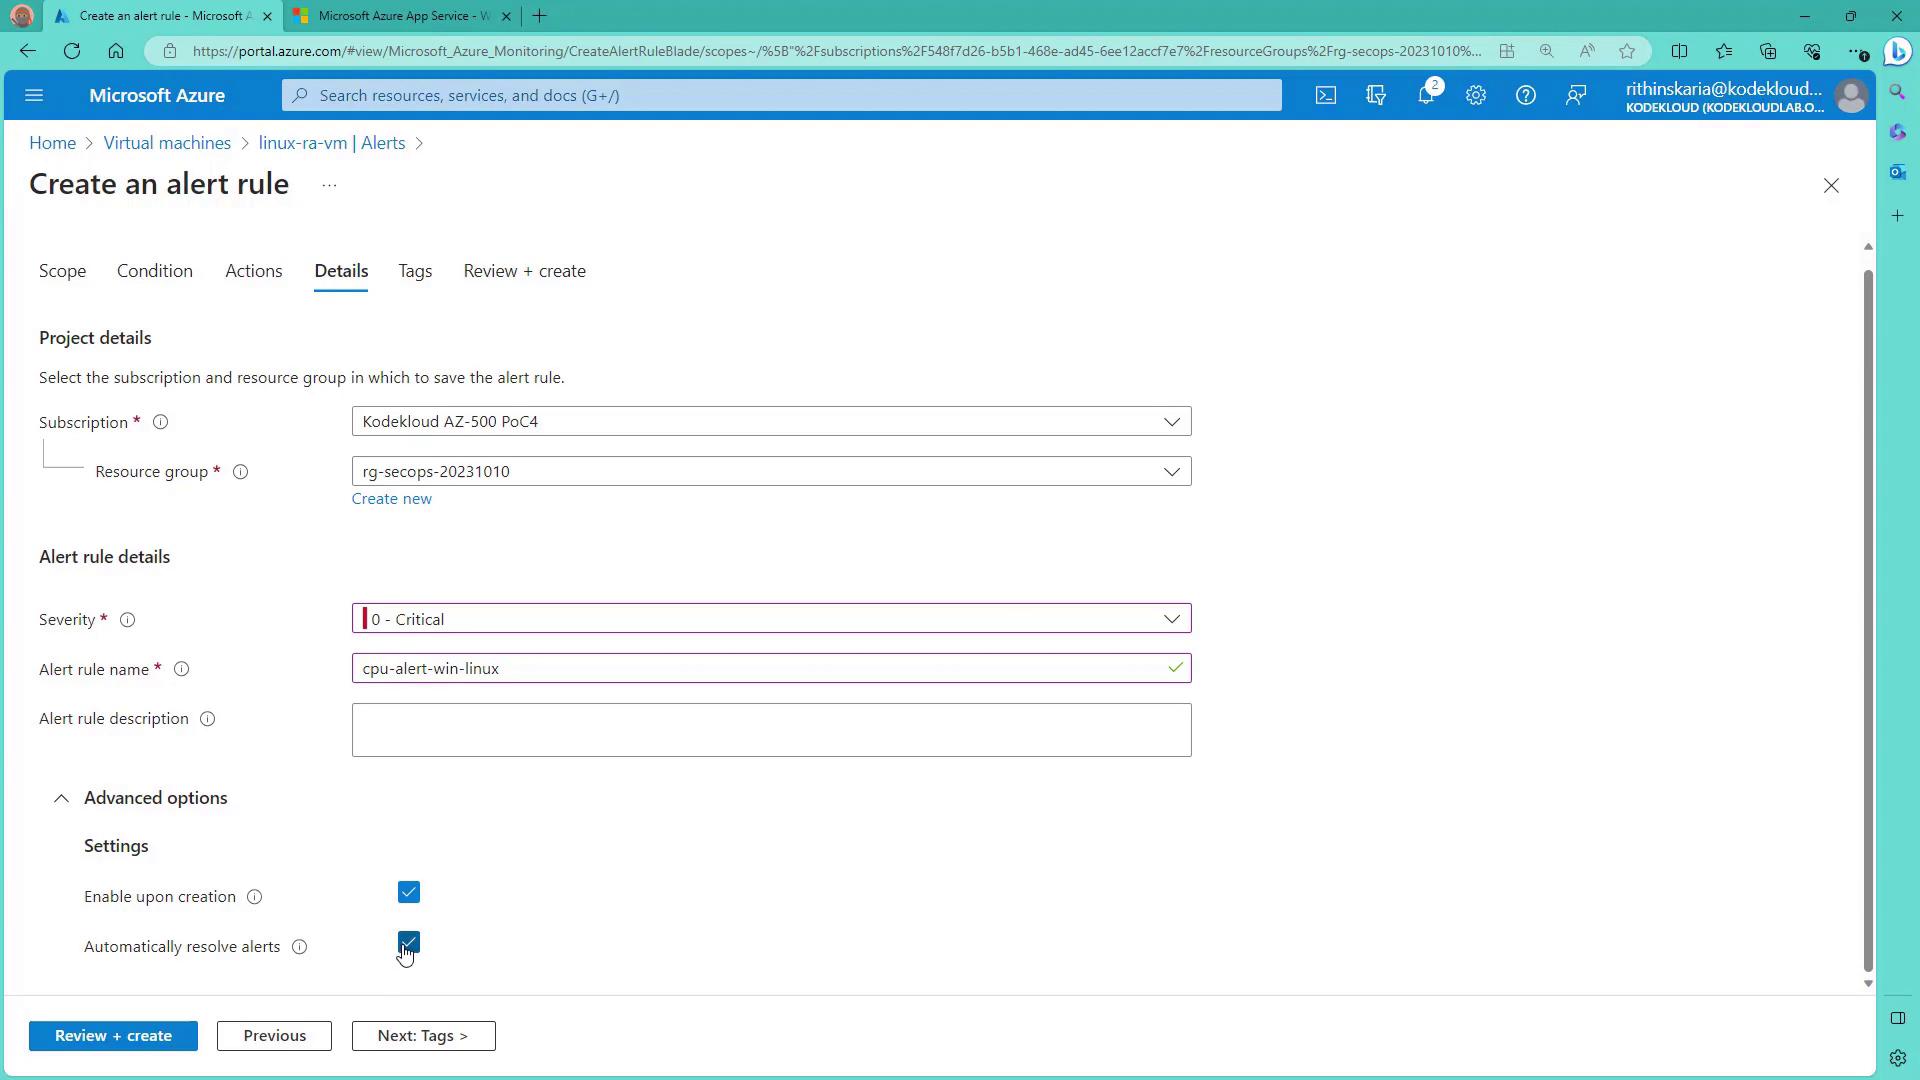
Finally, the Rule Details stage requires you to provide the alert rule name, description, and severity. This information helps you quickly identify and prioritize alerts when you receive notifications—for example, via email.

The image shows a setup screen for creating an alert rule in Azure Monitor, detailing project and alert rule specifics. Below, there are colorful icons labeled "Scope," "Condition," "Action," and "Rule details."


Action Groups: Notification and Automation Preferences

Action groups let you configure both notification options (such as emailing Azure Resource Manager roles like owner, contributor, and reader) and automation options (such as triggering an automation runbook, Azure Function, Logic App, ITSM connector, or webhook). For instance, you can specify a group email address so that multiple team members are alerted simultaneously when an alert is triggered.

In the Azure portal, select the notification and action types while creating the action group. The image below shows the action group creation interface, where you define these settings:

The image shows a Microsoft Azure portal interface for creating an action group, with fields for project and instance details, and options to proceed to notifications or review and create.


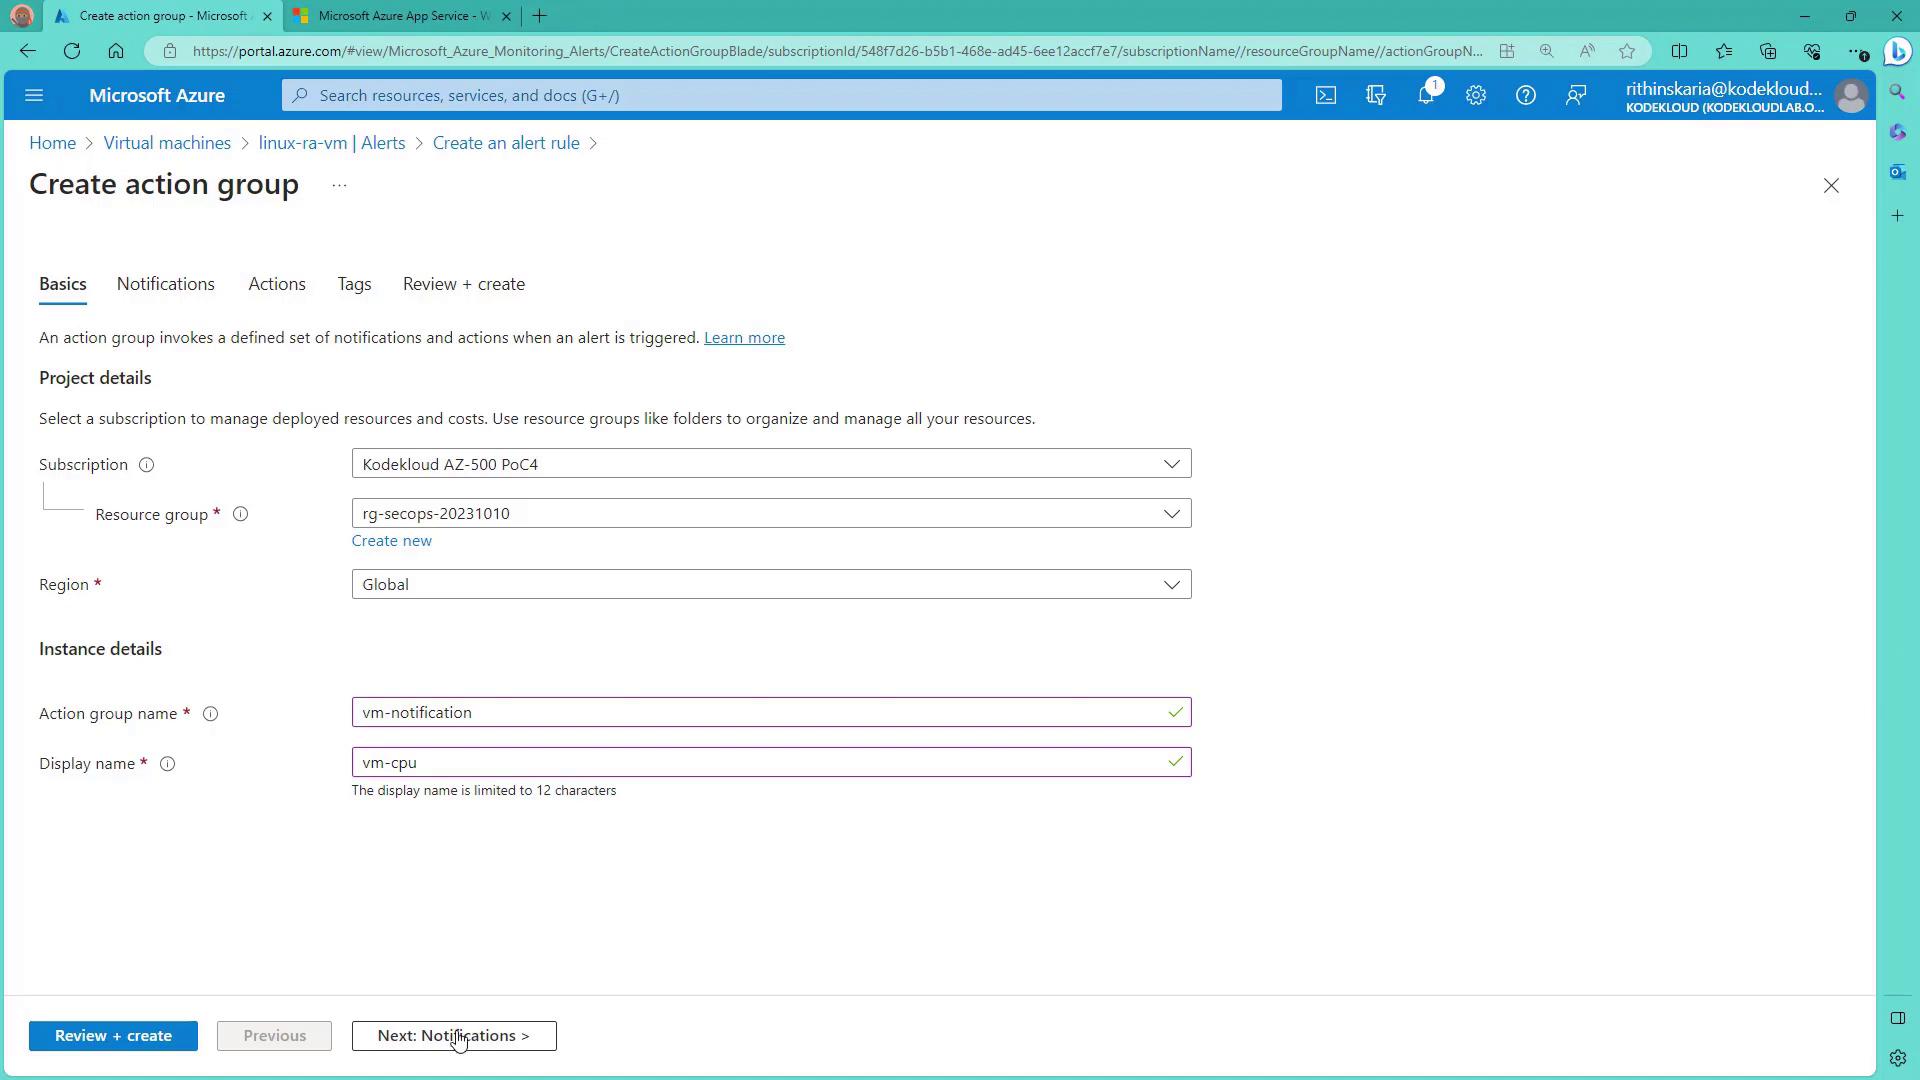
After specifying the alert rule name, severity, and advanced options (such as enabling the rule upon creation), you can review and create the alert. The following diagram confirms that your alert rule has been set up with the necessary conditions and action groups:

The image shows a Microsoft Azure interface for creating an alert rule, with fields for project details, alert rule details, and advanced options. The alert rule is set to "Critical" severity with the name "cpu-alert-win-linux."


Demonstration: Creating an Alert for Log Analytics
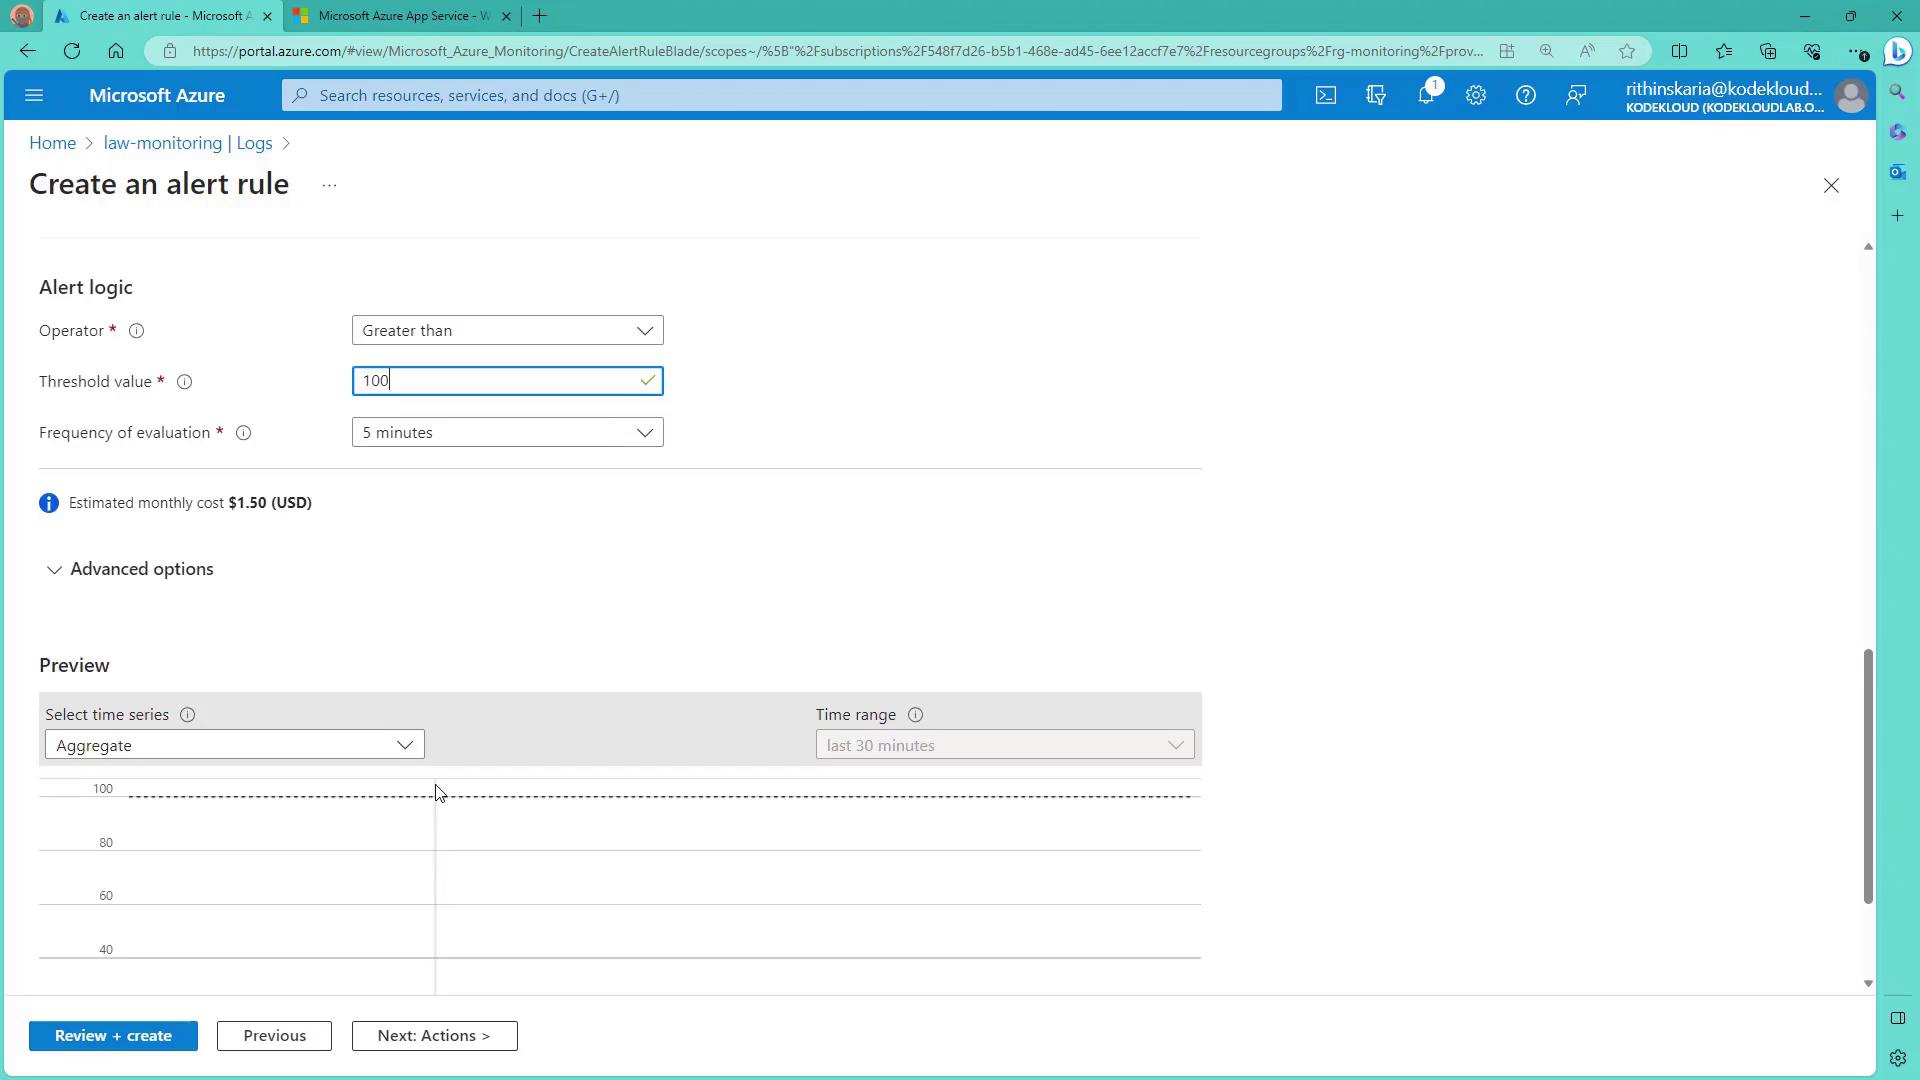
Let's move from theory to practice. In this demonstration, you'll learn how to create an alert for a Log Analytics workspace. Suppose you want to monitor App Service HTTP logs to see if the number of requests reaches a specific threshold within 25 minutes. You can begin by running a query on your Log Analytics workspace:

// Kusto Query Language example to filter AppService HTTP logs based on the time generated
AppServiceHTTPLogs
| where TimeGenerated > ago(25m)
| count

If this query returns a count of 51, you can set up an alert rule so that if the count reaches 100 requests over 25 minutes, a notification is sent. The image below illustrates how to set measurement parameters, aggregation settings, and the threshold:

The image shows a Microsoft Azure interface for creating an alert rule, with options for measurement, aggregation, and dimensions. The user is setting parameters such as measure type, aggregation type, and granularity.

A second view of the alert configuration is shown here:

The image shows a Microsoft Azure interface for creating an alert rule, with options to set alert logic, threshold value, and frequency of evaluation. A preview section displays a graph with a threshold line at 100.

Similarly, you can create alerts from activity logs. For instance, you might set up an alert to notify you about any virtual machine creation or update operations by selecting the relevant actions and creating a new alert rule accordingly.


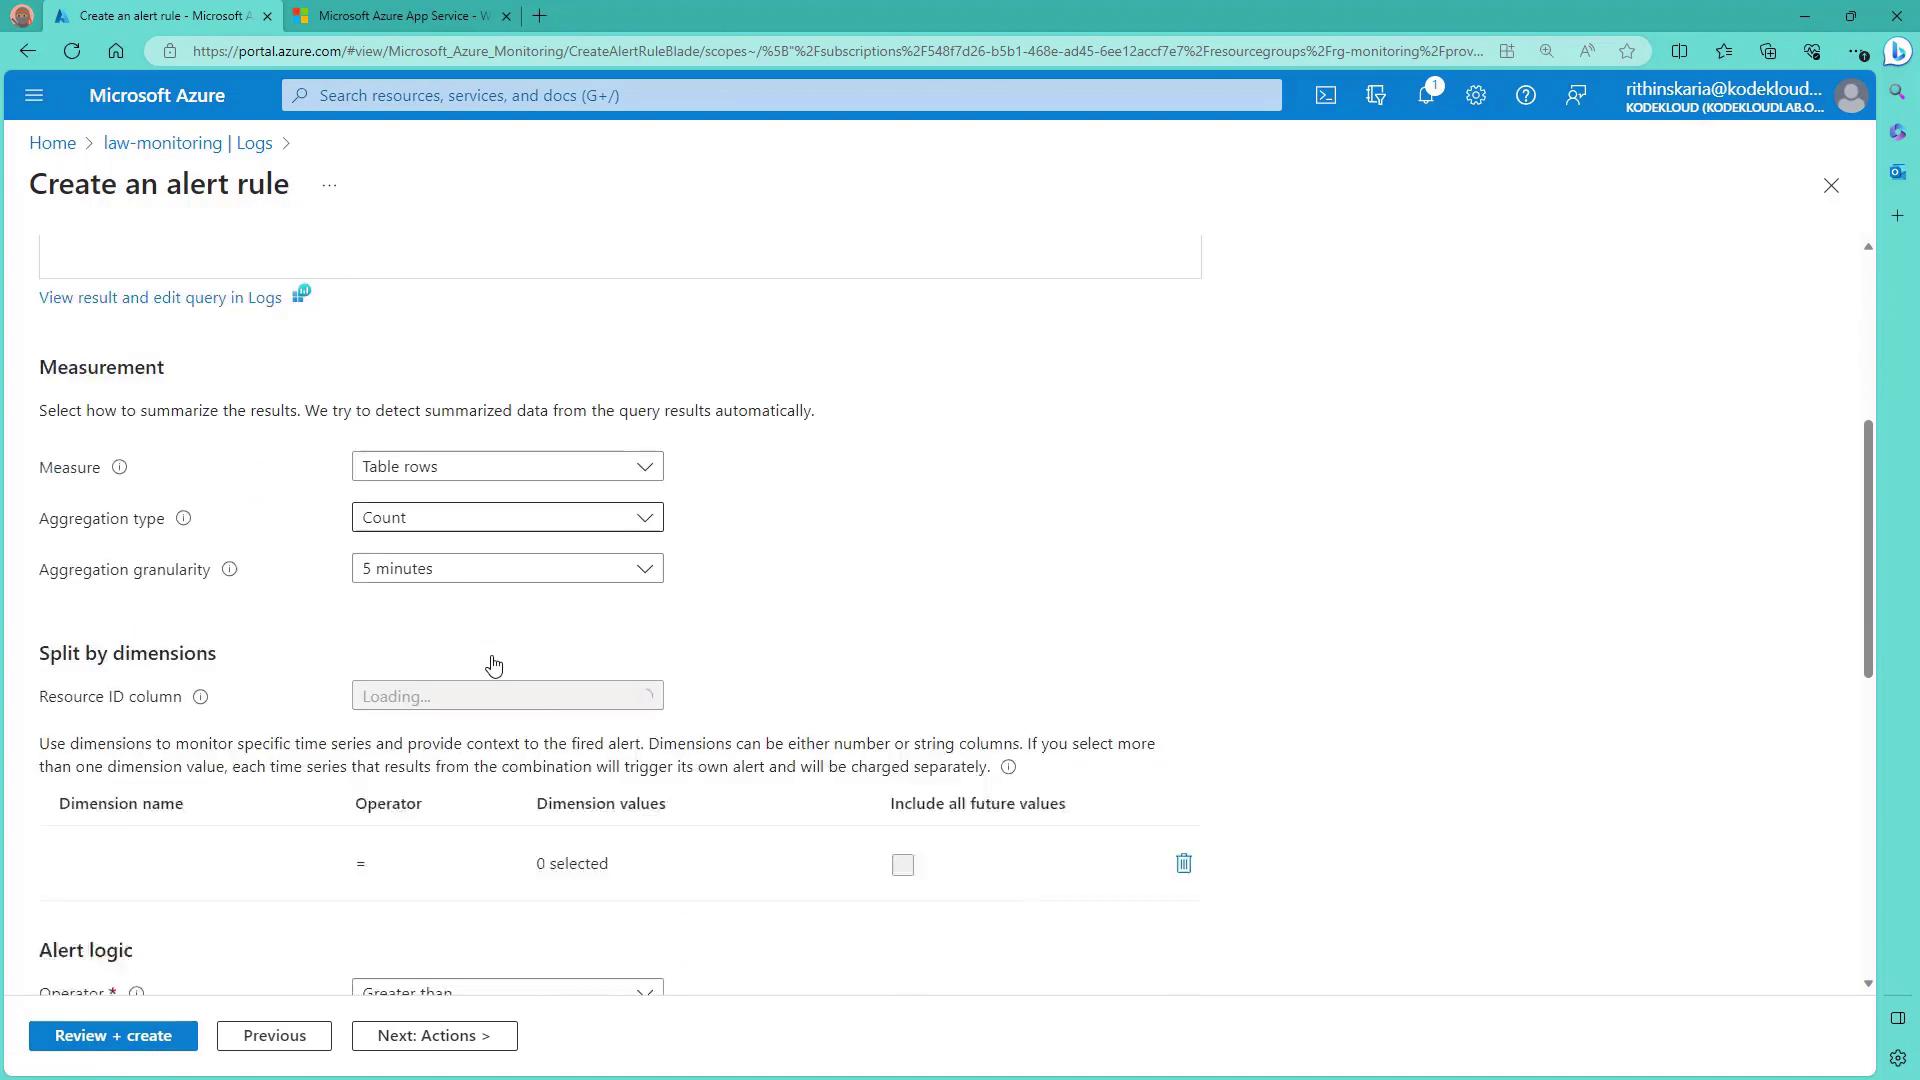
Demonstration: Setting Up an Alert for a Virtual Machine

For critical production servers such as virtual machines, it is essential to receive an alert when CPU usage exceeds a specific threshold. In this demonstration, you will learn how to create an alert for both Linux and Windows VMs:

  1. Navigate to the Virtual Machines section in the Azure portal and select a Linux machine.

  2. Click on the Alerts blade and choose "Create a custom alert rule." The resource is auto-selected; if you want to include additional machines (such as a Windows machine), add them to the scope.

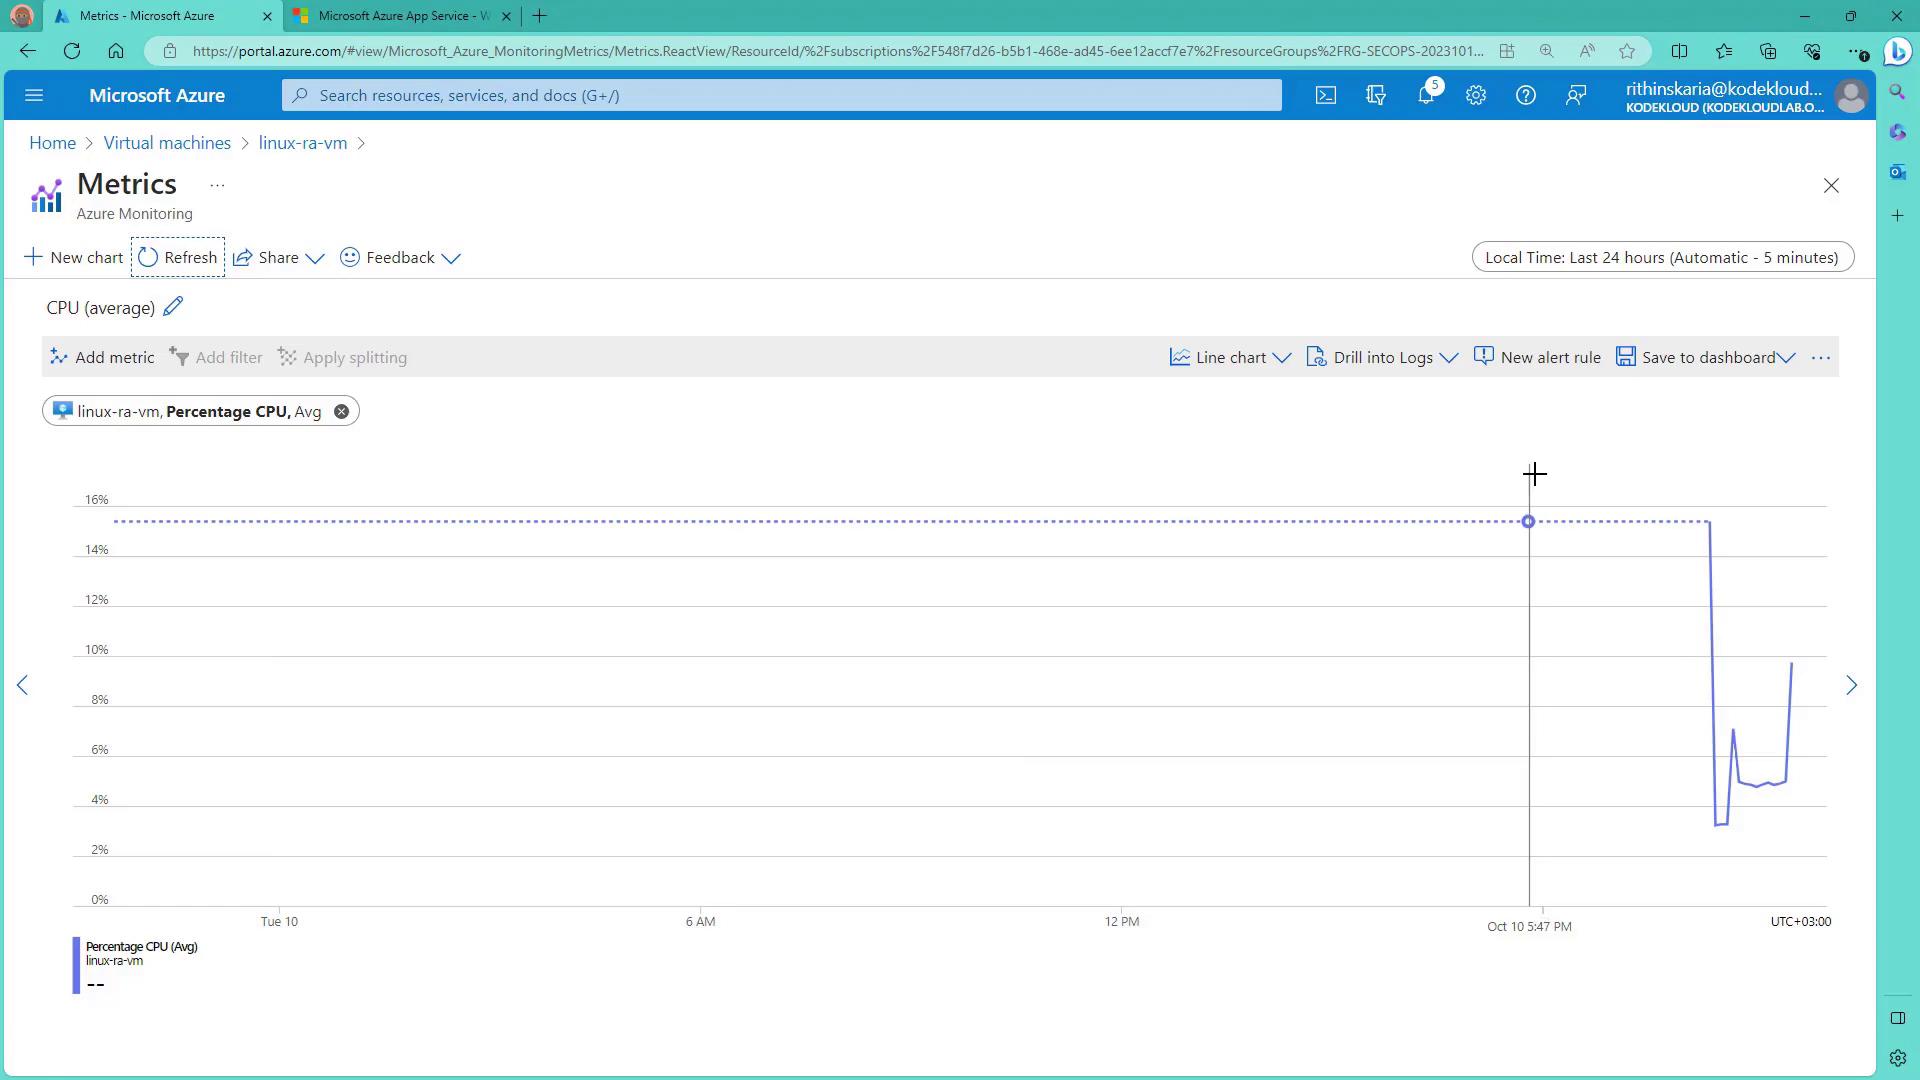
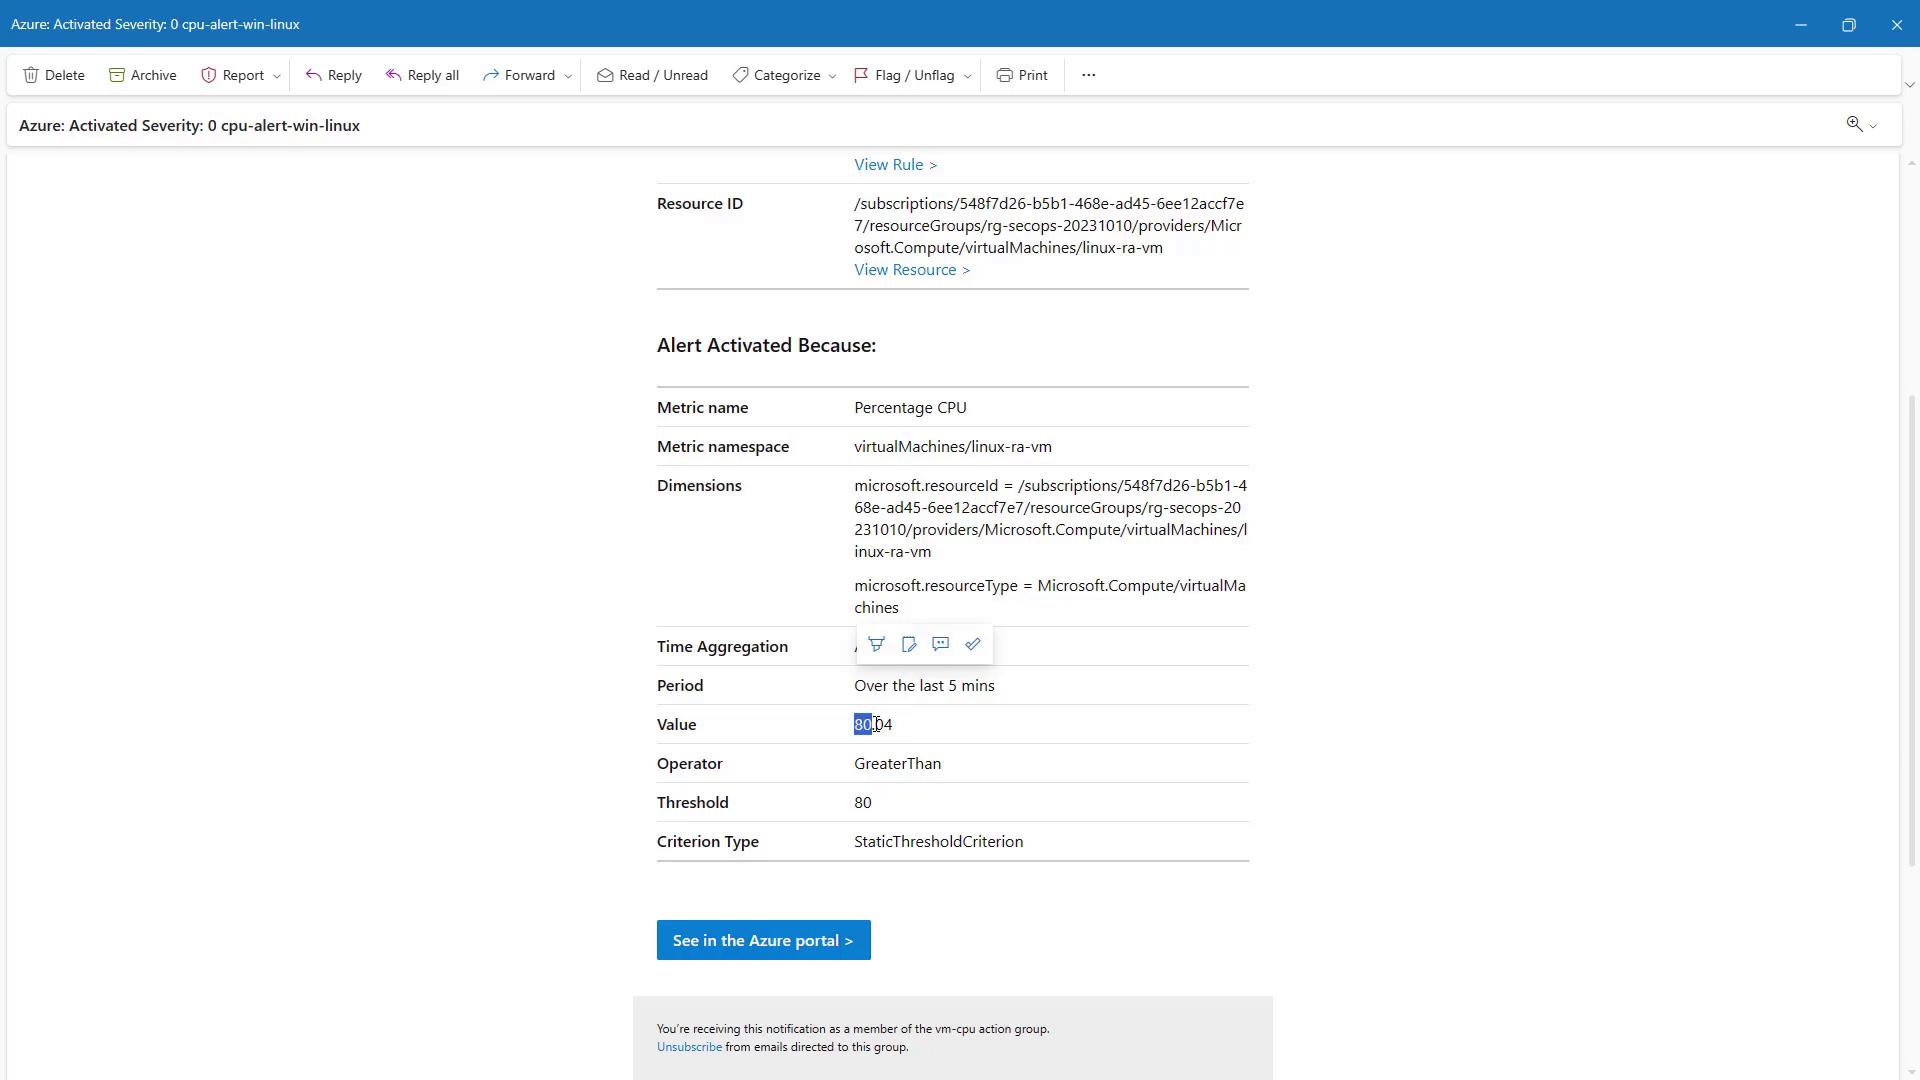
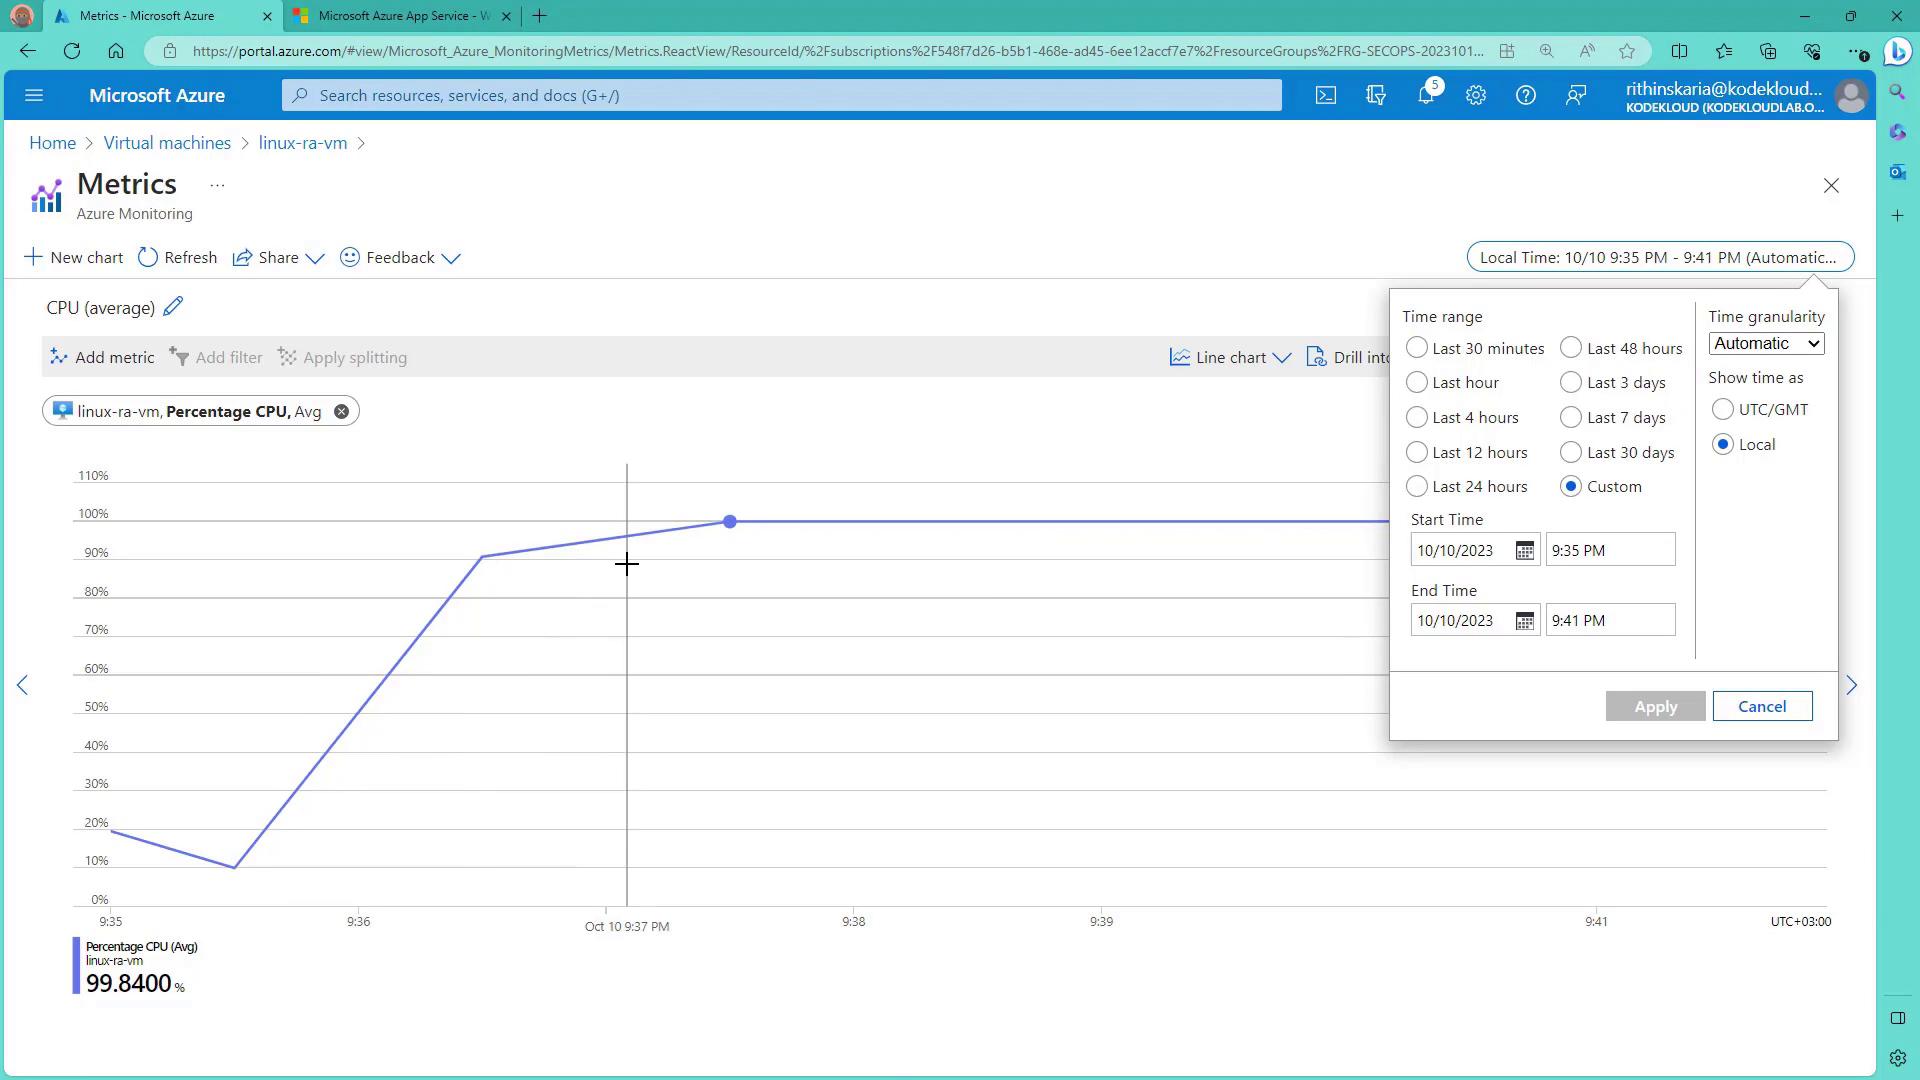
  3. In the Condition stage for the VM, select a signal such as Percentage CPU. In this demonstration, a static threshold is used with the average calculated over the last five minutes. For example, the alert fires if the average CPU usage exceeds 80% during that interval.

    The image shows a Microsoft Azure interface for creating an alert rule based on CPU percentage usage, with options to set conditions, thresholds, and preview the alert logic.

    Note

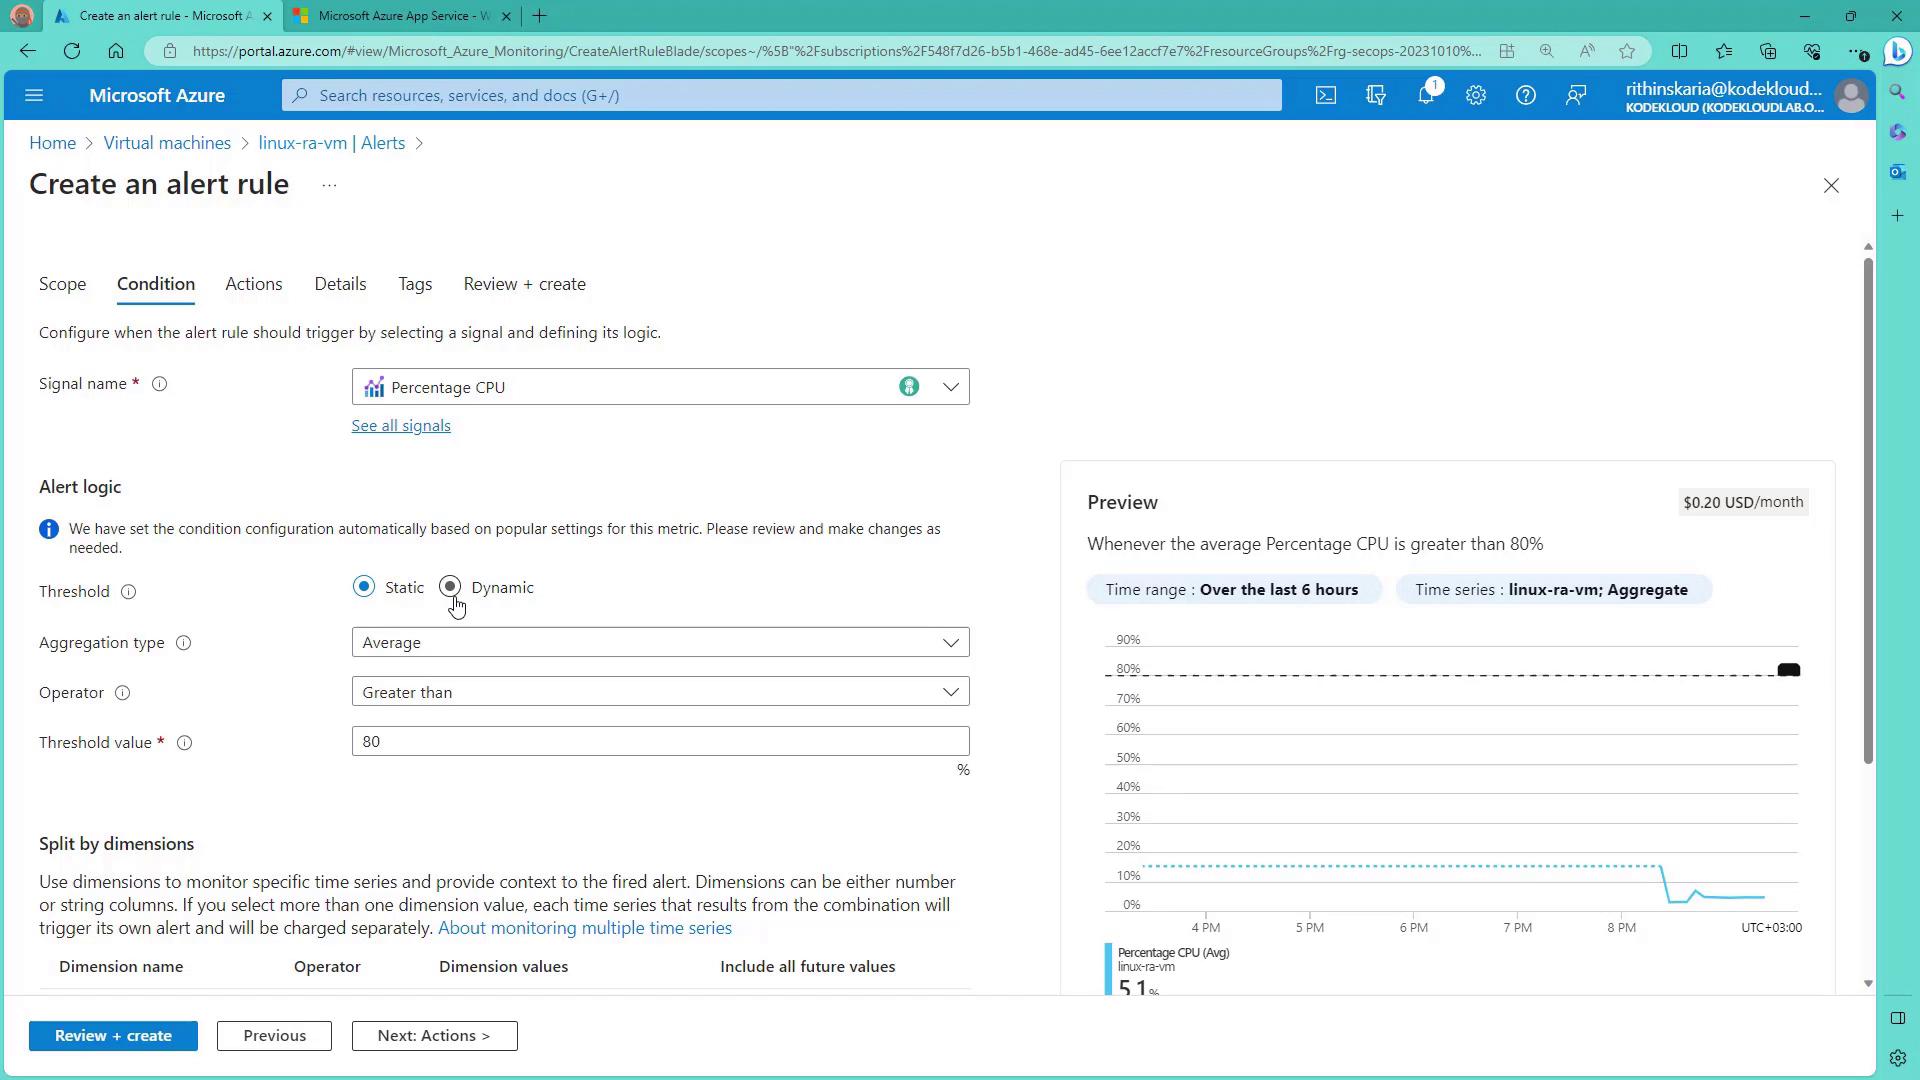
    Azure also offers dynamic thresholds that adapt based on historical usage patterns, which can help reduce noise in alerting.

  4. In the Action stage, create an action group. For example, name the action group "VM CPU" and configure a notification preference, such as an email alert. Once the action group is set up, it is automatically associated with the alert rule.

    The image shows a Microsoft Azure portal screen for creating an alert rule, specifically on the "Actions" tab, where an action group named "vm-notification" containing an email action is listed. A notification confirms the successful creation of an action group.

  5. In the Rule Details stage, set the alert rule name (for example, "CPU Alert for Linux VM"), define its severity (such as Critical), and decide whether the rule should be enabled immediately upon creation.

  6. Review the configuration and click "Create." The alert takes a few moments to deploy.

While the alert rule is being created, the next part of the demonstration involves using a stress tool on the Linux VM to artificially elevate CPU usage and trigger the alert.


Stress Testing the VM to Trigger the Alert

To simulate high CPU usage on your Linux VM, SSH into the machine and install a stress testing tool if it’s not already installed. Follow these steps:

# SSH into the Linux VM (from your local machine)
ssh [email protected]

# Install the stress tool (if not already installed)
sudo apt install stress -y

After installation, launch a CPU stress test. For example, to stress 4 CPU cores for 1000 seconds, run:

# Switch to root if necessary
sudo -s

# Run the stress test
stress -c 4 -t 1000

You will see the CPU usage spike in real time on the monitoring dashboard. The next step is to monitor this spike until the five-minute average CPU usage exceeds 80%, which will trigger the alert rule.

The image shows a Microsoft Azure monitoring dashboard displaying a line chart of CPU usage percentage for a virtual machine named "linux-ra-vm." The chart indicates fluctuations in CPU usage over a specified time period.

Once the average CPU usage exceeds the threshold, you receive an email notification. For example, you might see an alert message indicating that the CPU usage is above 80%:

The image shows an Azure alert notification for a virtual machine, indicating that the CPU percentage exceeded a threshold of 80%. The alert details include resource ID, metric name, and time aggregation.

Additionally, verify the alert by checking the Virtual Machine’s activity logs or the Alerts section in the Azure portal:

The image shows a Microsoft Azure monitoring dashboard displaying a line chart of CPU usage for a virtual machine, with the CPU percentage reaching approximately 99.84%. A time range selection menu is open on the right side.


Managing and Closing Alerts

After an alert is triggered, you can manage it through the Azure portal. In the Alerts blade, update the user response status (for example, marking it as acknowledged if the team is investigating) or close the alert once the issue is resolved. You can also stop the stress test on the VM to allow the CPU usage to return to normal levels.

For example, to safely end the stress test, you might run the following command to stress the system briefly before the load drops:

sudo stress --cpu 8 --io 4 --vm 2 --vm-bytes 128M --timeout 10s

This command runs the stress test for a short duration and then terminates it, letting the VM cool down. If the alert does not close automatically, you can manually close it in the Azure portal.


Conclusion

This article demonstrated how to configure Azure Monitor Alerts for various scenarios, from Log Analytics to Virtual Machines. By defining the scope, condition, action group, and rule details, you can effectively monitor your resources, receive timely notifications, and automate responses. This setup is critical to maintaining a reliable and responsive environment, especially for production systems.

Another important topic is configuring diagnostic logging properties to further enhance your ability to monitor and troubleshoot your Azure resources.

Happy monitoring!

Watch Video

Watch video content

Previous
Manage connected sources for log analytics