Microsoft Azure Security Technologies (AZ-500)
Azure Monitor
Configure properties for diagnostic logging
Configure diagnostic logging properties to set up a comprehensive monitoring strategy in Azure. This article explores the various levels at which you can collect metrics and logs, ensuring thorough security, auditing, and performance monitoring across your Azure environment.
Azure monitoring collects data from multiple layers, including applications, operating systems, resources, subscriptions, tenants, and custom sources.
Application Level
At the application level, Azure offers Application Insights for monitoring and diagnostics. With Application Insights you can:
- Instrument your application using a dedicated package.
- Run availability tests.
- Store the collected data in Azure Log Analytics.
These capabilities help track performance issues, monitor failures, and identify potential vulnerabilities.
Tip
Utilize Application Insights to gain real-time insights into your application's behavior and performance.
Operating System Level
To collect data from the operating system, follow these steps:
- Install the Azure Monitor Agent.
- Use the diagnostics extension to gather guest OS metrics.
This approach provides comprehensive insights into your operating system's performance, enabling proactive system health management.
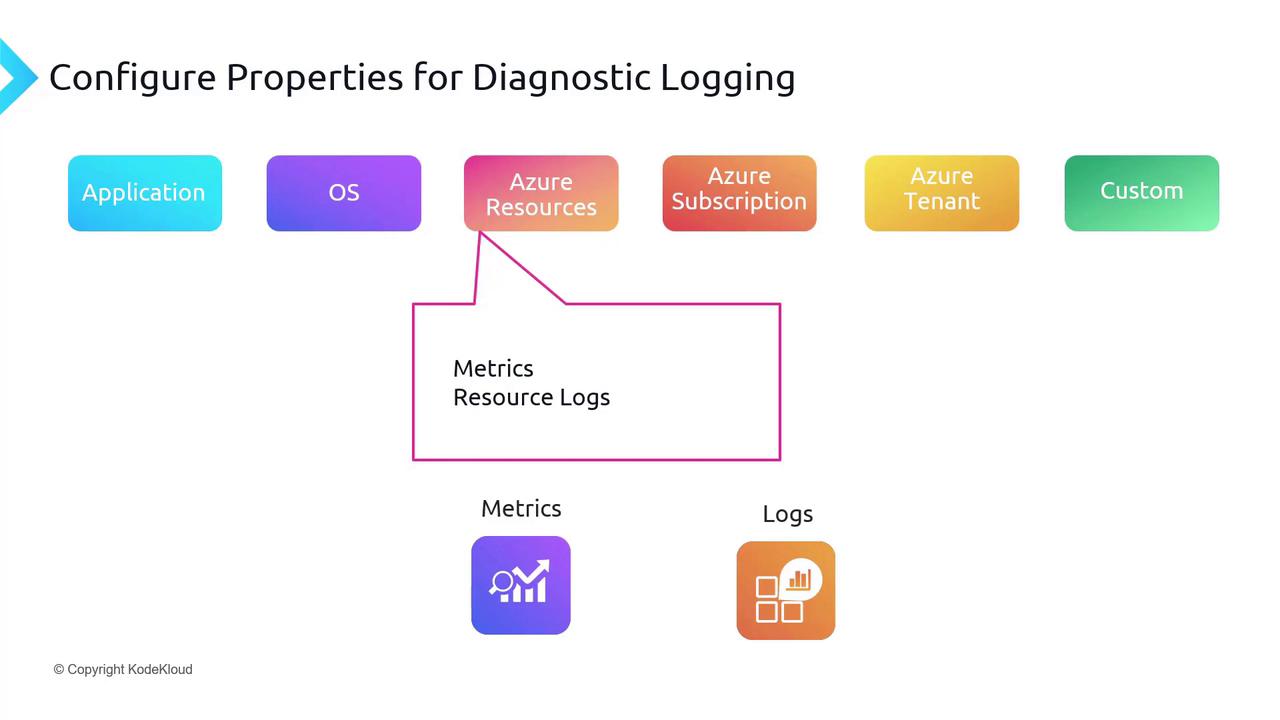
Azure Resources
Azure resources come with built-in metrics and resource logs:
- Metrics: Available by default without additional configuration.
- Resource Logs: Require configuration of diagnostic settings. For example, virtual machines use an agent for this configuration, while other resources require manual configuration.
After enabling resource logs, choose the data to collect and select from multiple destinations such as a storage account, event hub, third-party solutions, or Azure Log Analytics.
Azure Subscription
Azure subscriptions offer valuable service health insights, allowing you to monitor the status of various services. For example, you can verify whether the virtual machine service is available or check for issues with your database service. You can also configure alerts to notify you of any changes in service health.
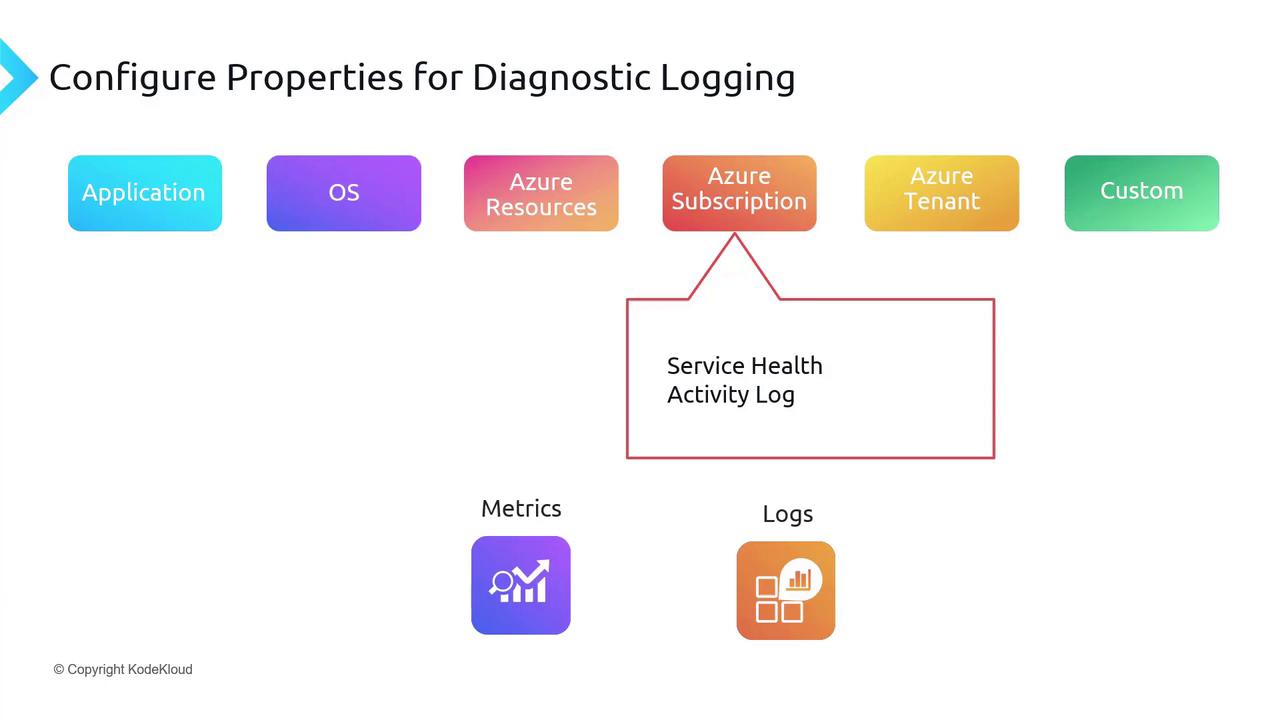
Furthermore, activity logs capture all operations performed in the Azure portal, including PUT and POST calls made through ARM. These logs are essential for auditing and operational tracking.
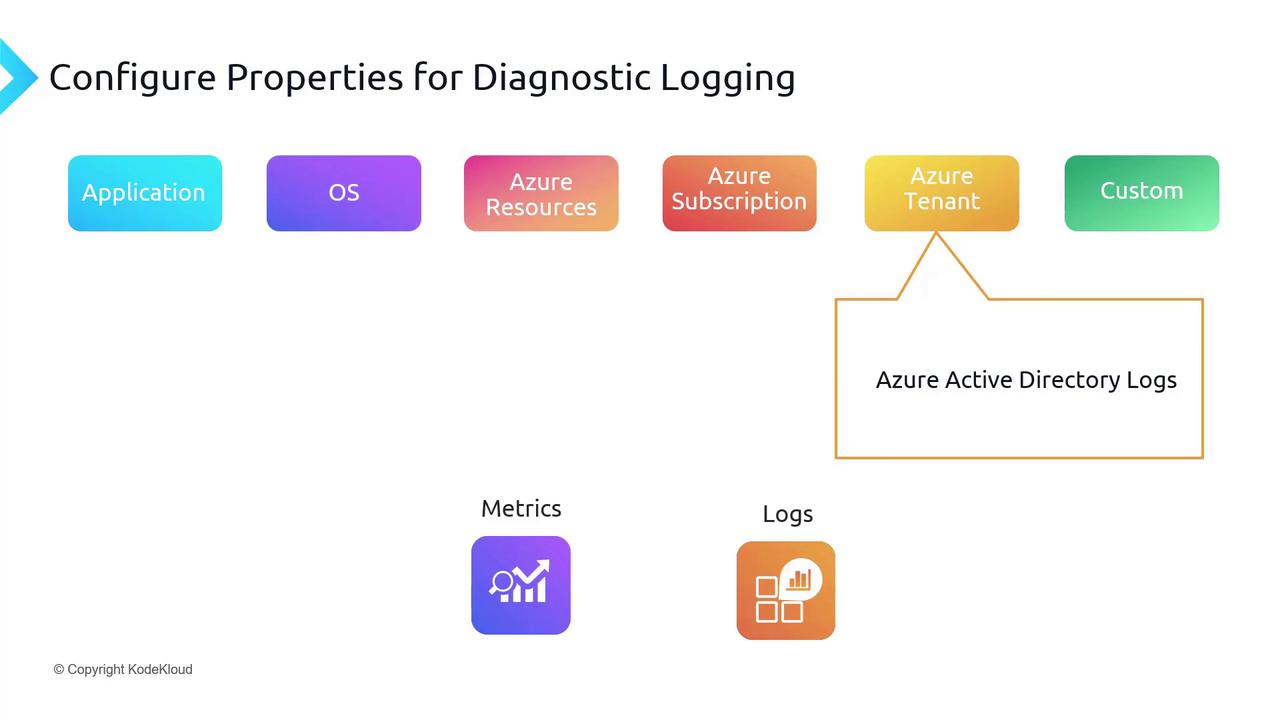
Azure Tenant
At the tenant level, you have access to various Azure activity logs such as:
- Sign-in logs
- Audit logs
- Device registration logs
These logs play a crucial role in security by providing detailed information about user sign-ins and help troubleshoot issues like conditional access. When integrated with Azure Log Analytics, they enable deeper analysis for identity management and auditing purposes.
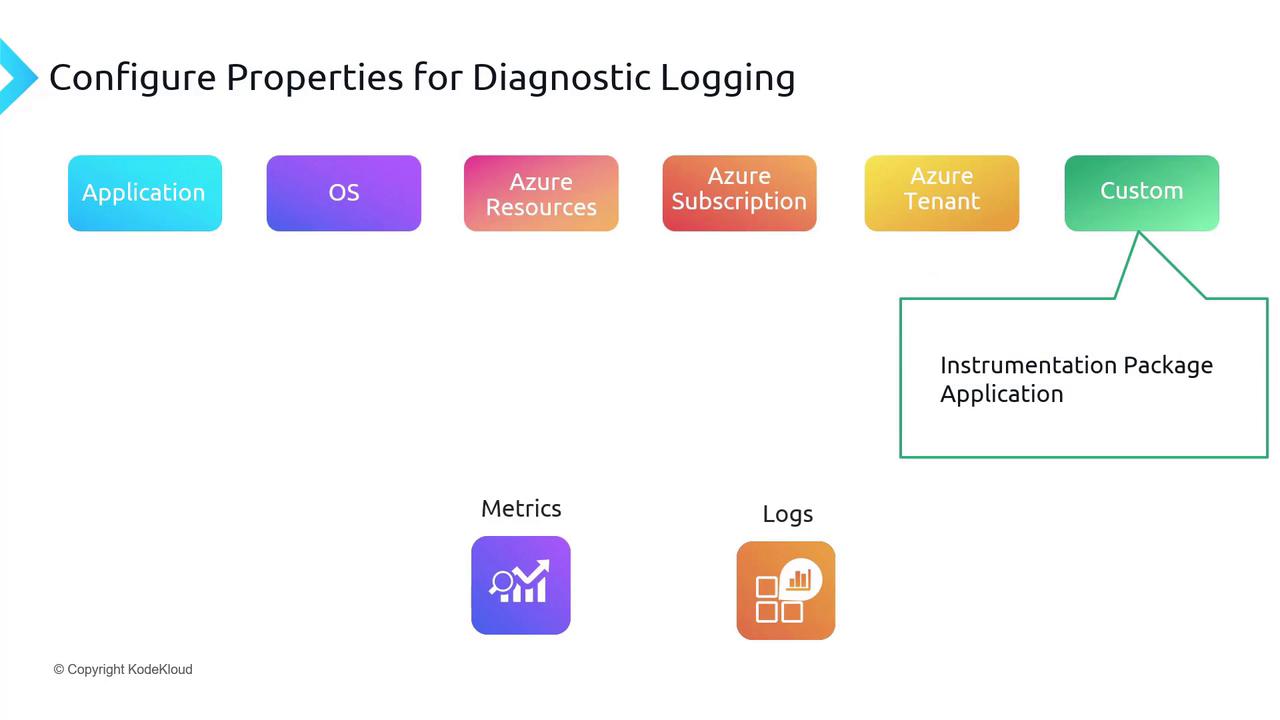
Custom Log Sources
For data that does not fit within the standard categories, custom logging solutions are available through:
- Instrumentation packages
- Custom applications
These options allow you to collect logs from a wide range of non-standard sources, ensuring that no critical data goes unmonitored.
Additionally, Azure Arc extends monitoring capabilities to on-premises and multi-cloud environments. With Azure Arc, you can:
- Connect non-Azure devices.
- Manage these devices directly from Azure.
- Install extensions like the Azure Monitor Agent, guest configuration, or custom scripts.
This unified management approach simplifies the monitoring of both Azure-based and non-Azure-based machines.
Conclusion
In summary, configuring diagnostic logging properties across different levels in Azure enables a robust and secure monitoring framework. The key components include:
- Application Level: Utilize Application Insights for performance tracking and failure analysis.
- Operating System Level: Deploy the Azure Monitor Agent and diagnostics extension for in-depth OS metrics.
- Azure Resources: Leverage built-in metrics and configure resource logs to suit your data collection needs.
- Azure Subscription: Monitor service health and review activity logs for operational oversight.
- Azure Tenant: Access comprehensive identity and security logs to enhance your auditing capabilities.
- Custom Log Sources: Integrate custom logging and Azure Arc for monitoring across diverse environments.
These strategies, complemented by Microsoft Defender for Cloud, ensure that your Azure environment remains secure, compliant, and well-monitored.
Final Thought
By implementing a multi-layered diagnostic logging strategy, you can achieve comprehensive monitoring and proactive management of your Azure infrastructure.
Watch Video
Watch video content