This article demonstrates enabling rules in Microsoft Sentinel to automatically create incidents from alerts, enhancing security response and resource allocation.
This article demonstrates how to enable rules in Microsoft Sentinel to automatically create incidents. By leveraging rule-based alerts, you can eliminate the need to manually investigate numerous alerts, helping you enhance your security posture, respond more swiftly, and allocate resources more effectively.After gathering data and visualizing it through workbooks, you can now turn the tide in your favor by converting defined events into actionable incidents using Microsoft Sentinel’s rule automation.
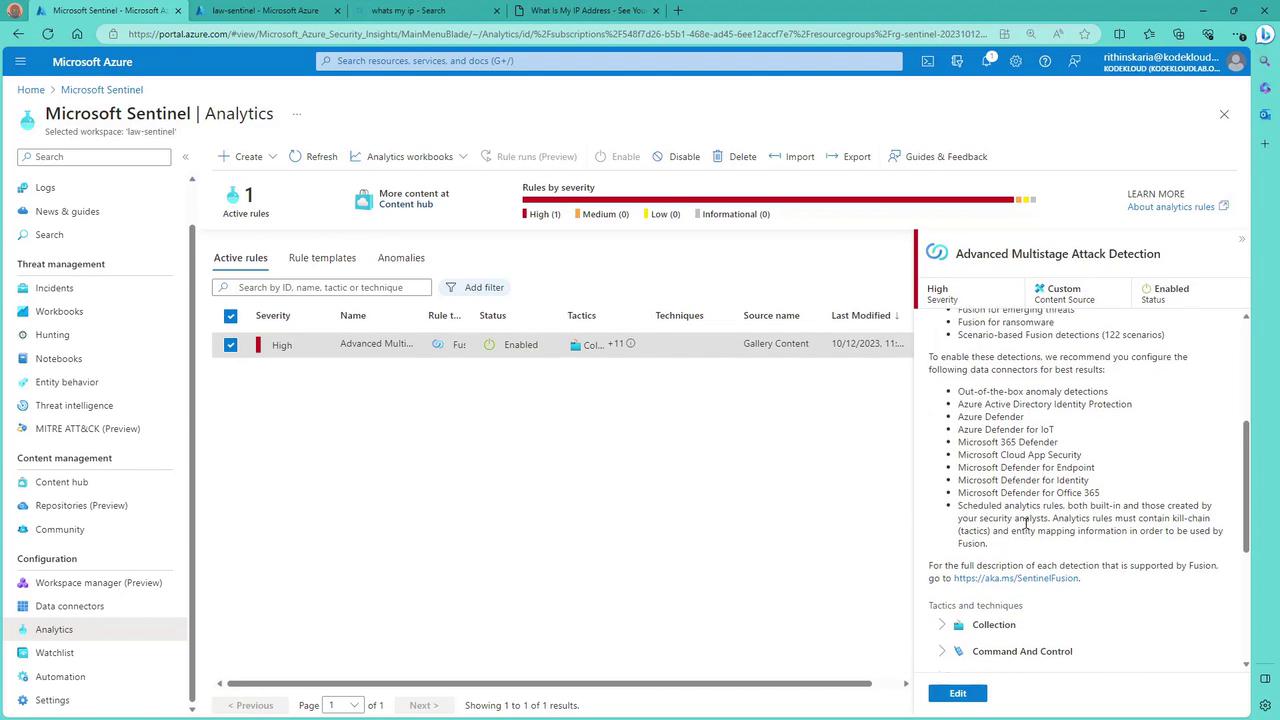
To get started, log in to the Azure portal and open Microsoft Sentinel. Next, navigate to Analytics where you can either create your own scheduled queries or select from the rule templates provided by Sentinel. By default, Microsoft Sentinel includes an enabled rule called “Advanced Multistage Attack Detection.” This rule is specifically designed to analyze multiple events sourced from your connected systems.
For this exercise, we will explore a different scenario that focuses on Windows security events.
Creating a Custom Rule for Windows Security Events
In this section, you will create a rule specifically tailored to detect excessive Windows login failures. Follow these steps:
Select the relevant rule template for Windows security events.
Filter for indicators related to excessive Windows login failures.
Click Create Rule to enter the rule configuration.
Within the rule configuration, you will see a default Kusto query that defines the alert logic. Initially, a basic version of this query may appear as follows:
Copy
let starttime = 8d;let endtime = 1d;let threshold = 0.333;let countlimit = 50;SecurityEvent| where TimeGenerated >= ago(endtime)
This query defines common variables and starts querying the SecurityEvent table for data within the designated timeframe. You can modify the rule name and adjust its severity. For this demonstration, set the severity to Medium.When you click View Query Results, you might see a query similar to this which investigates login failures:
Copy
where TimeGenerated >= ago(endTime)where EventID == 4625 and AccountType == "User"where IpAddress in ('127.0.0.1', '-1')summarize StartTime = min(TimeGenerated), EndTime = max(TimeGenerated)join kind=leftouter ( SecurityEvent) on TimeGenerated between (ago(starttime) .. ago(endtime))
This query captures failed login attempts, indicating a potential attack on the virtual machine (VM). To refine the alert and consolidate incident creation, use the following final version of the query:
Copy
let starttime = 8d;let endtime = 1d;let threshold = 0.333;let countlimit = 50;SecurityEvent| where TimeGenerated >= ago(endtime)| where EventID == 4625 and AccountType =~ "User"| where IpAddress in ("127.0.0.1", "::1")| summarize StartTime = min(TimeGenerated), EndTime = max(TimeGenerated), CountToday = count() by EventIDjoin kind=leftouter ( SecurityEvent) on $left.TimeGenerated between ($right.StartTime .. $right.EndTime)
This refined query detects failed login attempts by filtering on event ID 4625 for user accounts and specific IP addresses. It then summarizes event data and joins additional security events to provide context, forming a solid foundation for incident creation.
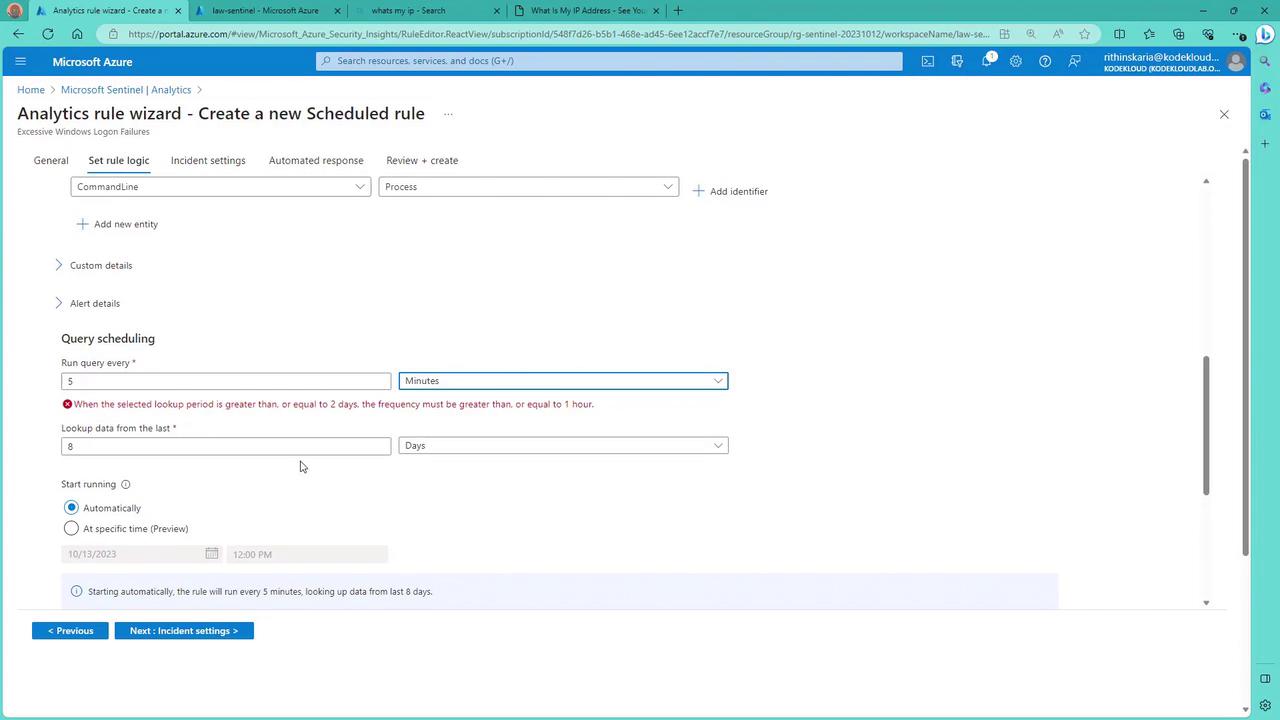
After finalizing the query, you can schedule it to run at regular intervals. In our example, the query is configured to run every five minutes with a lookback period of one day. The scheduling ensures that if the query returns any results—indicating a failed login attempt—the alert is automatically triggered.You also have options to:
Group alerts based on similarity to minimize noise.
Configure incident settings to automatically create an incident in Microsoft Sentinel under specific conditions.
You can further enhance the alert by incorporating custom fields from your Log Analytics query. However, the default setup will suffice for a basic configuration.
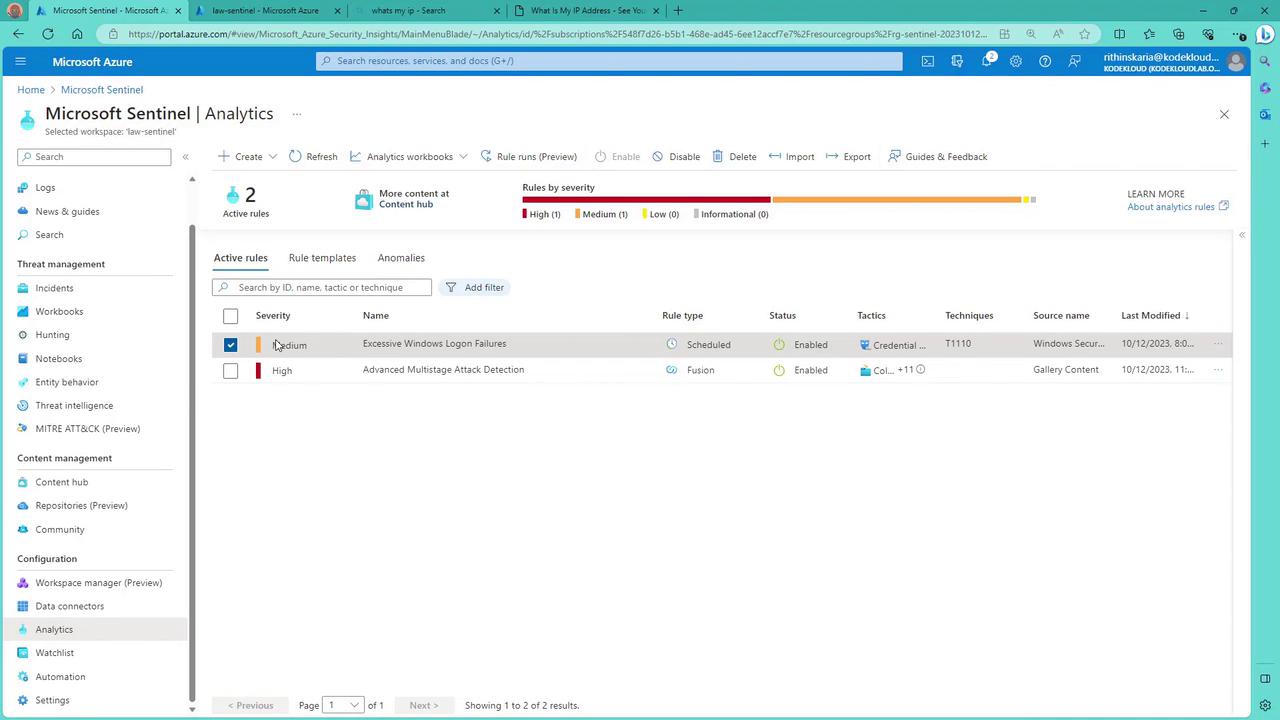
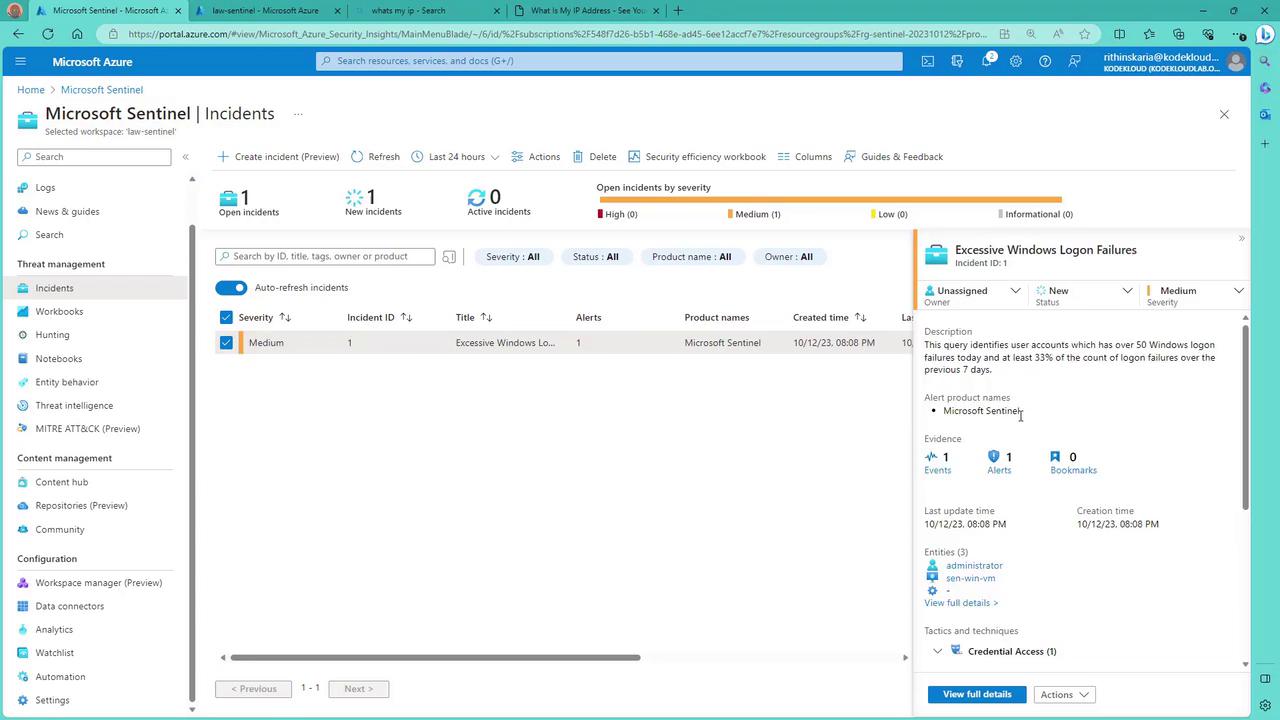
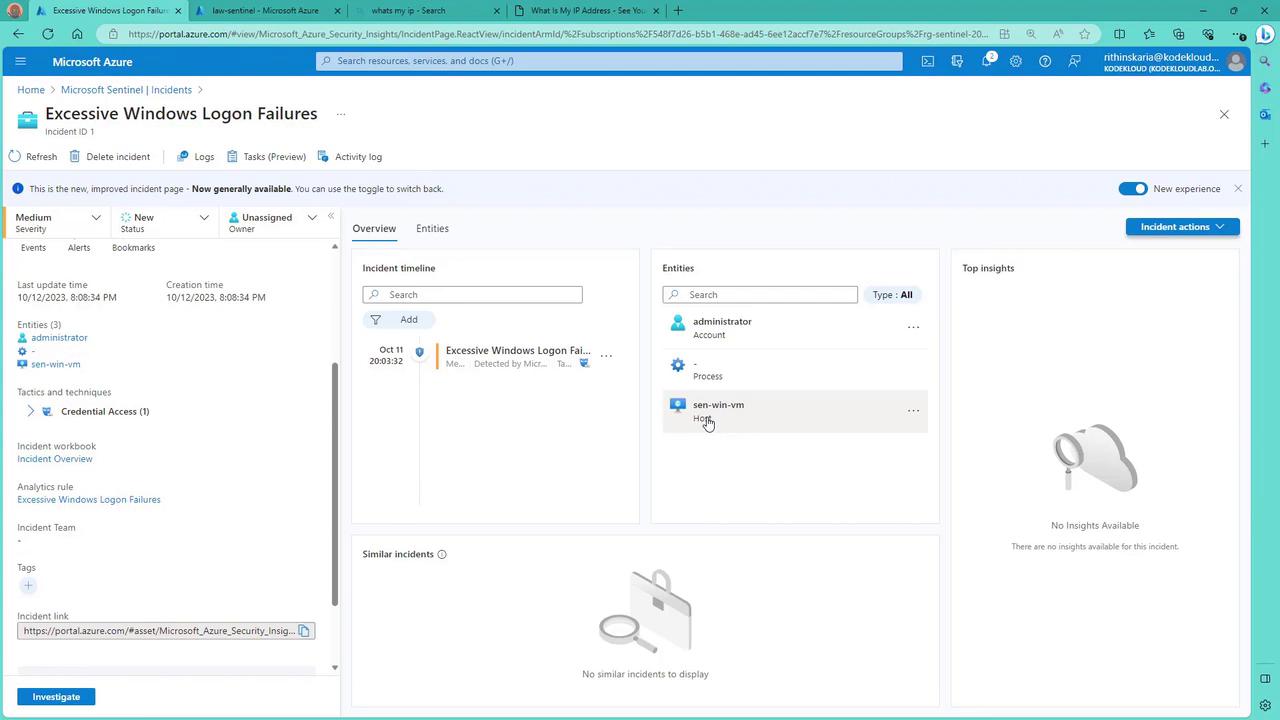
Microsoft Sentinel goes beyond alert creation by supporting automated responses. You can integrate playbooks or ARM-based automation to execute predefined actions when an incident occurs. Although you can configure automation in the current interface, details on setting up playbooks and advanced automation rules will be discussed in a subsequent article.To complete the process, review your settings and click Create. The analytics rule will then run automatically according to your schedule, and any matching events will generate an incident within Sentinel.Once an incident is recorded, you can inspect its details. This includes information such as the administrator username, the affected VM, and other relevant event data. Testing can be performed by simulating failed logins from the command line; after a few minutes, an incident should appear on the Sentinel dashboard.
Within the incident view, details such as the administrator’s information, VM name, and other event specifics are made available. To display additional information like IP addresses, simply map the corresponding field from your query to the incident layout.
By enabling rules in Microsoft Sentinel, you empower your organization to automatically detect, prioritize, and respond to security incidents. In this article, you learned how to create a custom rule for excessive Windows login failures, configure its scheduling, and review incidents as they are generated. In a future article, we will dive deeper into configuring playbooks and advanced automation rules for an even more robust security strategy.Happy securing!