Naming Convention
Metric names must be written in snake_case, meaning all letters are lowercase and words are separated by underscores. For instance, the metric namehttp_requests_total follows this convention.
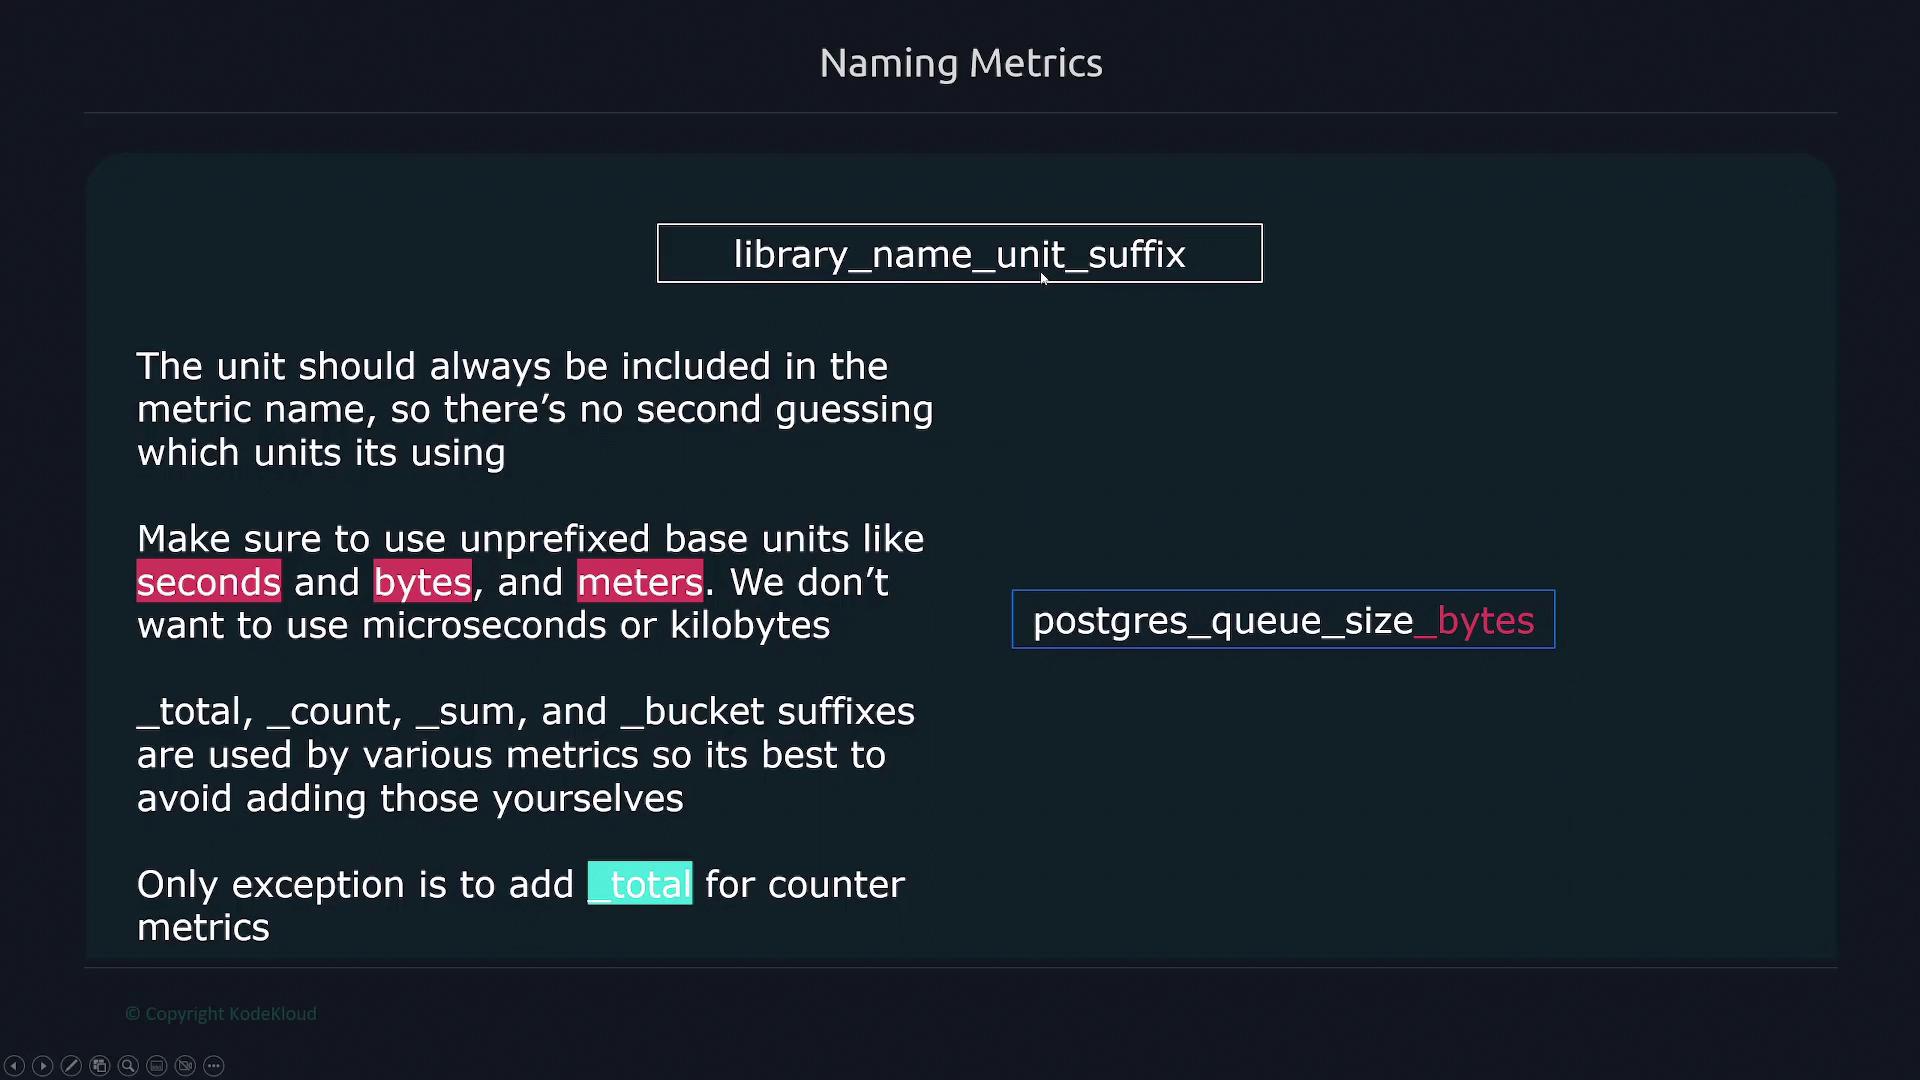
The structure for naming metrics should be:
- The first term represents the application or library associated with the metric. For example, metrics related to PostgreSQL should start with
postgresql_. - Subsequent terms describe what the metric measures, such as
queue_size. - Always append the unit of measurement (e.g., seconds, bytes, meters) to avoid misinterpretation. This ensures clarity, such as distinguishing between seconds and milliseconds.
- Use unprefixed base units (like seconds, bytes, meters) rather than their prefixed counterparts (such as microseconds or kilobytes).
- Avoid applying special suffixes like
_total,_count,_sum, and_bucketto custom names except that counter metrics should end with_total. Other metric types, including histograms, should not use these suffixes unless required.
Examples of Metric Names
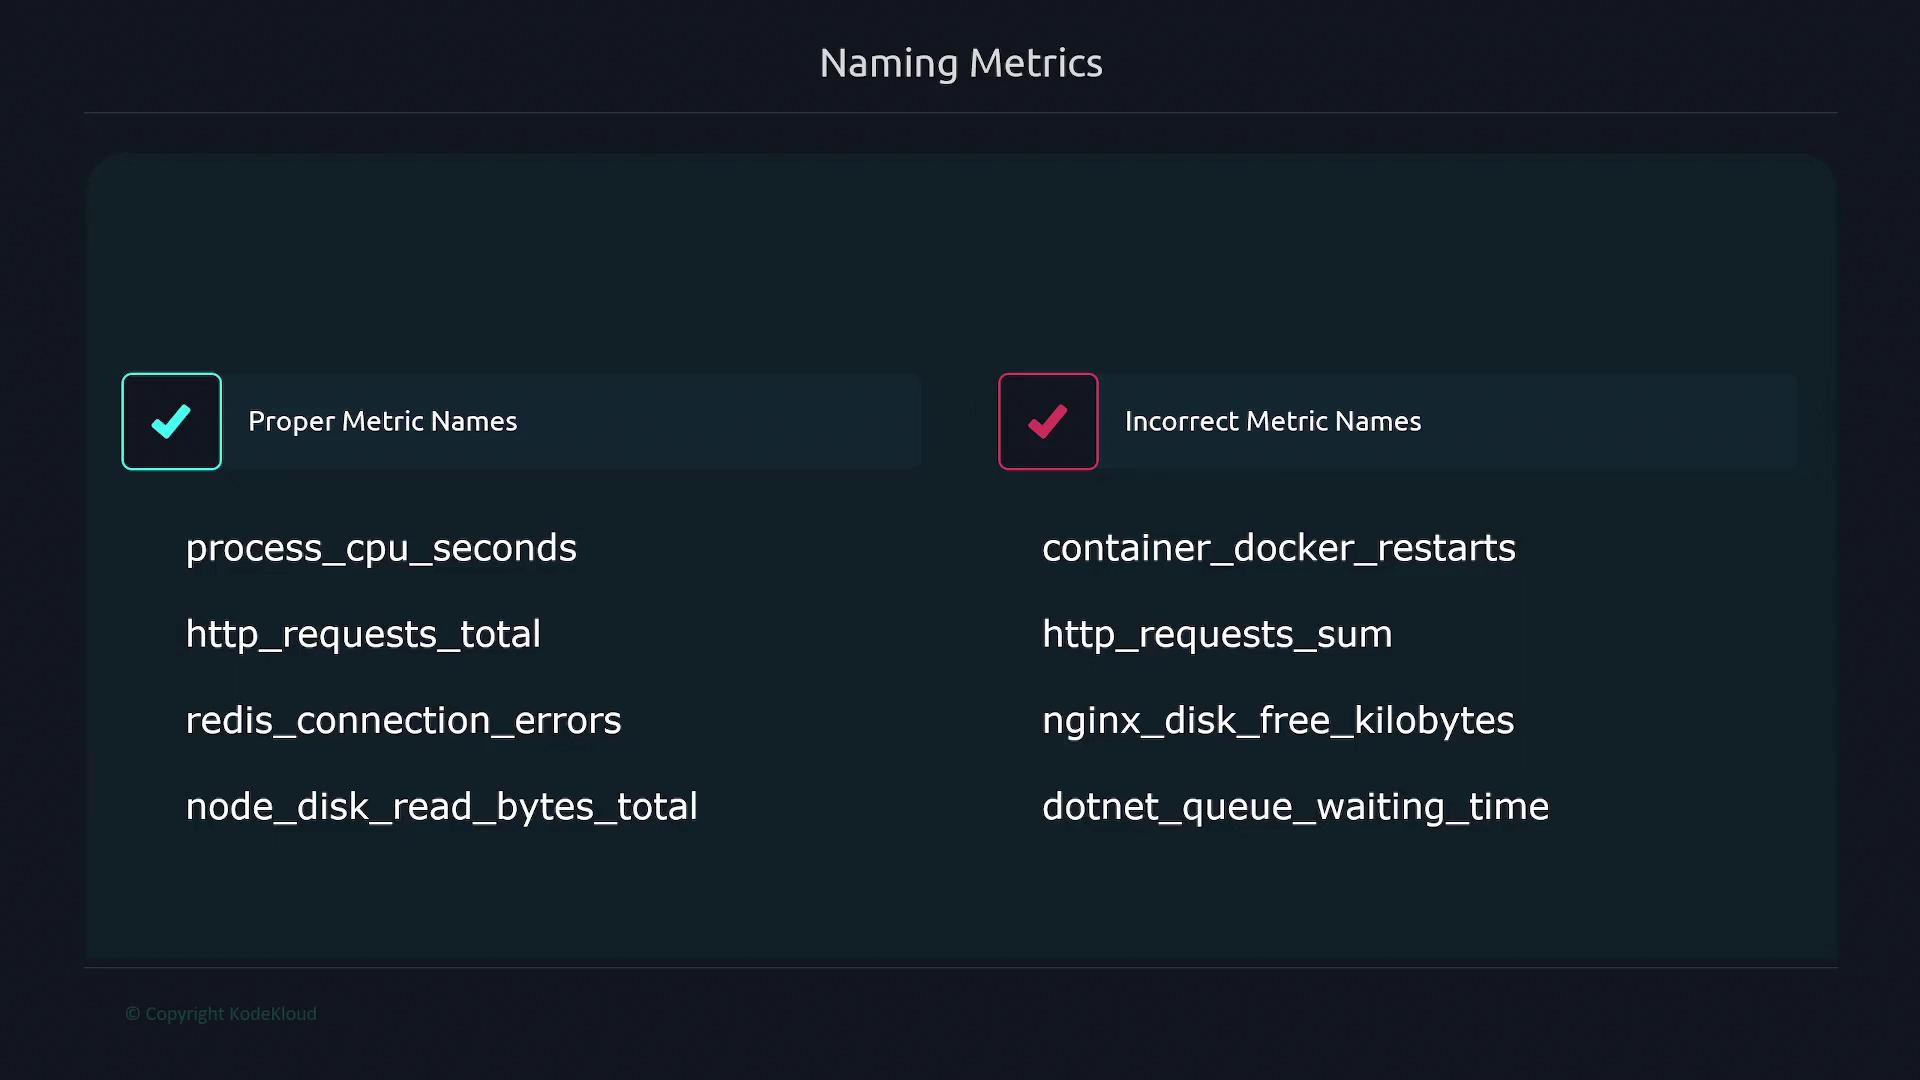
Below are some well-crafted examples that adhere to these conventions:process_cpu_secondsuses snake_case, begins with the application/library (process), and includes the unitseconds.http_requests_totalstarts with the relevant component (http), describes the metric (requests), and appropriately ends with_totalfor a counter metric.redis_connection_errorsclearly identifies the system (Redis) and describes the error type.
For tracking connection errors as a counter metric, you might use
redis_connection_errors_total. In the case of node_disk_read_bytes_total, the name effectively highlights the source (Node), the measured metric (disk read bytes), and marks it as a counter with _total.-
Bad Example:
container Docker restarts
Recommendation: Use snake_case and place the library name first. Instead, usedocker_container_restarts. -
Bad Example:
HTTP_request_sum
Recommendation: Do not use terms likesumwhich could lead to confusion. -
Bad Example:
nginx_disk_free_kilobytes
Recommendation: Replacekilobyteswith the base unitbytes. -
Bad Example:
.NET queue waiting time
Recommendation: Always include the unit for clarity.
What to Instrument
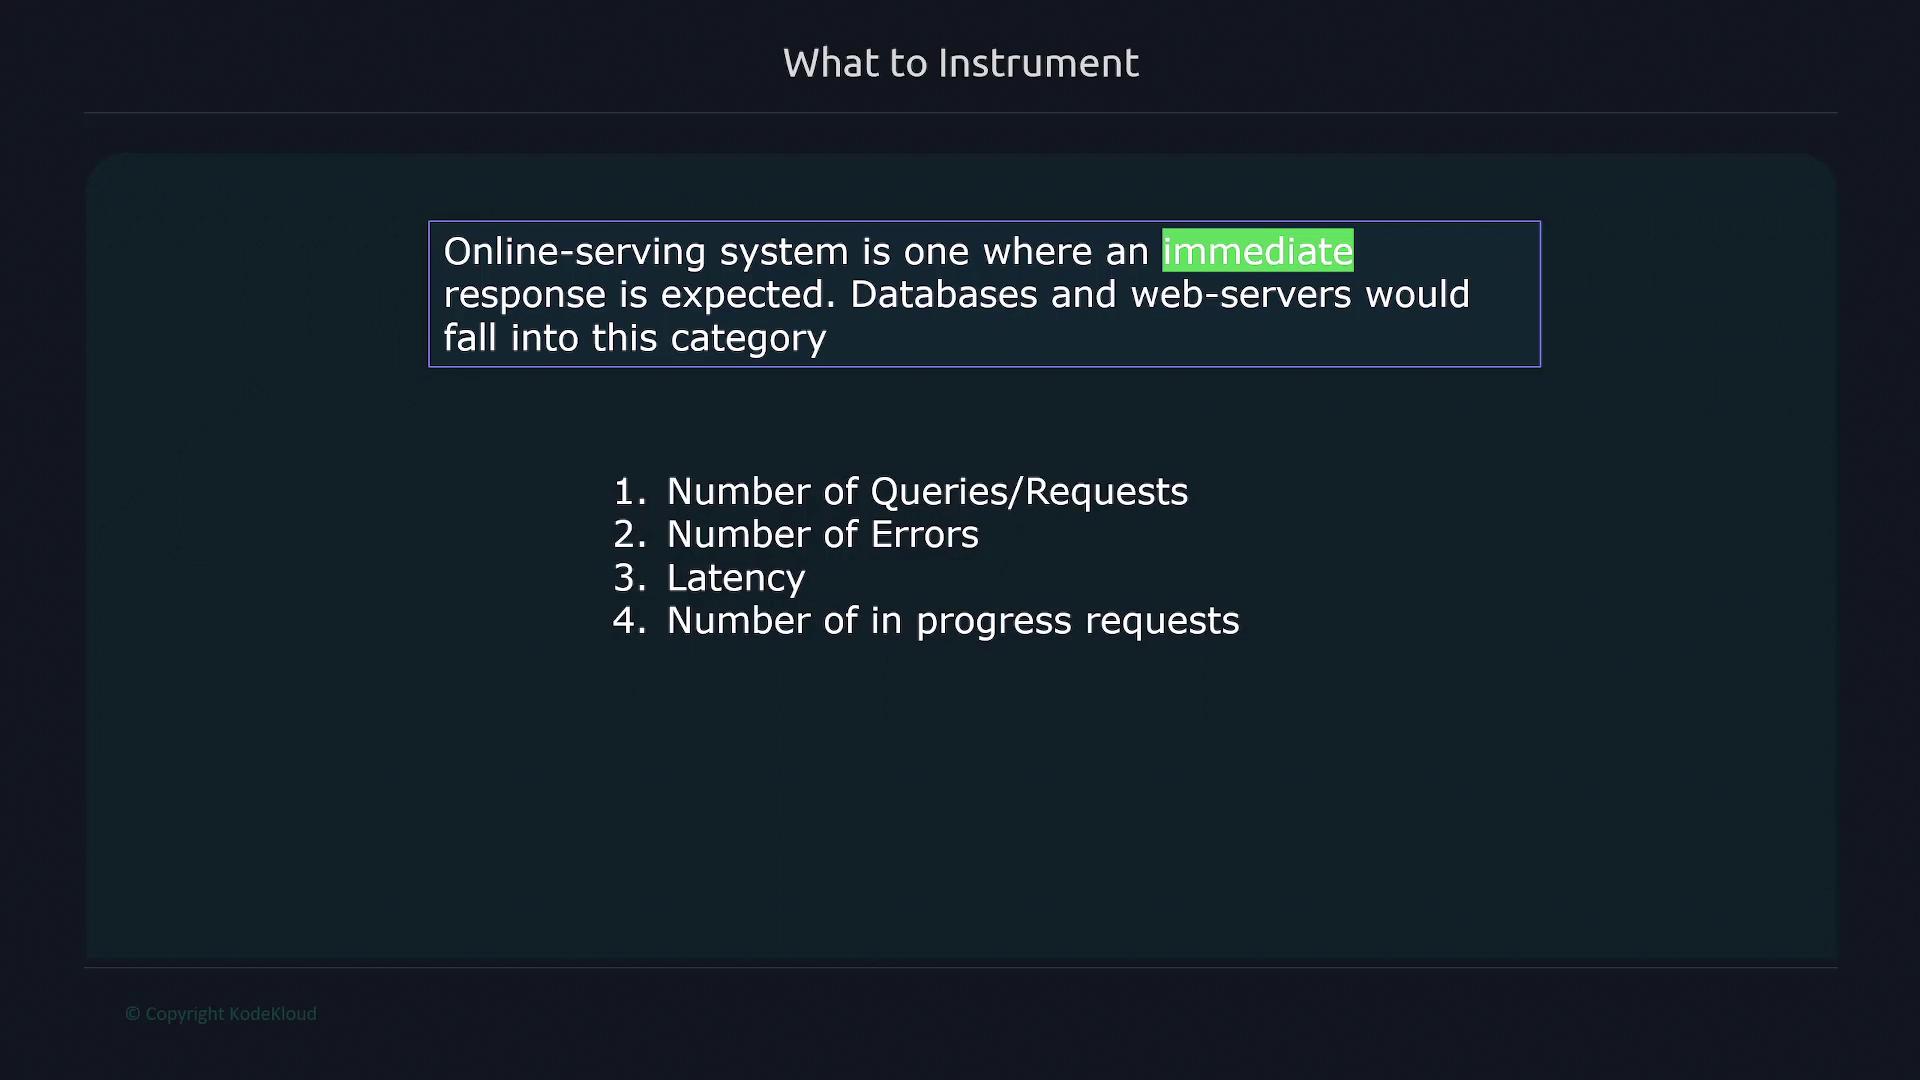
Choosing what to instrument depends on your system’s type and its requirements. Metrics should be tailored to the specific operational context. Generally, there are three main types of applications:1. Online Serving Systems
Online serving systems require immediate responses. They include components such as databases, web servers, and APIs. Common metrics for these systems include:- Total number of requests or queries
- Number of errors
- Latency measurements
- Number of in-progress requests
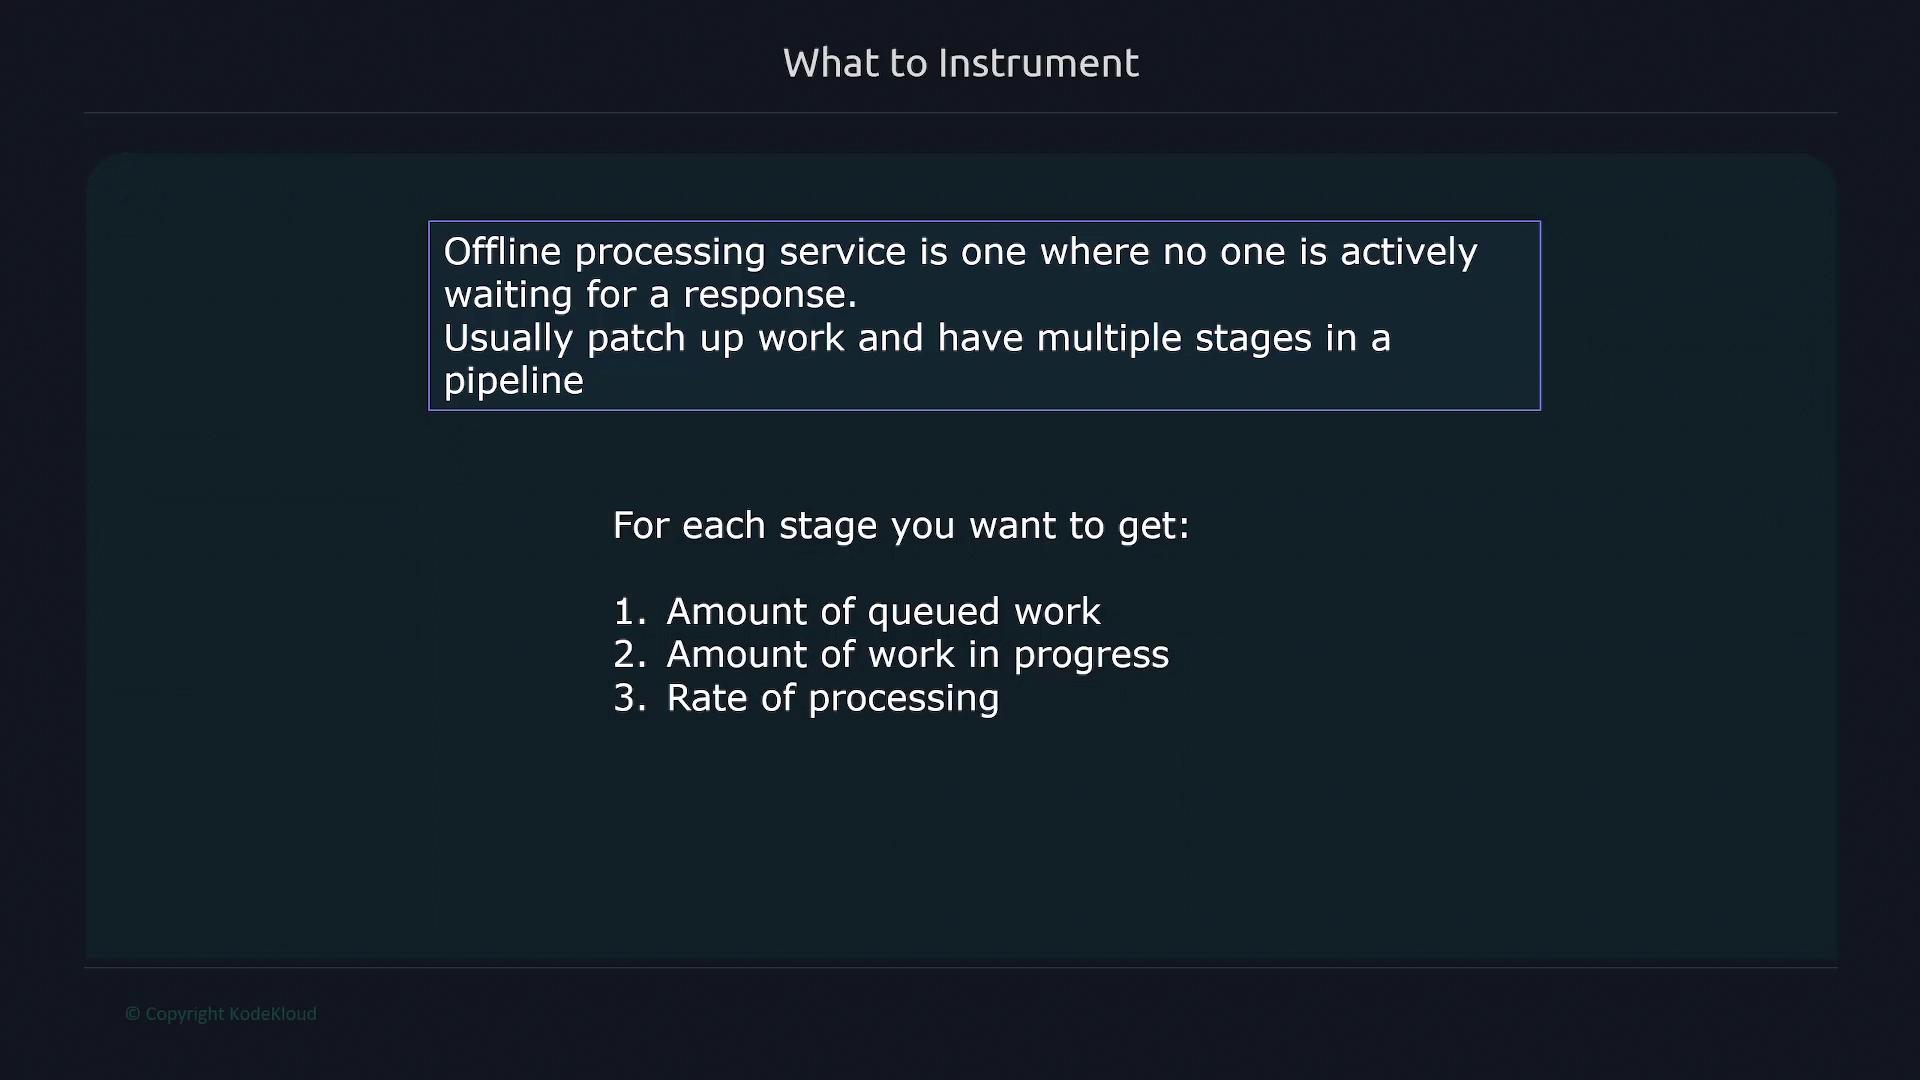
2. Offline Processing Services
Offline processing services are used where immediate responses are not required. These systems typically perform batch processes involving multiple stages. Metrics to consider include:- Total amount of work to be done
- Volume of queued work
- Number of work items in progress
- Processing rates
- Errors at various processing stages
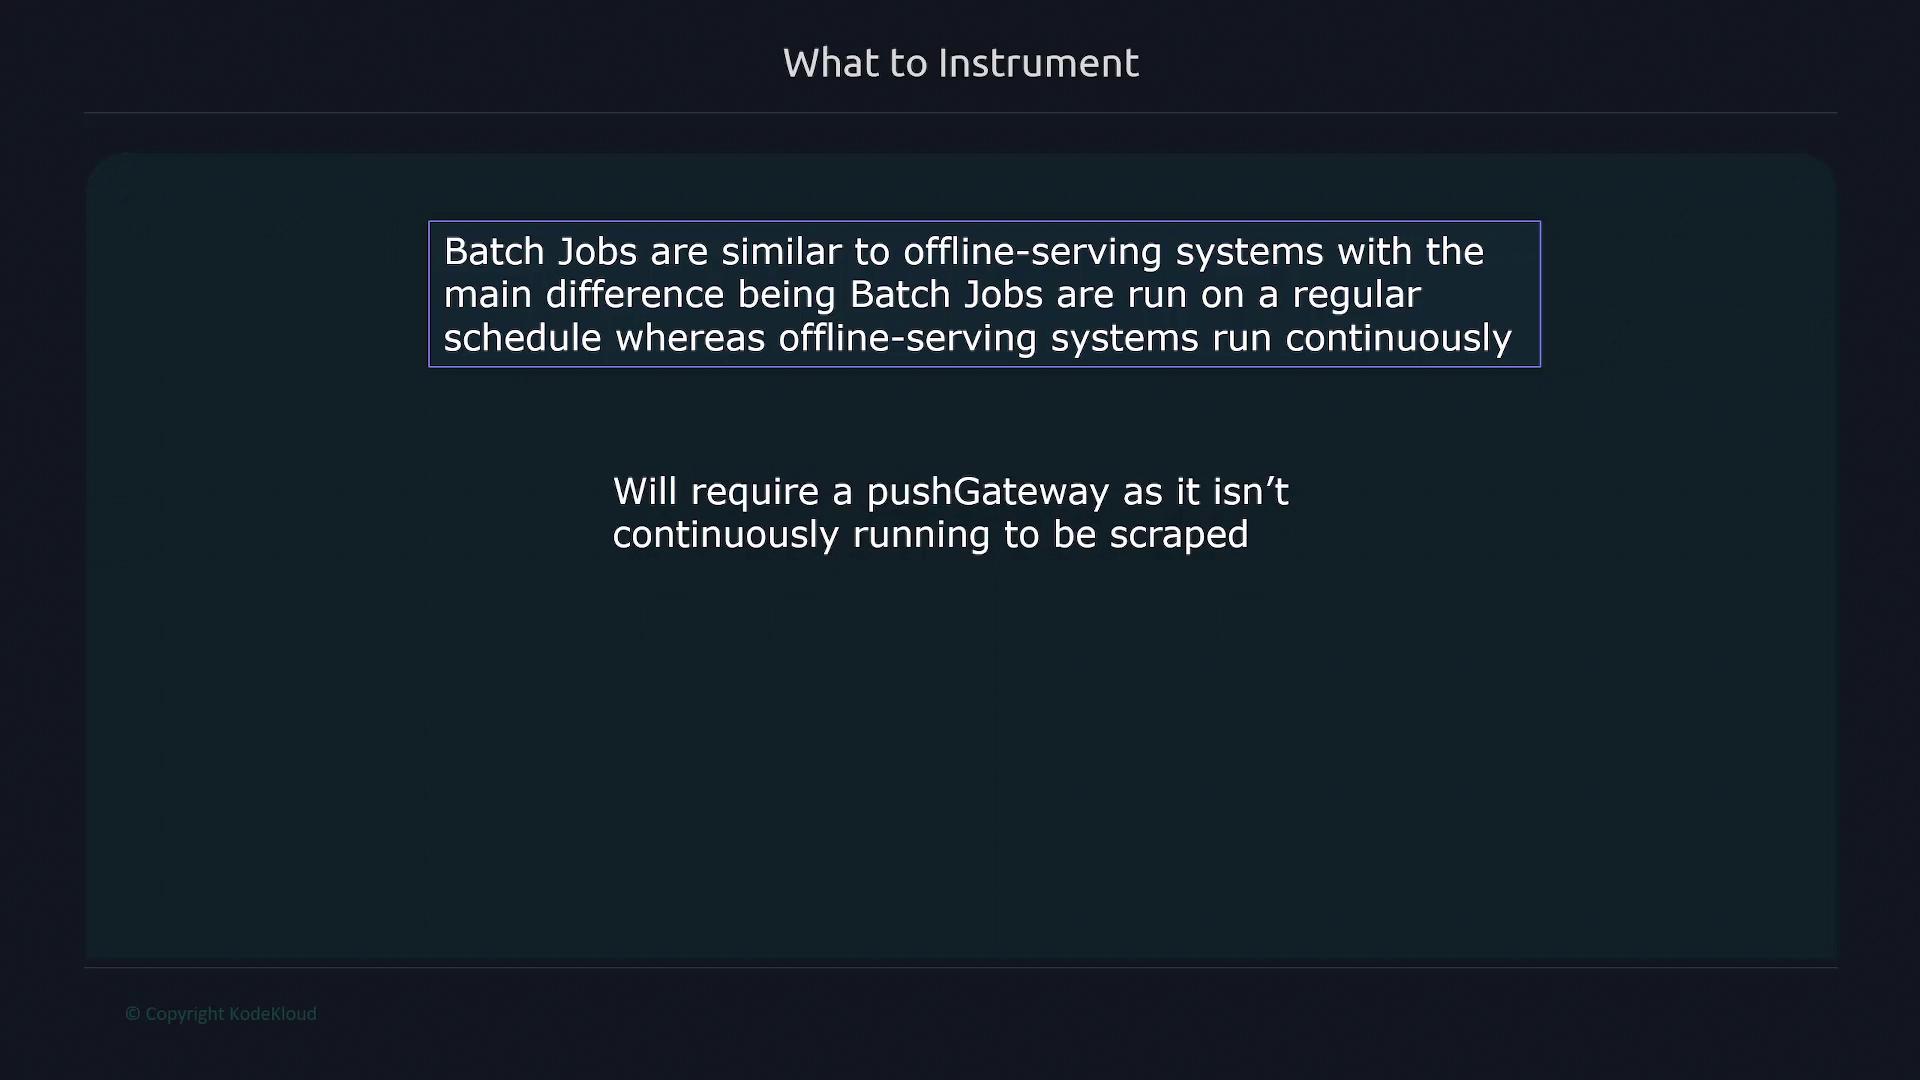
3. Batch Jobs
Batch jobs are scheduled to run at specific intervals rather than continuously. Because batch jobs do not run continuously, using a Push Gateway is often recommended for effective data collection. Key metrics for batch jobs should include:- Time spent processing each stage of the job
- Overall runtime of the job
- Timestamp of the last job completion
Implementing these best practices ensures that your metrics are consistently named and accurately monitored, ultimately improving observability and simplifying troubleshooting across your systems.