Prometheus Certified Associate (PCA)
Service Discovery
Introduction
In this article, we explore how Prometheus leverages service discovery to streamline monitoring in dynamic environments. Understanding service discovery is essential for managing ever-changing infrastructures where servers and services frequently scale up or down.
Imagine you have a Prometheus configuration file that defines a static list of targets for scraping metrics. Initially, your configuration might look like this:
scrape_configs:
  - job_name: "web"
    static_configs:
      - targets: ["localhost:9090"]
  - job_name: "node"
    static_configs:
      - targets: ["192.168.1.168:9100"]
  - job_name: "docker"
    static_configs:
      - targets: ["localhost:9323"]
Over time, as new servers join your infrastructure, you must update the Prometheus configuration with additional scrape targets. For example, when adding a new database server, the configuration is updated as follows:
scrape_configs:
  - job_name: "web"
    static_configs:
      - targets: ["localhost:9090"]
  - job_name: "node"
    static_configs:
      - targets: ["192.168.1.168:9100"]
  - job_name: "docker"
    static_configs:
      - targets: ["localhost:9323"]
  - job_name: "database"
    static_configs:
      - targets: ["localhost:9090"]
Similarly, if you decide to decommission your web server or change its port, you would need to manually remove or update its configuration. For example, updating the web server target's port might result in:
scrape_configs:
  - job_name: "web"
    static_configs:
      - targets: ["localhost:9008"]
  - job_name: "node"
    static_configs:
      - targets: ["192.168.1.168:9100"]
  - job_name: "docker"
    static_configs:
      - targets: ["localhost:9323"]
  - job_name: "database"
    static_configs:
      - targets: ["localhost:9090"]
Note
In fast-growing and dynamic environments, managing these manual configuration changes can be both tedious and error-prone.
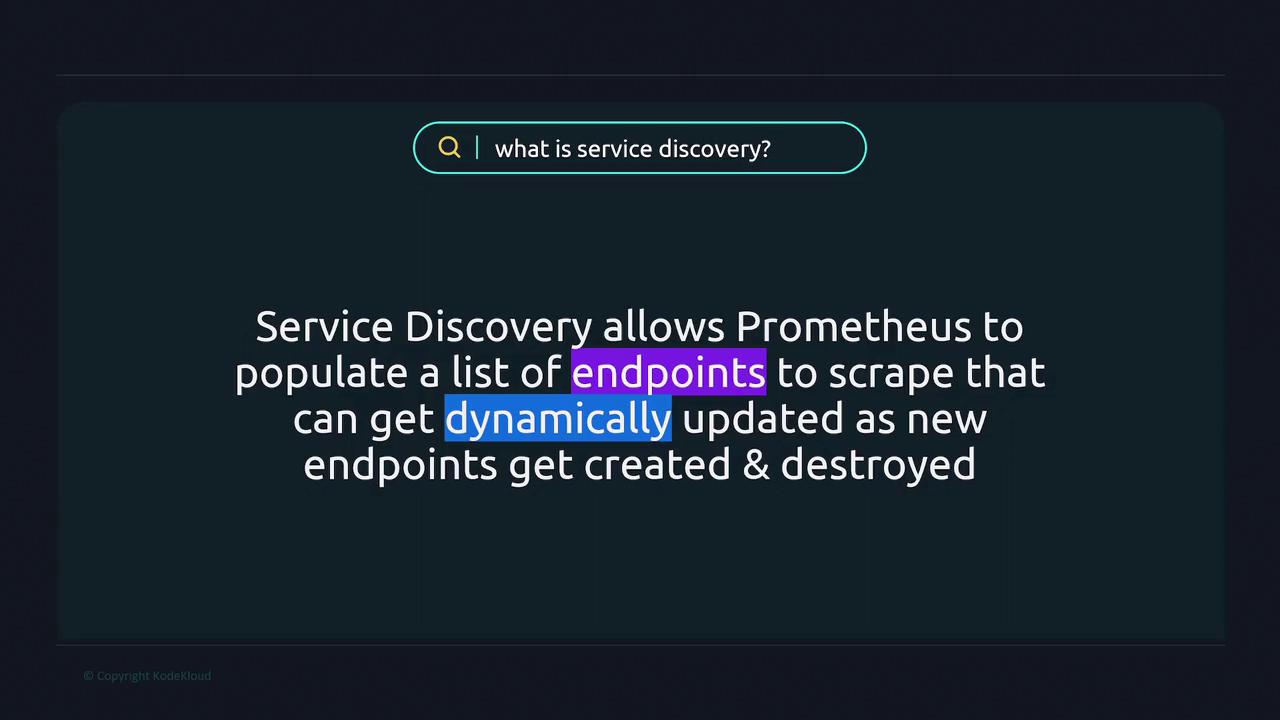
This is where service discovery in Prometheus becomes invaluable. By automatically populating a list of scrape endpoints, service discovery dynamically updates monitoring targets as new instances emerge or get decommissioned, eliminating the need for constant manual adjustments.
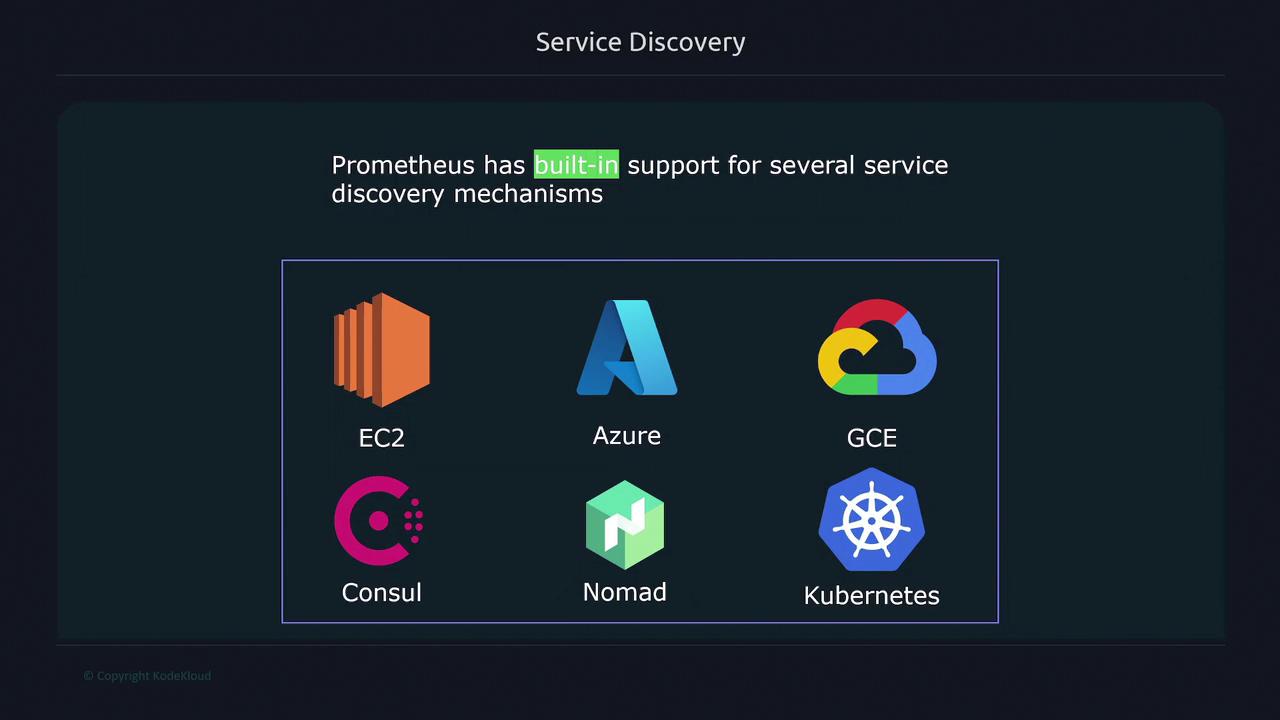
Prometheus supports several built-in service discovery mechanisms to accommodate various environments. It integrates with popular cloud providers such as Amazon Elastic Compute Cloud (EC2) and Microsoft Azure Fundamentals (AZ900). In addition, Prometheus offers compatibility with other major cloud platforms and tools like Consul, Nomad, and Kubernetes—the latter being renowned for its dynamic orchestration.
Even the static configuration method discussed earlier is technically a basic form of service discovery, as it explicitly defines which HTTP endpoints Prometheus should monitor. In the sections that follow, we will delve deeper into the various service discovery methods supported by Prometheus and demonstrate how they simplify the management of dynamic and scalable environments.
Watch Video
Watch video content