This article discusses using Prometheus client libraries to instrument applications for metric tracking and monitoring across various programming languages.
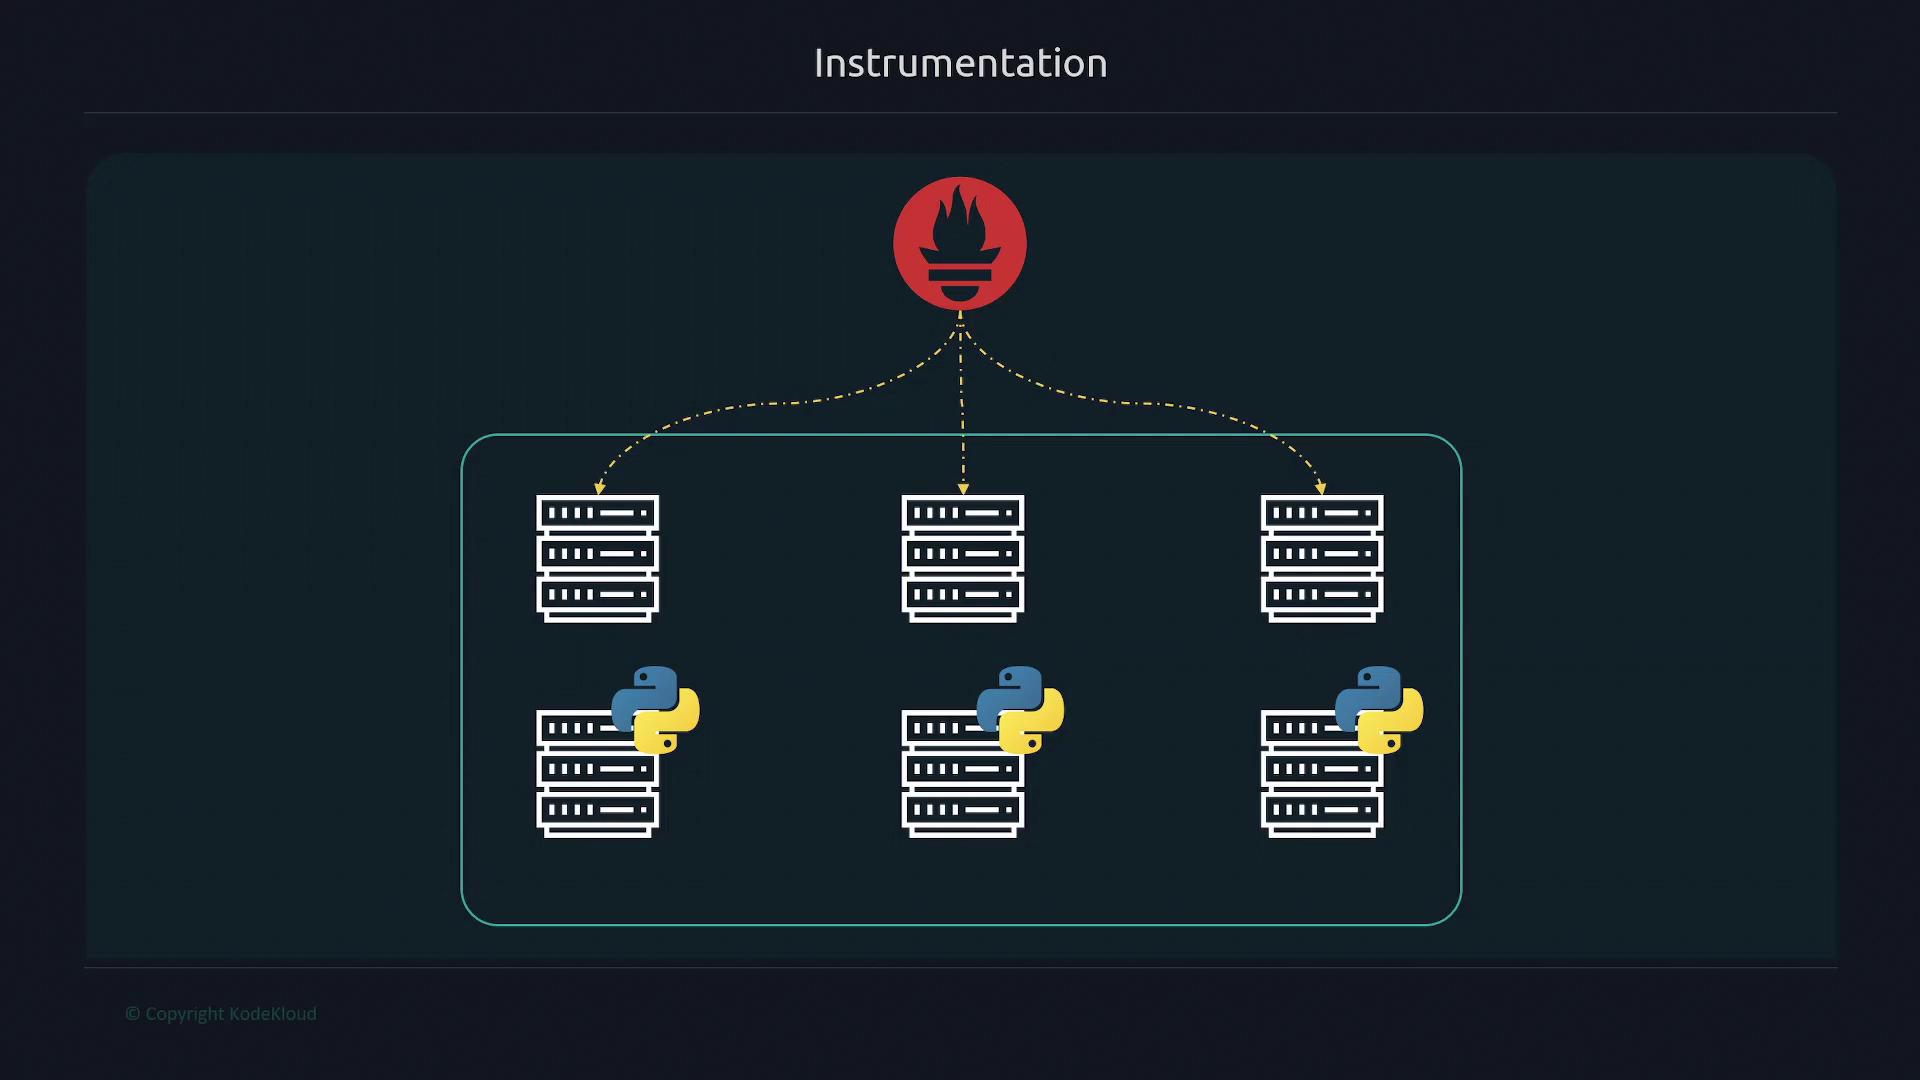
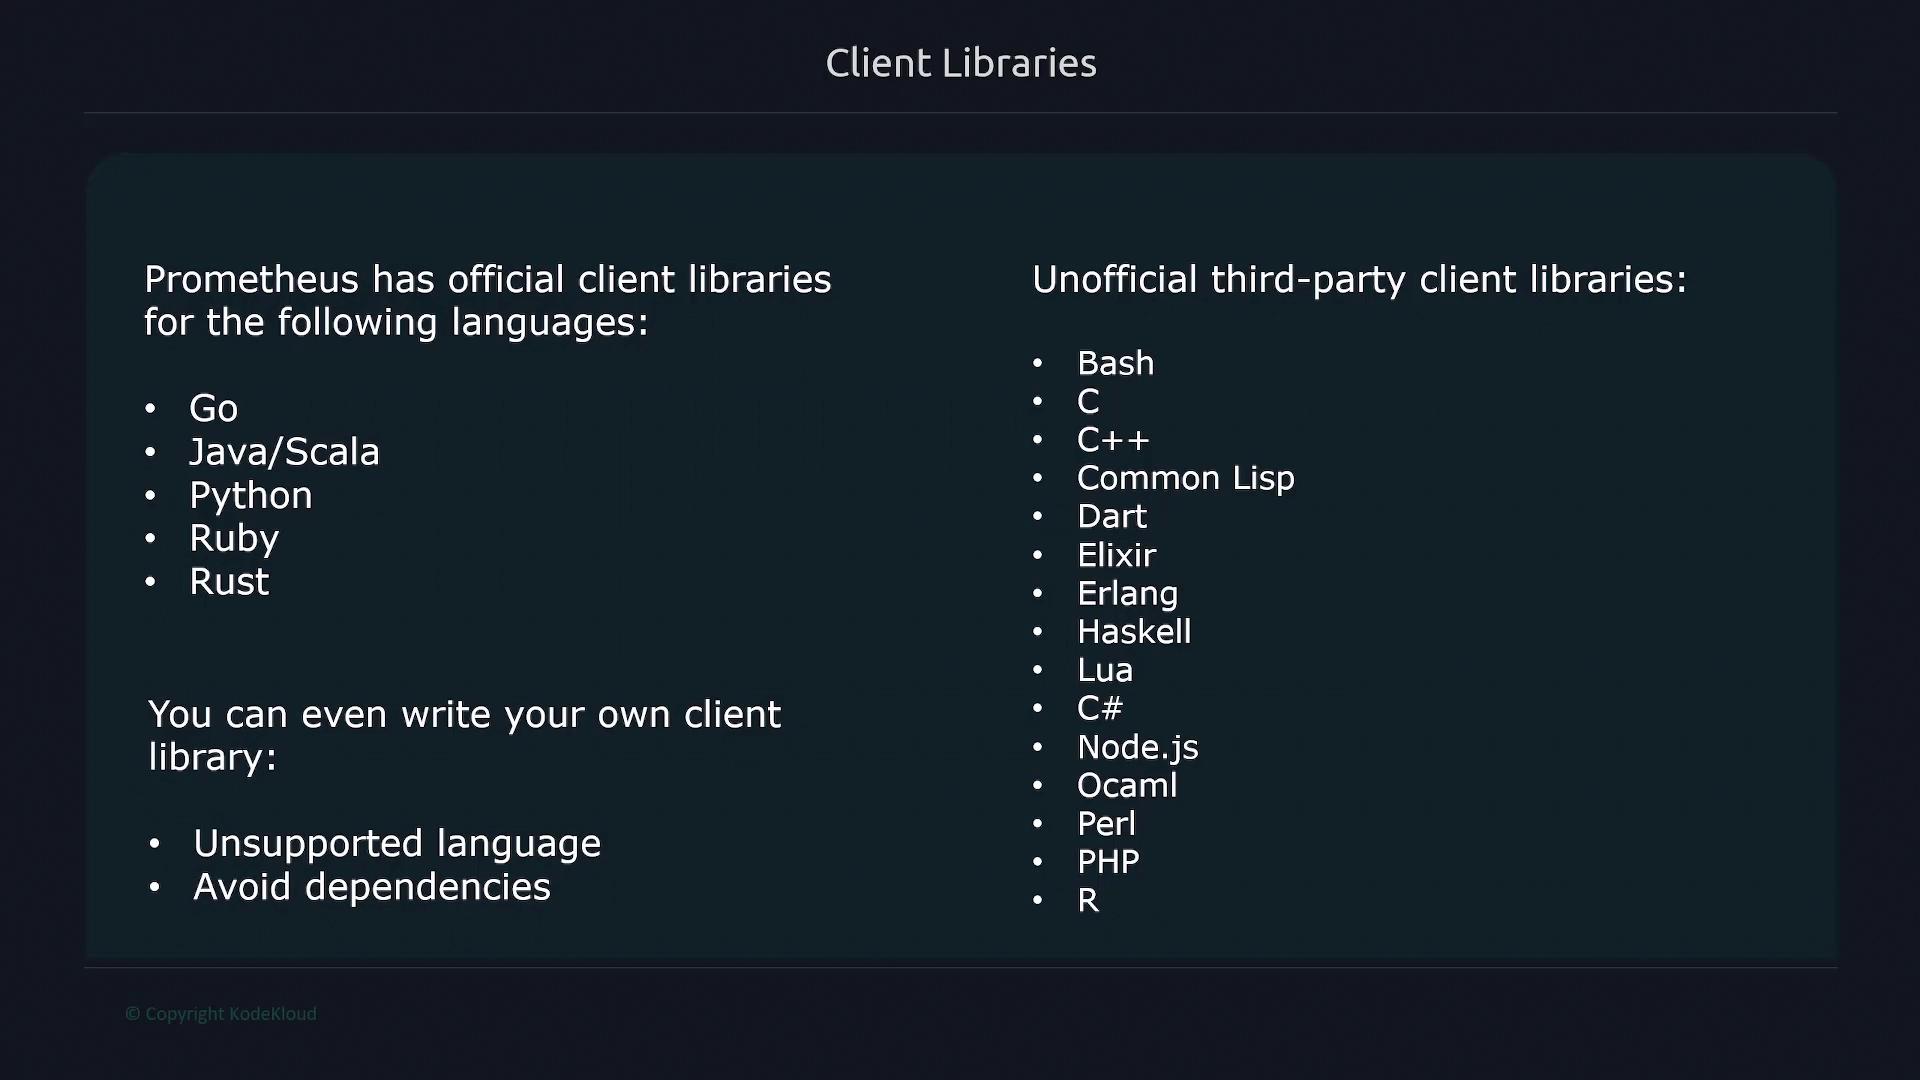
Prometheus is already monitoring metrics from various components of our infrastructure, including Linux servers, Windows servers, Docker containers, and the Docker engine. However, to gather metrics specific to your application, you need to add instrumentation directly in your code. This is where Prometheus client libraries become indispensable.A Prometheus client library simplifies the process of embedding metric tracking into your application. It formats the metrics following the Prometheus standard and exposes them via a /metrics endpoint, where Prometheus can easily scrape and collect them.Prometheus officially supports several client libraries for these popular programming languages:
Go
Java
Python
Ruby
Rust
In addition, there are unofficial third-party client libraries available for other languages, and you can even develop your own library if your language isn’t supported or to avoid extra dependencies.For a clear visual representation, refer to the network diagram below which shows a centralized Prometheus instance monitoring multiple servers and Docker engines:
Below is a JavaScript code snippet that demonstrates a functional approach used in one of the client libraries:
Copy
res = fms.reduce((accum, next) => next(accum), res)const unfold = (f, seed) => { const res = f(seed) return res ? [res[0]].concat(unfold(f, res[1])) : acc}return g0f(seed, [])
Effective instrumentation in your application can provide valuable insights into performance and usage metrics, which are essential for optimizing and troubleshooting in production environments.
In this lesson, our focus is on instrumenting a Python-based application. Even if you’re new to Python or programming in general, you will learn how to integrate metric collection within your application, and understand the types of metrics being tracked. These principles apply regardless of your programming language or application type.The diagram below categorizes both official and unofficial Prometheus client libraries by language (e.g., Go, Java/Scala, Python, etc.), and also highlights the flexibility to create custom client libraries if necessary:
Our primary focus will be on instrumenting an API to collect detailed metrics, ensuring robust monitoring and performance optimization for your services.