This article explores Prometheus console templates for creating custom HTML dashboards using the Go templating language.
This article provides an in-depth look at Prometheus’s alternative built-in visualization tool—console templates. With console templates, you can create custom HTML pages using the Go templating language. These pages can embed various metrics, queries, and charts, enabling you to design personalized dashboards that prominently display your desired data.
By navigating to /etc/prometheus/consoles, you can explore several pre-built templates. These templates allow you to construct individual blocks for different parts of a webpage—such as headers, charts, tables, footers, or sidebars—so you can assemble a complete dashboard focused on your specific monitoring needs.
Copy
$ ls /etc/prometheus/consolesdrwxr-xr-x 2 user1 user1 4096 Oct 7 12:24 .drwxr-xr-x 5 user1 user1 4096 Oct 17 22:23 ..-rw-r--r-- 1 user1 user1 616 Oct 7 12:24 index.html.example-rw-r--r-- 1 user1 user1 2675 Oct 7 12:24 node-disk.html-rw-r--r-- 1 user1 user1 3522 Oct 7 12:24 node.html-rw-r--r-- 1 user1 user1 1453 Oct 7 12:24 node-overview.html-rw-r--r-- 1 user1 user1 5783 Oct 7 12:24 prometheus.html-rw-r--r-- 1 user1 user1 4103 Oct 7 12:24 prometheus-overview.html
Each file corresponds to a different template. For example, the file index.html.example includes the following structure using the Go templating language:
Copy
{{ template "head" . }}{{ template "prom_right_table_head" }}{{ template "prom_right_table_tail" }}{{ template "prom_content_head" . }}<h1>Overview</h1><p>These are example consoles for Prometheus.</p><p>These consoles expect exporters to have the following job labels:</p><table class="table table-sm table-striped table-bordered" style="width: 0%"> <tr> <th>Exporter</th> <th>Job label</th> </tr> <tr> <td>Node Exporter</td> <td><code>node</code></td> </tr> <tr> <td>Prometheus</td> <td><code>prometheus</code></td> </tr></table>{{ template "prom_content_tail" . }}{{ template "tail" }}
When you list the files in the /etc/prometheus/consoles folder, you will notice several pages similar to the example:
Copy
user1 in /etc/prometheus➜ ls -l /etc/prometheus/console/total 40-rw-r--r-- 1 root root 383 Nov 15 04:42 demo.html-rw-r--r-- 1 prometheus prometheus 616 Nov 12 23:20 index.html.example-rw-r--r-- 1 prometheus prometheus 2675 Nov 12 23:20 node-cpu.html-rw-r--r-- 1 prometheus prometheus 3522 Nov 12 23:20 node-disk.html-rw-r--r-- 1 prometheus prometheus 1453 Nov 12 23:20 node.html-rw-r--r-- 1 prometheus prometheus 5783 Nov 12 23:20 node-overview.html-rw-r--r-- 1 prometheus prometheus 1334 Nov 12 23:20 prometheus.html-rw-r--r-- 1 prometheus prometheus 4103 Nov 12 23:20 prometheus-overview.html
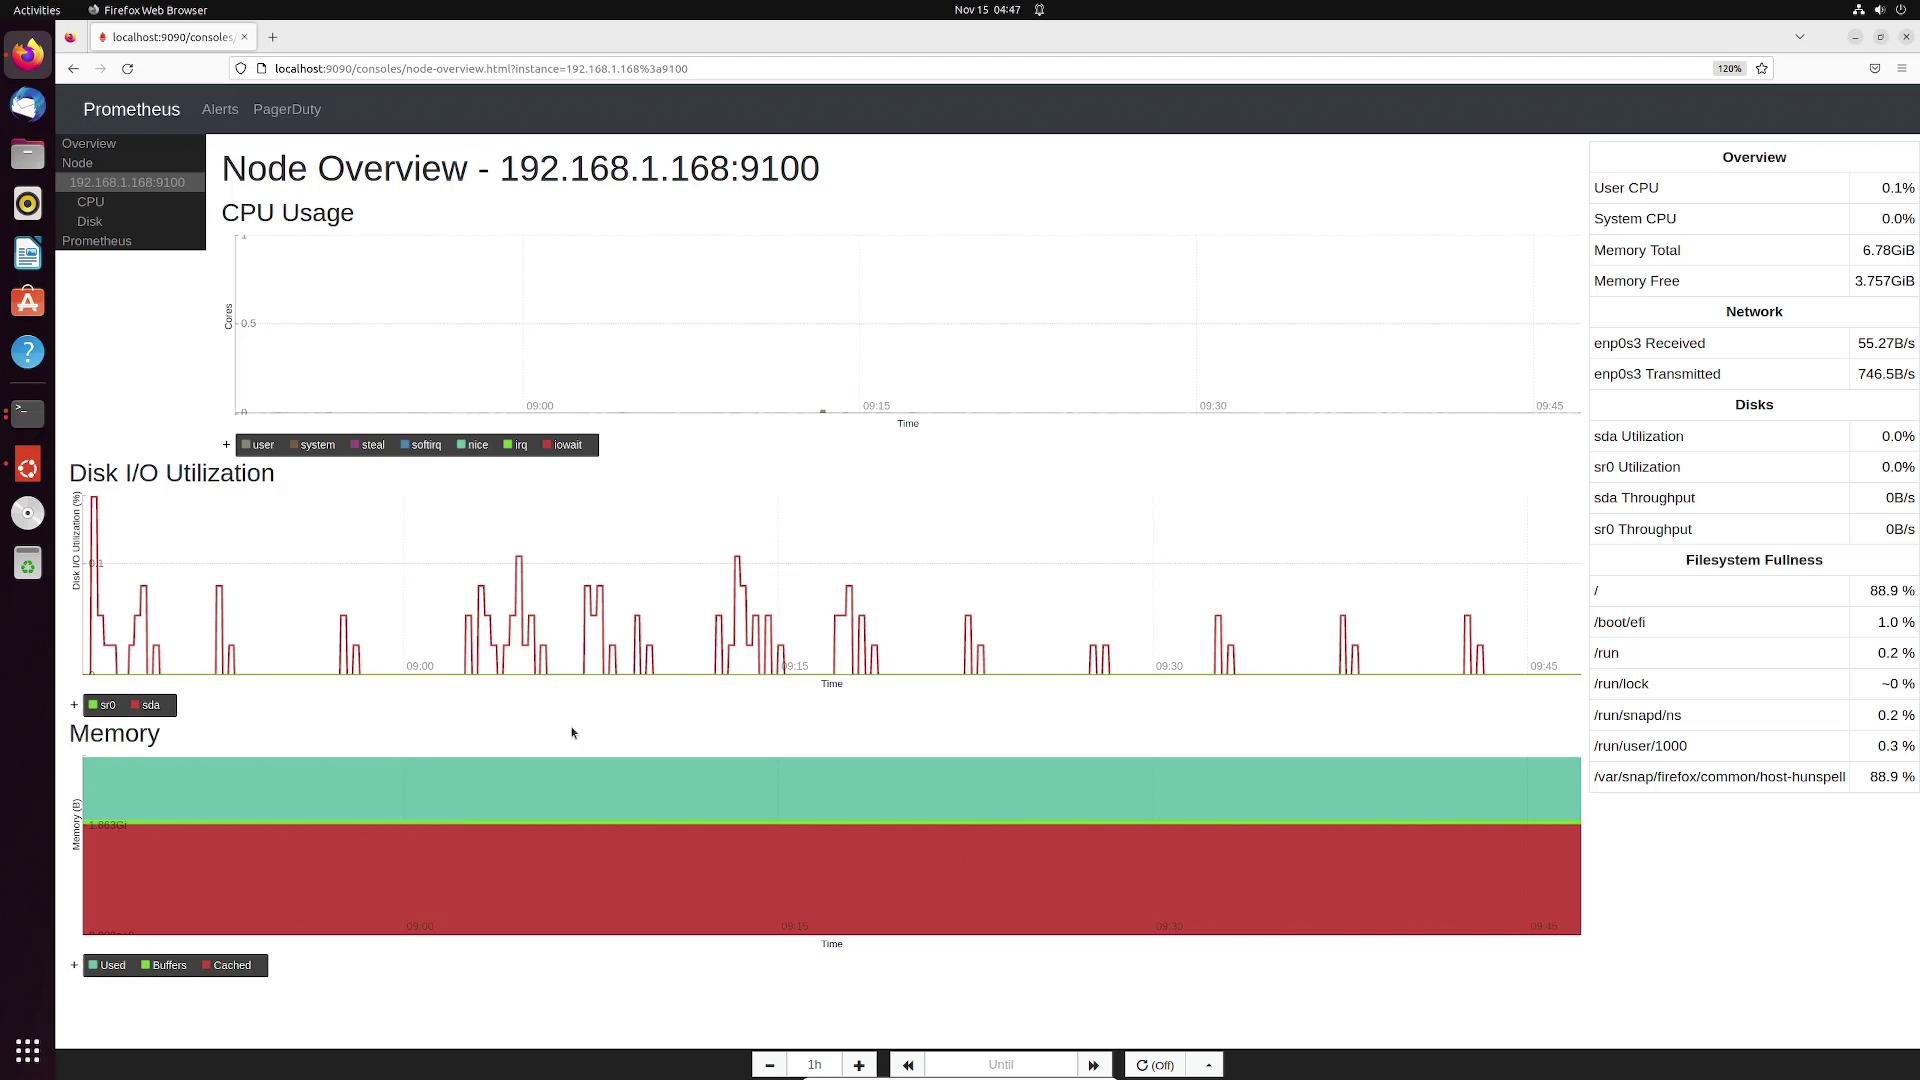
When you access the /consoles path on your Prometheus server and select a file (for example, index.html.example), the console template will render in action. It displays the defined jobs—such as one labeled node (using Node Exporter) and another called Prometheus—along with various options. Clicking on a job navigates to a detailed dashboard that includes metrics like CPU utilization, disk I/O, memory usage, and more.
Using console templates simplifies the creation of dashboards by allowing you to reuse predefined components and embed dynamic data quickly.
To customize your own dashboard, start by navigating to the Prometheus consoles folder and create a new template file named demo.html (or use a name of your choice):
Copy
user1 in /etc/prometheus/consoles> cd /etc/prometheus/consoles/user1 in /etc/prometheus/consoles> lsindex.html.example node-cpu.html node-disk.html node.html node-overview.html prometheus.html prometheus-overview.htmluser1 in /etc/prometheus/consoles> sudo vi demo.html
Initially, the file might contain boilerplate code similar to the following:
These template calls add a standard header and footer to your HTML page. To personalize the page, remove any unnecessary sections and integrate your own HTML content. For instance, you could modify the file to include a custom header:
To display dynamic metric data, you can integrate a PromQL query drilldown. This feature displays the query result and links to the Prometheus expression browser for further inspection. For example, to show the “active memory” metric using the node_memory_Active_bytes query, update your template as follows:
The <div> with the ID “graph” acts as a placeholder for the chart.
A JavaScript block creates a new graph using new PromConsole.Graph({...}) with the following parameters:
The node parameter locates the <div> container using document.querySelector("#graph").
The expr parameter supplies the PromQL query rate(node_memory_Active_bytes[2m]) to fetch the metric data.
After saving the file, accessing demo.html via your Prometheus server will display your custom dashboard. The page will include a header, the “Memory details” section showing the dynamic active memory metric, and an interactive chart that visualizes changes in active memory over a two-minute interval. Clicking on the metric value redirects you to the Prometheus expression browser for additional insights.
This example demonstrates how simple it is to customize Prometheus dashboards using console templates. Use this foundation to monitor any metrics specific to your environment.