The article provides a guide on using the Expression Browser in Prometheus for executing PromQL queries and generating simple graphs.
The Expression Browser is a built-in web UI provided by Prometheus that allows you to execute ad hoc PromQL queries and generate simple graphs. While it offers only basic functionality, it is an ideal tool for quick debugging and one-off queries. However, note that it is not designed for building custom dashboards or handling day-to-day monitoring.
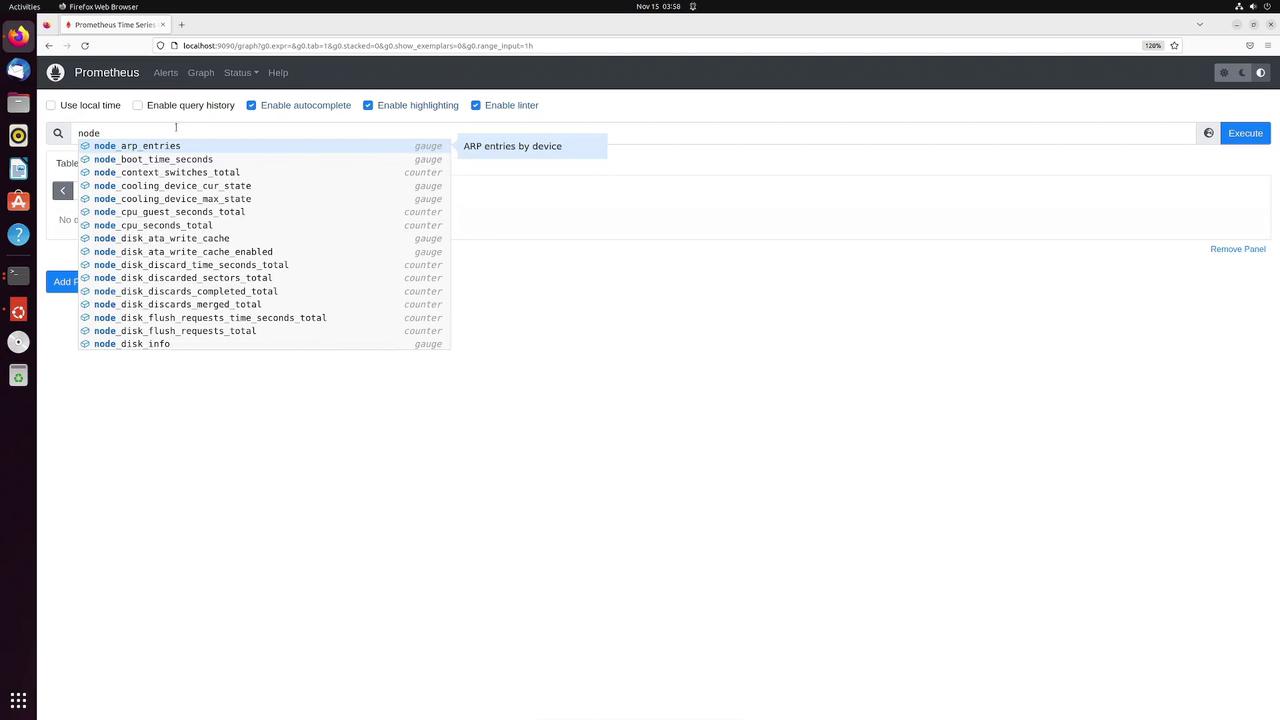
To get started, open your web browser and navigate to the IP address of your Prometheus server along with the appropriate port number. This action loads the Expression Browser interface, where you can input any PromQL query.For instance, type “node” into the query editor. With autocomplete enabled, the interface will suggest available metrics that begin with “node” along with their types. If autocomplete is disabled, these suggestions will not appear.
When testing queries with autocomplete, ensure it is enabled in your browser settings to maximize efficiency.
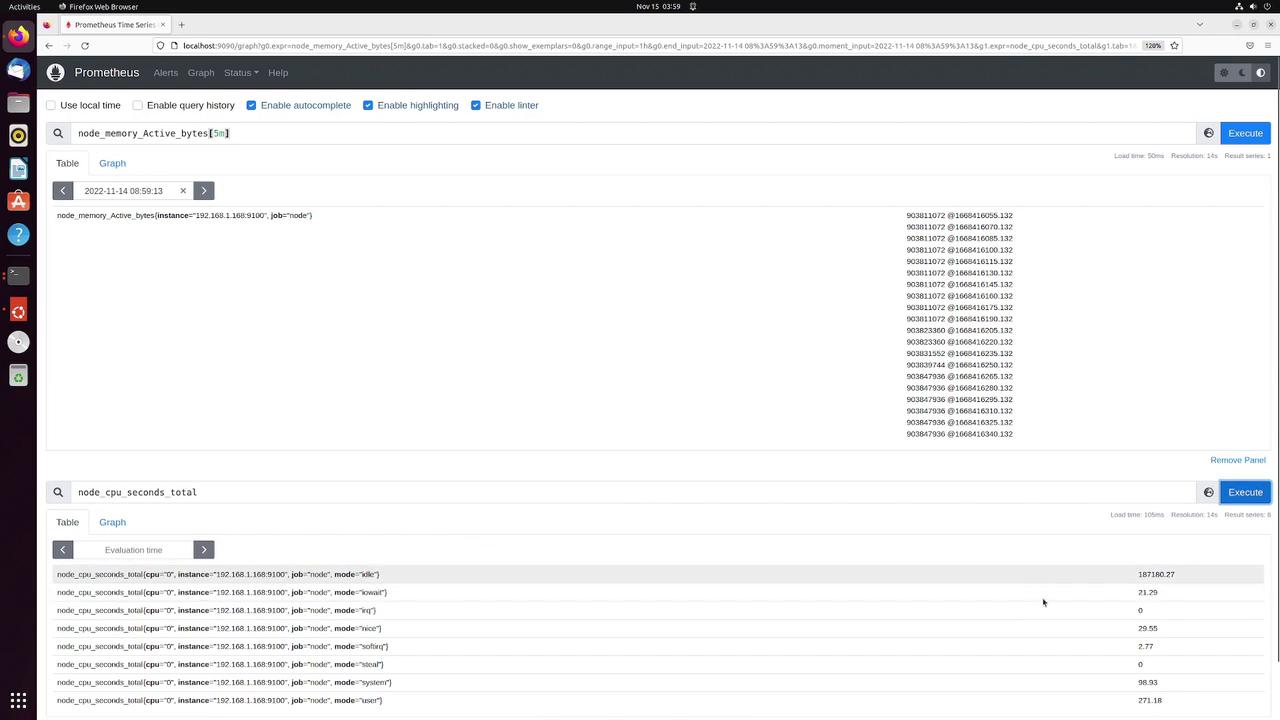
When executed, the Expression Browser displays the corresponding metric along with all its associated labels and the current value. To see historical data, simply select a different evaluation time from the dropdown menu—for example, viewing the metric value from one day ago.For a more detailed analysis over a specific period (such as the past five minutes), adjust the query to retrieve a range vector. The Expression Browser will then display the corresponding time series data.
The Expression Browser also supports multiple panels, enabling side-by-side comparisons of query results. For example, after executing your first query, add another panel and run a query like:
node_cpu_seconds_total
Using multiple panels can help you quickly compare metrics such as memory usage and CPU load for more effective troubleshooting.
This query returns a range vector, but the Graph page is designed to display an instant vector. To resolve this, modify the query or apply a function. A common approach is to use the rate function to calculate the change over time:
rate(node_memory_Active_bytes[5m])
Running the above query depicts the rate of change over a five-minute interval. You can further customize the graph’s time window (for example, 30 minutes or 2 hours) or specify a custom evaluation time via the time picker.The graph page also includes a legend that clearly identifies each series, particularly when graphing multiple series with various labels. For example, graphing:
rate(node_memory_Active_bytes[5m])
will display detailed metric labels in the legend. To further illustrate, consider graphing the CPU rate over a two-minute interval:
rate(node_cpu_seconds_total[2m])
Although this graph may seem less dynamic if the values are steady, the legend will still distinctly represent each node’s CPU metric.
In summary, the Expression Browser is a straightforward and effective tool for executing quick PromQL queries and generating basic graphs. While it may not support advanced dashboarding, it remains an essential resource for rapid troubleshooting and on-demand monitoring.For further details on Prometheus and PromQL, refer to the Prometheus Documentation.