Prometheus Certified Associate (PCA)

PromQL

PromQL Demo

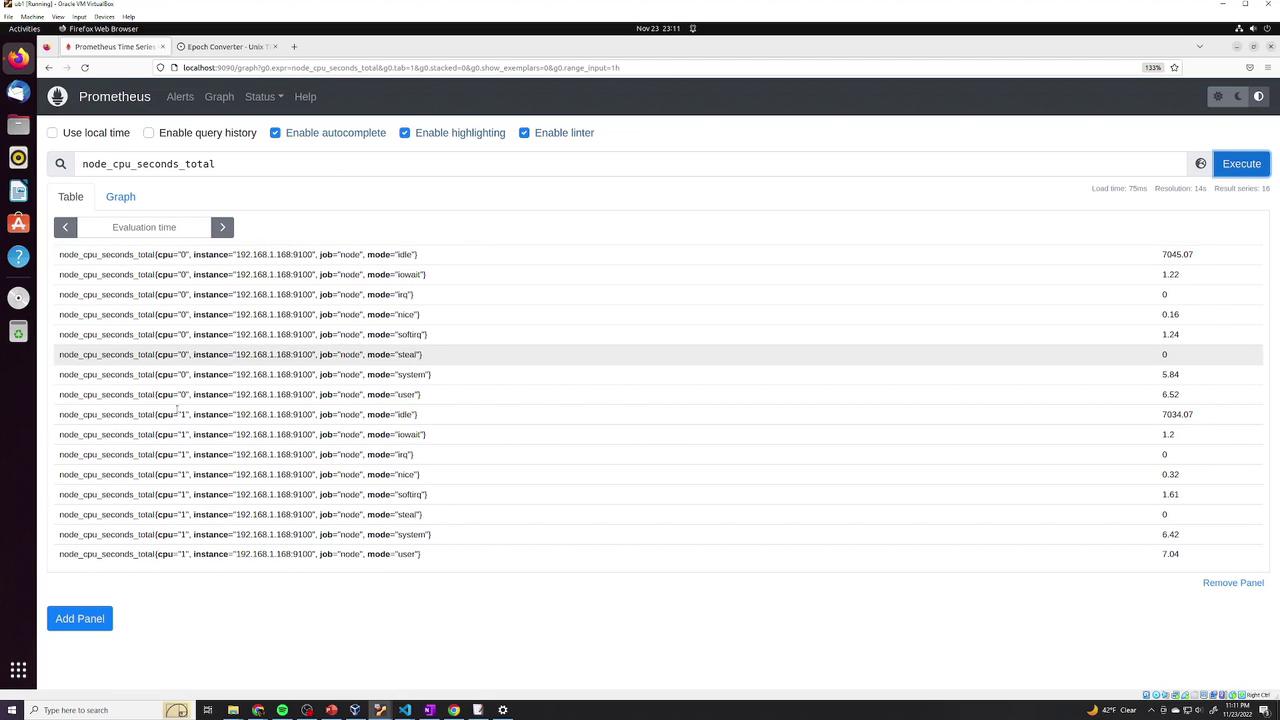
In this lesson, we explore practical examples of using label selectors and modifiers in PromQL. We begin with the metric node_cpu_seconds_total, which provides detailed statistics for each CPU identified by the cpu label (e.g., "0" and "1").

The image shows a Prometheus monitoring dashboard displaying CPU usage metrics for different modes and instances. The data is presented in a table format with columns for CPU, instance, job, mode, and corresponding values.

There are two CPUs displayed, each with various CPU modes. To filter data for a single CPU (e.g., CPU 0), specify the label selector accordingly. Keep in mind that label values must be enclosed in quotations. For example, to retrieve details exclusively for CPU 0, you can use:

node_cpu_seconds_total{cpu="0", instance="192.168.1.168:9100", job="node", mode="idle"}  7060.04
node_cpu_seconds_total{cpu="0", instance="192.168.1.168:9100", job="node", mode="iowait"}  1.2
node_cpu_seconds_total{cpu="0", instance="192.168.1.168:9100", job="node", mode="irq"}  0
node_cpu_seconds_total{cpu="0", instance="192.168.1.168:9100", job="node", mode="nice"}  0.16
node_cpu_seconds_total{cpu="0", instance="192.168.1.168:9100", job="node", mode="softirq"}  1.24
node_cpu_seconds_total{cpu="0", instance="192.168.1.168:9100", job="node", mode="steal"}  0
node_cpu_seconds_total{cpu="0", instance="192.168.1.168:9100", job="node", mode="system"}  5.84
node_cpu_seconds_total{cpu="0", instance="192.168.1.168:9100", job="node", mode="user"}  6.53

To examine data for another CPU (for example, CPU 1) and convert the query into a range vector capturing statistics over the past two minutes, adjust the query as shown below:

node_cpu_seconds_total{cpu="1", instance="192.168.1.168:9100", job="node", mode="idle"} 7078.96
node_cpu_seconds_total{cpu="1", instance="192.168.1.168:9100", job="node", mode="iowait"} 1.2
node_cpu_seconds_total{cpu="1", instance="192.168.1.168:9100", job="node", mode="irq"} 0
node_cpu_seconds_total{cpu="1", instance="192.168.1.168:9100", job="node", mode="nice"} 0.32
node_cpu_seconds_total{cpu="1", instance="192.168.1.168:9100", job="node", mode="softirq"} 1.62
node_cpu_seconds_total{cpu="1", instance="192.168.1.168:9100", job="node", mode="steal"} 0
node_cpu_seconds_total{cpu="1", instance="192.168.1.168:9100", job="node", mode="system"} 6.44
node_cpu_seconds_total{cpu="1", instance="192.168.1.168:9100", job="node", mode="user"} 7.05

To narrow down your data further—such as retrieving metrics for CPU 0 with the mode "idle"—you can combine label selectors by separating them with commas:

node_cpu_seconds_total{cpu="0", instance="192.168.1.168:9100", job="node", mode="idle"}

Exploring Filesystem Metrics

Next, we analyze the node_filesystem_files metric, which displays different filesystems and their mount points on an instance. For example, you might see information for mount points starting with /boot, /, and /run. Consider the following sample output:

node_filesystem_files{device="/dev/sda2", fstype="vfat", instance="192.168.1.168:9100", job="node", mountpoint="/boot/efi"} 0
node_filesystem_files{device="/dev/sda3", fstype="ext4", instance="192.168.1.168:9100", job="node", mountpoint="/"} 830588
node_filesystem_files{device="/dev/sda4", fstype="ext4", instance="192.168.1.168:9100", job="node", mountpoint="/var/snap/firefox/common/host-hunspell"} 830588
node_filesystem_files{device="tmpfs", fstype="tmpfs", instance="192.168.1.168:9100", job="node", mountpoint="/run"} 888580
node_filesystem_files{device="tmpfs", fstype="tmpfs", instance="192.168.1.168:9100", job="node", mountpoint="/run/lock"} 888580
node_filesystem_files{device="tmpfs", fstype="tmpfs", instance="192.168.1.168:9100", job="node", mountpoint="/run/snapd/ns"} 888580
node_filesystem_files{device="tmpfs", fstype="tmpfs", instance="192.168.1.168:9100", job="node", mountpoint="/run/user/127"} 177716

If you are interested in mount points that begin with /run and want to exclude others (for example, /boot/efi), you can use a regular expression in your label selector. To match any mount point starting with /run, use =~ with the pattern /run.*:

node_filesystem_files{mountpoint=~"/run.*"}[5m]

Conversely, to match all mount points that do not start with /run, use the not-equal regular expression operator:

node_filesystem_files{mountpoint!~"/run.*"}[5m]

The query above collects five minutes of data from filesystems whose mount points do not match the /run.* pattern.

Using Range Vectors with Offset

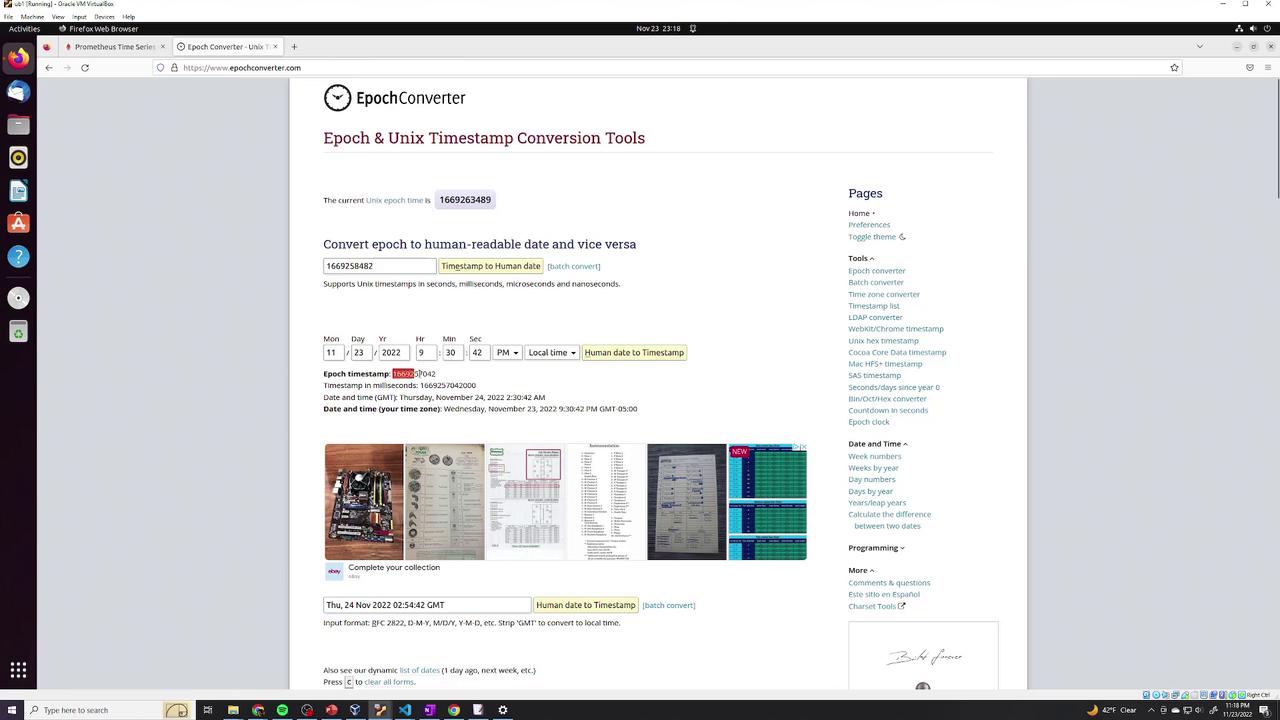
To review historical data, you can append an offset modifier. For example, to retrieve five minutes of data starting one hour ago, add offset 1h:

An example using an offset is:

node_filesystem_files{mountpoint=~"/run.*"}[5m] offset 1h

If you need data from a very specific moment, PromQL supports the at modifier by appending an @ symbol followed by a Unix timestamp. For instance:

node_filesystem_files{mountpoint=~"/run.*"}[5m] @1669257042

A helpful tip is to use an epoch-to-Unix timestamp conversion tool when specifying exact moments.

The image shows a webpage from EpochConverter, a tool for converting Unix timestamps to human-readable dates and vice versa. The page includes input fields for date conversion and displays the current Unix epoch time.

When employing visualization tools like Grafana, manual timestamp handling is often unnecessary as they manage time calculations automatically. However, for raw PromQL queries, specifying the precise timestamp using the at modifier can be essential.

Below is an example that combines the at modifier with filesystem queries:

node_filesystem_files{mountpoint=~"/run.*"}[5m] @1669257042
node_filesystem_files{device="/dev/sda2", fstype="vfat", instance="192.168.1.168:9100", job="node", mountpoint="/boot/efi"}
node_filesystem_files{device="/dev/sda3", fstype="ext4", instance="192.168.1.168:9100", job="node", mountpoint="/"}

This lesson has covered the use of label selectors, regular expressions, range vectors, offsets, and the at modifier within PromQL. These techniques enable precise and flexible querying of your metrics for better monitoring and analysis.

For further reading, check out the Prometheus Documentation and PromQL Query Language for additional insights.

Watch Video

Watch video content

Practice Lab

Practice lab

Previous
Modifiers