Prometheus Certified Associate (PCA)

PromQL

Modifiers

When working with Prometheus metrics, you often retrieve the latest value, such as with the query below, which returns the current metric observation:

node_memory_Active_bytes{instance="node1"}

However, there are many situations where you might need to analyze historical data. For instance, you might want to review metrics from 5 or 10 minutes ago—or even several days in the past—to investigate incidents, like an outage that occurred outside of regular business hours.

[!NOTE] Tip
To retrieve historical metrics, leverage the offset modifier.

Using the Offset Modifier

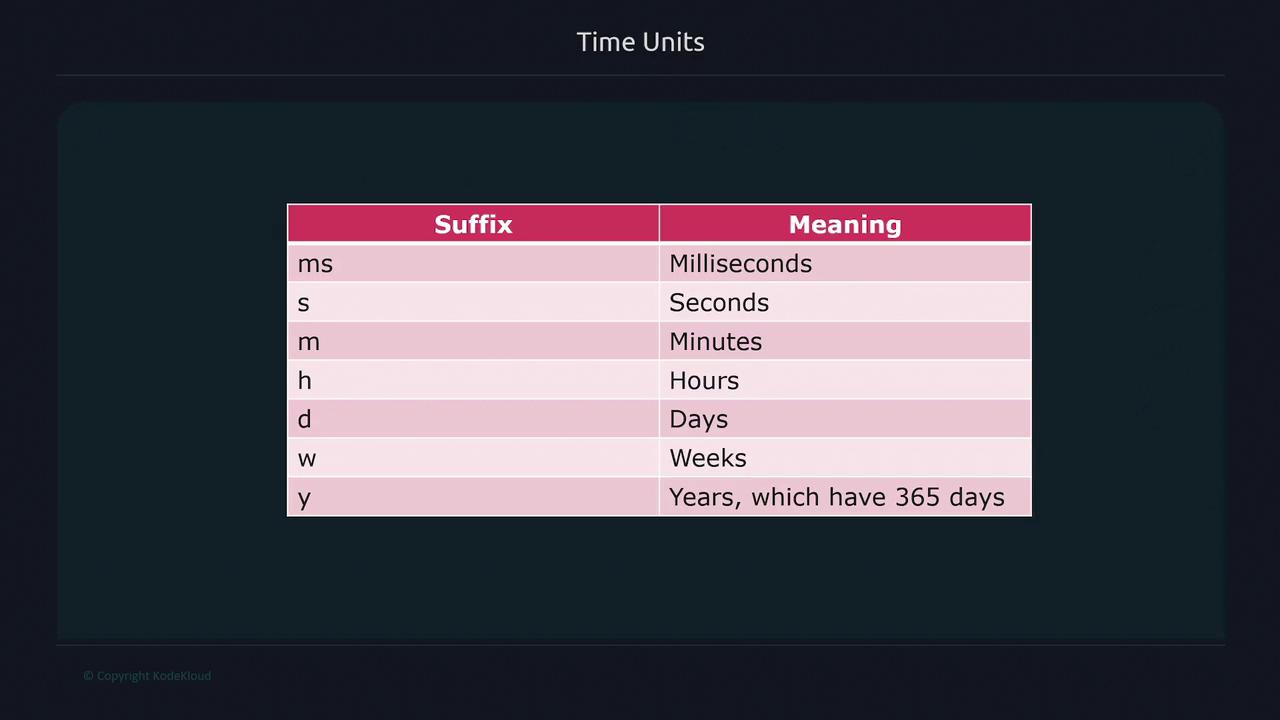
The offset modifier lets you query metric values from a specific duration ago. For example, to fetch the metric value from 5 minutes in the past, you add the offset keyword:

node_memory_Active_bytes{instance="node1"} offset 5m

This query returns the metric value as it was 5 minutes before the current time.

Prometheus supports a variety of time units with the following suffixes:

  • ms for milliseconds
  • s for seconds
  • m for minutes
  • h for hours
  • D for days
  • W for weeks
  • Y for years

The image below offers a comprehensive table of all available time unit suffixes and their meanings:

The image is a table listing time units with their suffixes and meanings, including milliseconds, seconds, minutes, hours, days, weeks, and years.

Additional Examples with Offset

  • Retrieve data from 5 days ago:

    node_memory_Active_bytes{instance="node1"} offset 5d
    
  • Retrieve data from 2 weeks ago:

    node_memory_Active_bytes{instance="node1"} offset 2w
    

For non-standard time intervals, you can combine units. For example, to retrieve data from 1 hour and 30 minutes ago, you can write:

node_memory_Active_bytes{instance="node1"} offset 1h30m

Assuming these queries produce outputs similar to the following:

node_memory_Active_bytes{instance="node1"} offset 5d
22259302

node_memory_Active_bytes{instance="node1"} offset 2w
44823311

Querying by Specific Timestamps Using the at Modifier

In cases where you need the metric value at an exact moment, the at modifier comes in handy. It accepts a Unix timestamp. For instance, to query the metric value at Unix timestamp 1663265188 (which represents September 15th at 6:06 PM):

node_memory_Active_bytes{instance="node1"} @1663265188

This query returns:

22259302

You can also combine the at and offset modifiers. For example, to retrieve the metric value 5 minutes before the specified timestamp:

node_memory_Active_bytes{instance="node1"} @1663265188 offset 5m

This returns the metric value corresponding to 6:01 PM instead of 6:06 PM. Note that the order of the modifiers does not affect the query result; both of the following are equivalent:

node_memory_Active_bytes{instance="node1"} @1663265188 offset 5m
node_memory_Active_bytes{instance="node1"} offset 5m @1663265188

Modifiers with Range Vector Queries

You can also apply the at and offset modifiers to range vector queries. For example, if you need to retrieve two minutes' worth of data starting from a specific point in time, with an additional offset of 10 minutes:

node_memory_Active_bytes{instance="node1"}[2m] @1663265188 offset 10m

This query might return output similar to:

2217328640 @1663264476.952
2217328640 @1663264491.952
2217328640 @1663264506.952
2217328640 @1663264521.952
2217328640 @1663264536.952
2217328640 @1663264551.952
2217328640 @1663264581.952

Each line indicates the metric value at a different timestamp during the two-minute interval.

Key Takeaways

The offset and at modifiers in Prometheus offer powerful capabilities for drilling down into historical metric data. Whether you are troubleshooting system issues or performing detailed analyses, these modifiers help you access data from specific past moments or intervals.

For more detailed explanations and advanced queries in Prometheus, be sure to check out additional documentation and guides on our website.

Watch Video

Watch video content

Previous
Selectors Matchers