Learn to navigate and use the Expression Browser for querying and visualizing metrics data from your Prometheus server effectively.
In this lesson, you’ll learn how to navigate and utilize the Expression Browser—a handy web interface for your Prometheus server that allows you to query and visualize metrics data effectively.
Begin by opening your web browser and entering the IP address of your Prometheus server. For example, if your Prometheus server is running locally on the default port 9090, simply navigate to:http://localhost:9090Once loaded, you’ll see the Expression Browser interface. The primary component is the expression input field where you can type in your Prometheus queries.
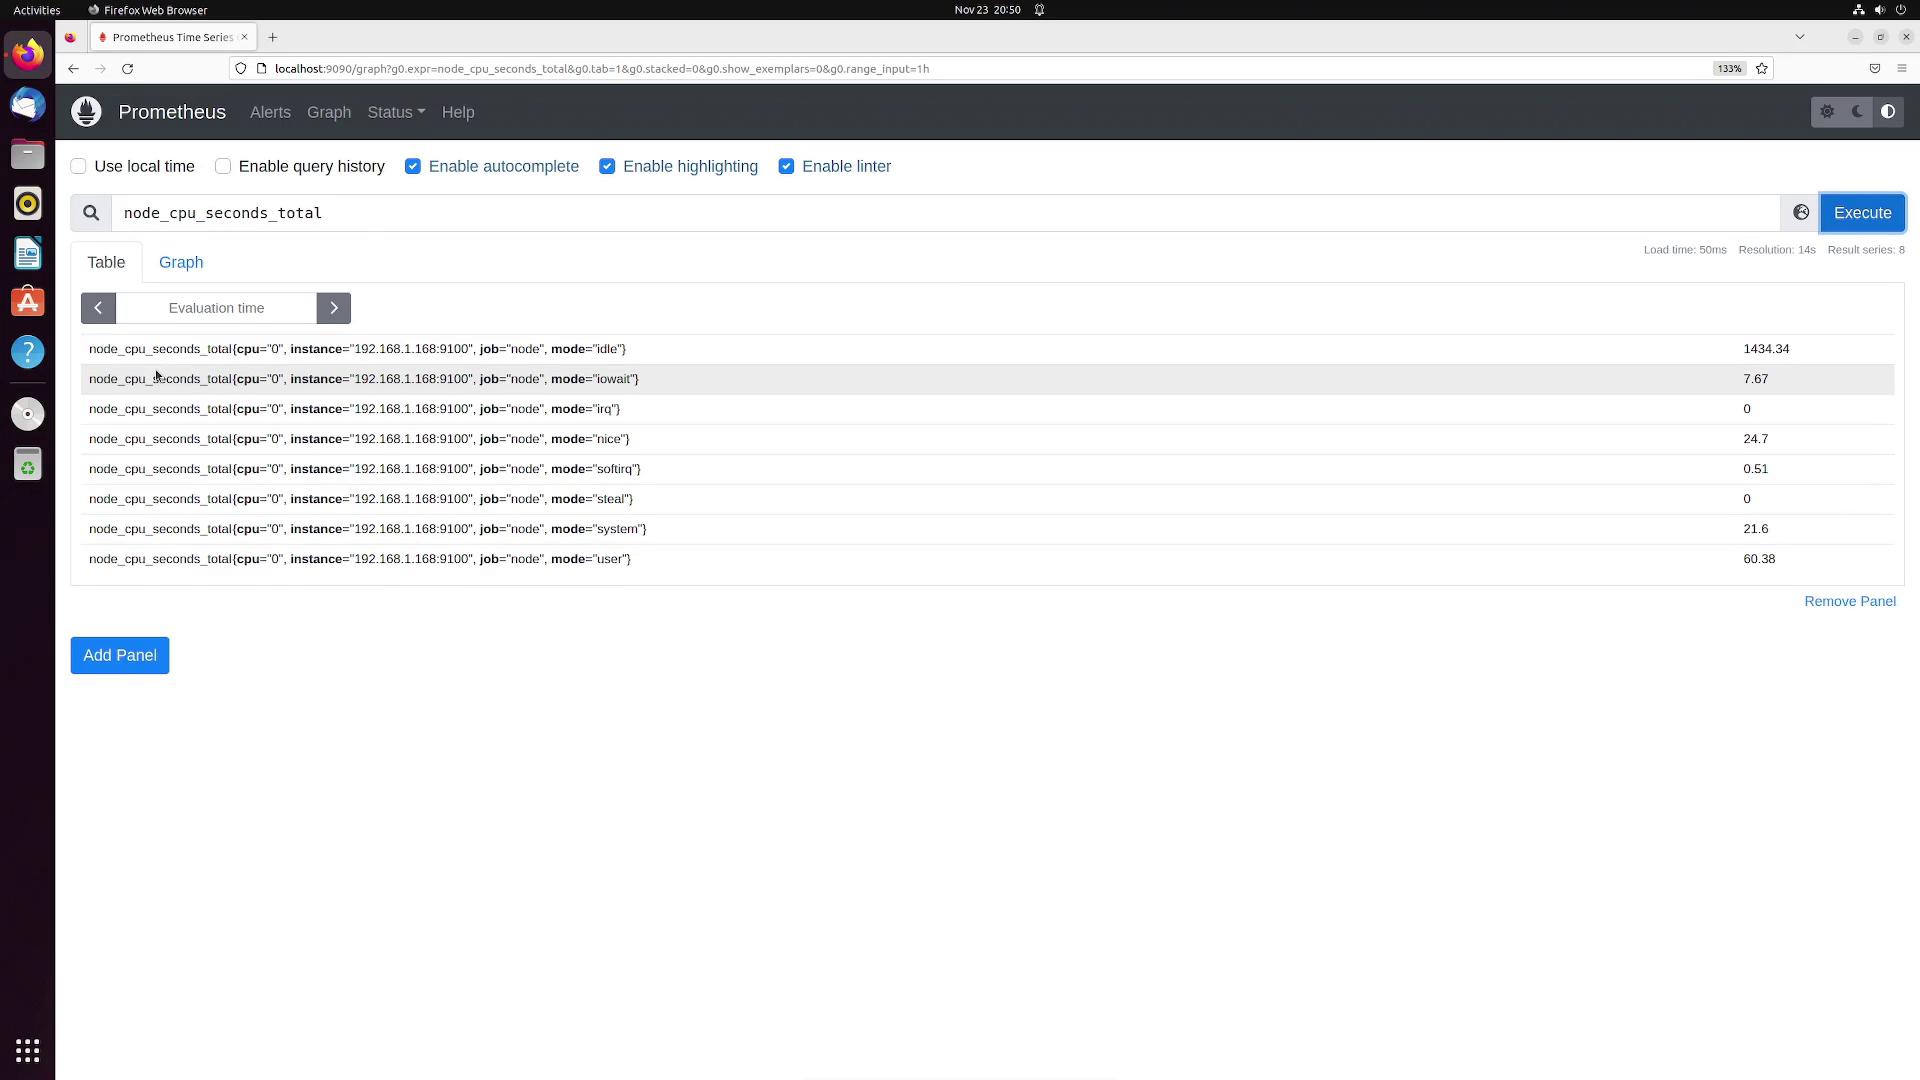
You can also query for more advanced metrics such as node_cpu_seconds_total to monitor CPU usage. Running this query returns a series of values grouped by different CPU modes:
This table details the different CPU modes tracked by Prometheus along with their current values. Additionally, the Expression Browser provides an evaluation time option that lets you view historical data by selecting a specific date and time.
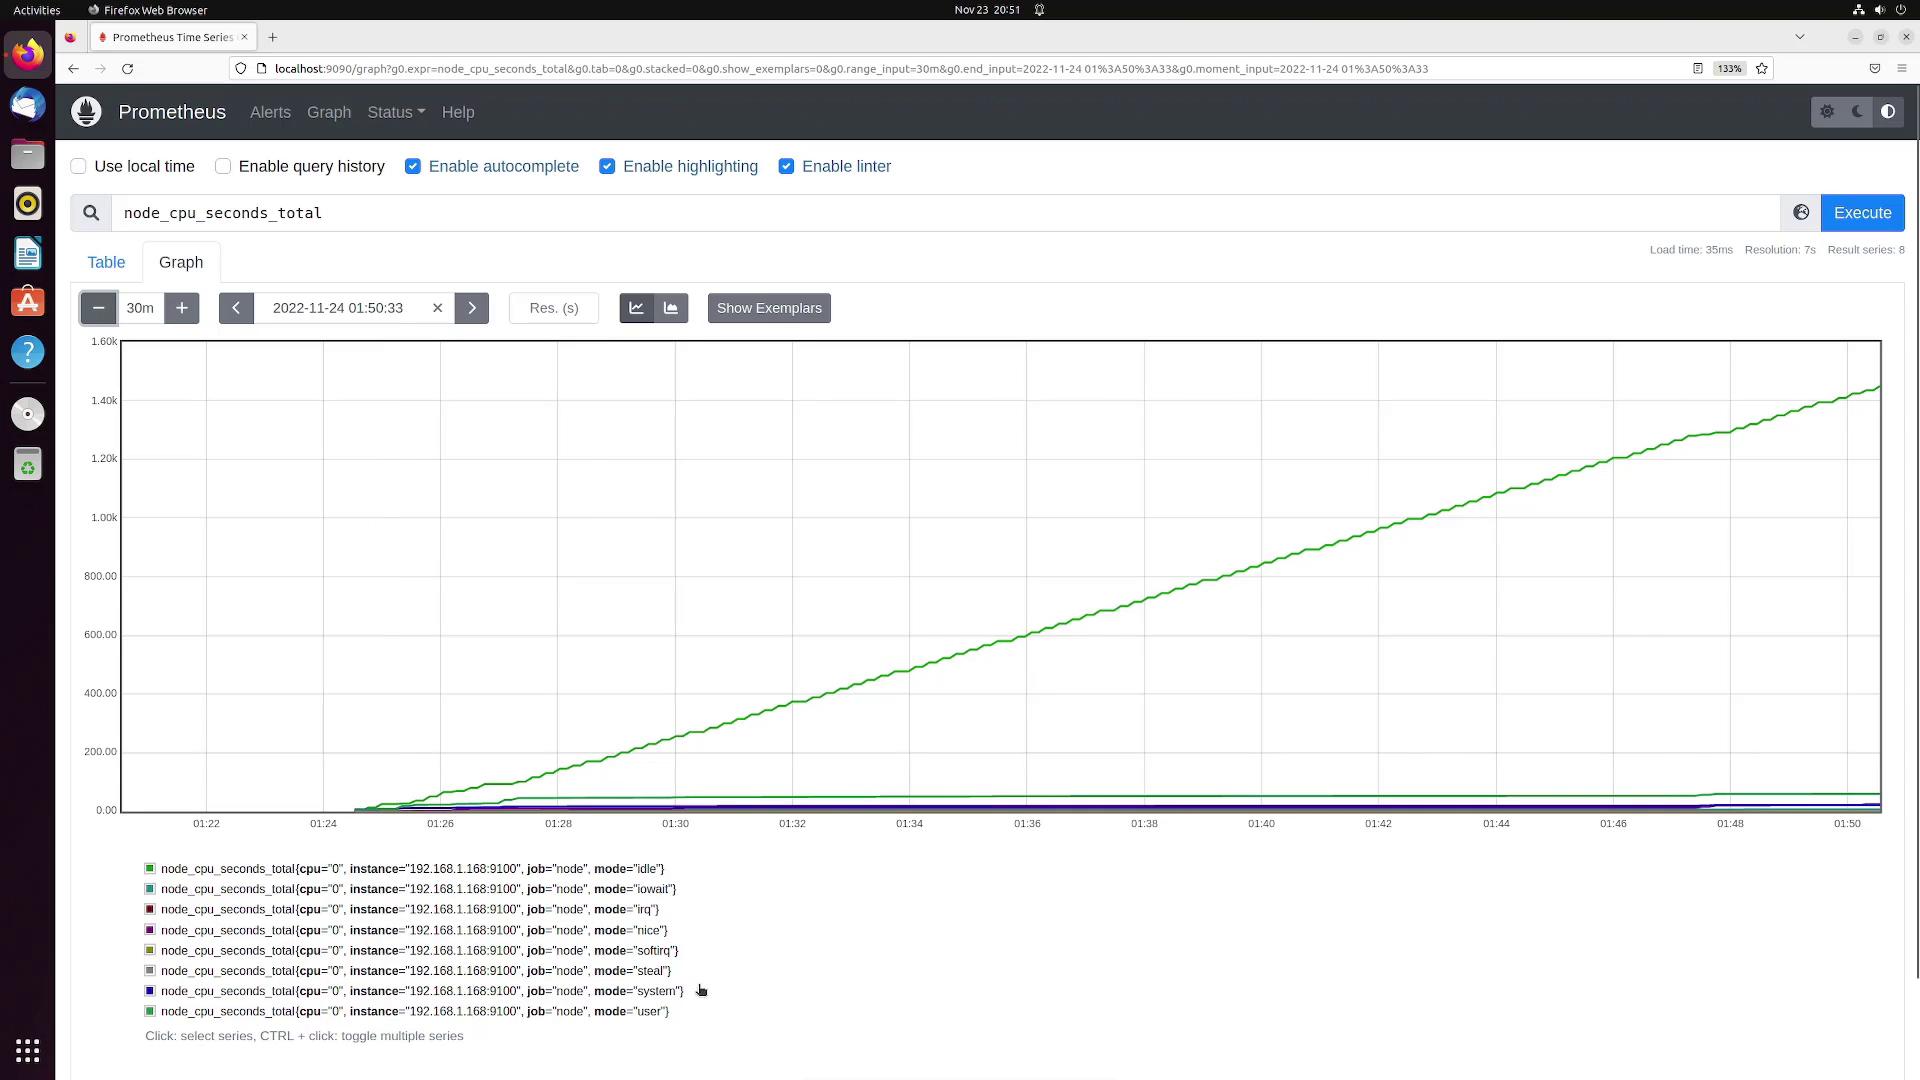
The Expression Browser also offers a graphing feature to help you visualize your monitoring data. By entering a metric and adjusting chart parameters—such as the desired time range (for example, switching from a one-hour view to a 30-minute view)—you can observe the plotted trends for various timeseries. Even if some metrics have very low values, they will still be displayed on the graph.
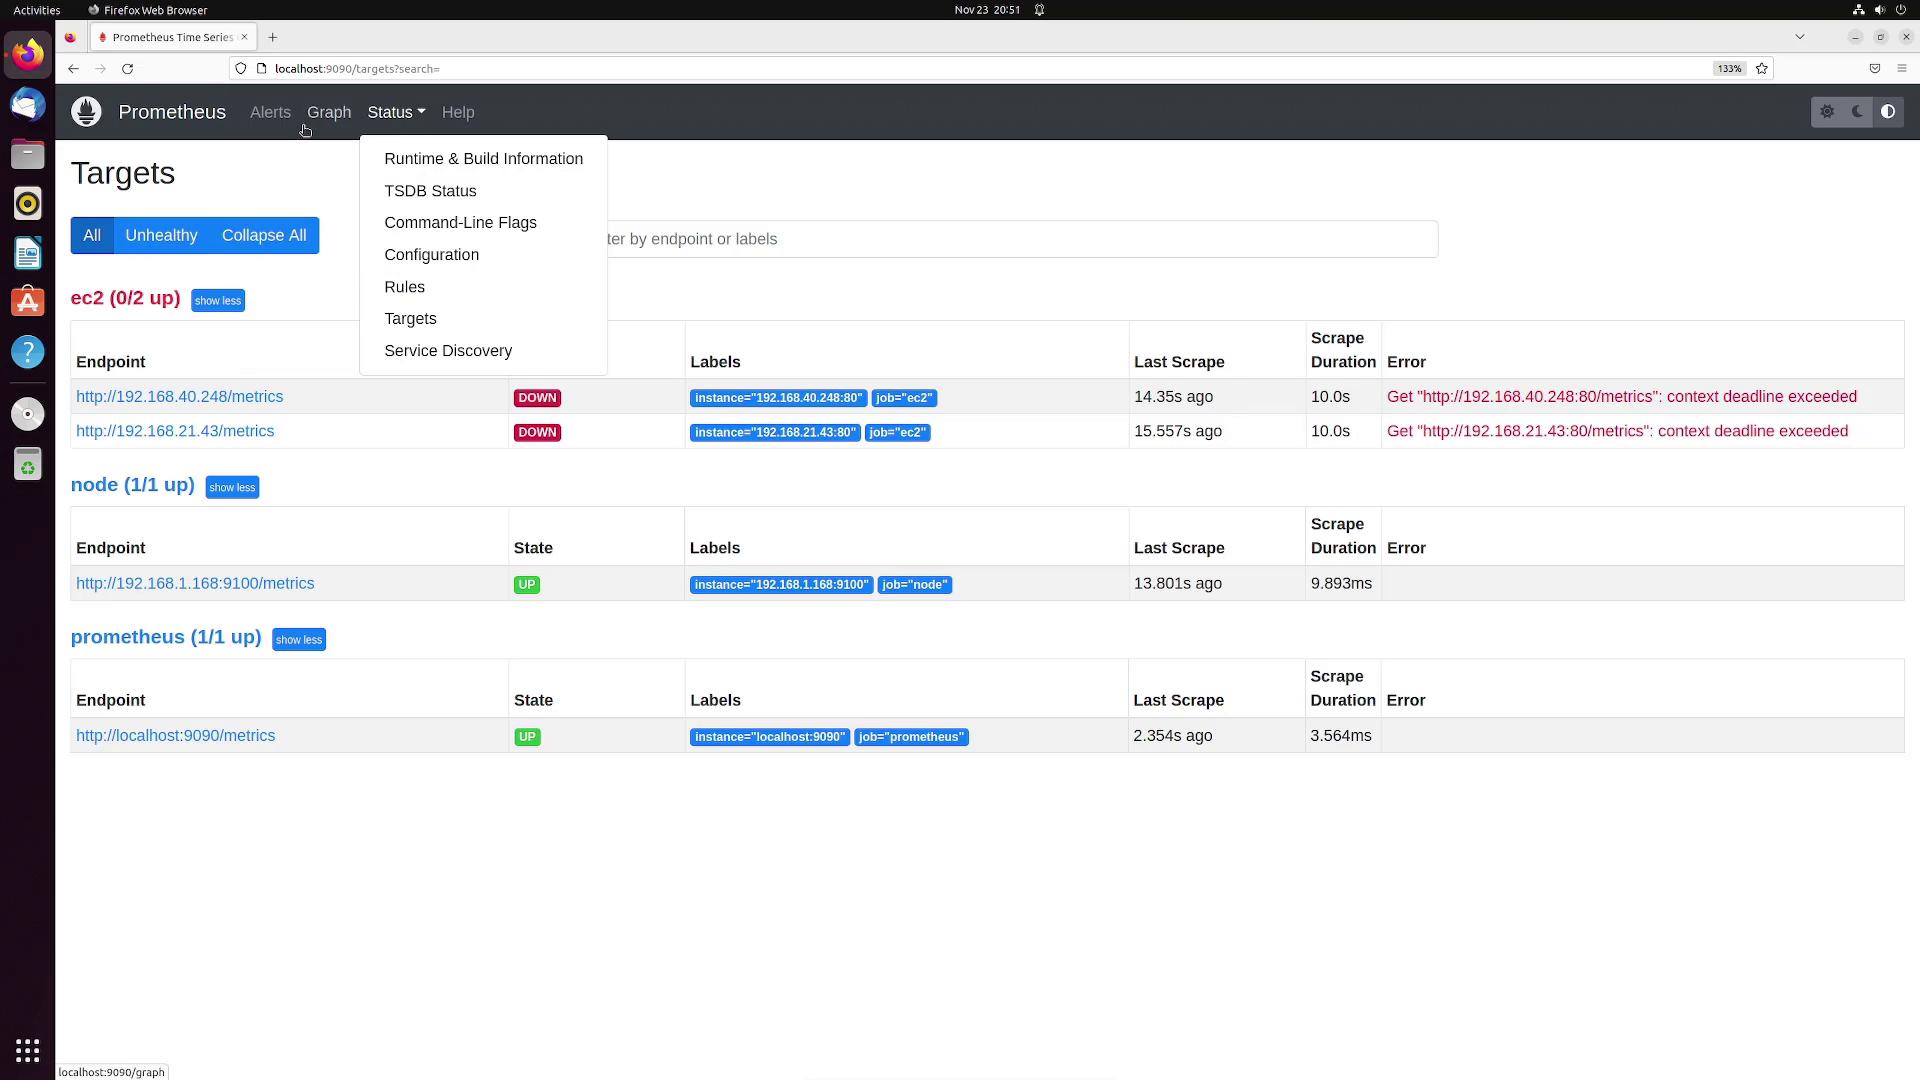
Another valuable feature of the Expression Browser is the ability to inspect your Prometheus server’s configuration. By selecting the configuration option, you can view global parameters, alerting configurations, scrape configurations, and more. For example, your current configuration might resemble the following:
The configuration file lists all the target endpoints along with their statuses (up or down). You also have the option to view the alert rules and navigate to the alerts page for a list of active alerts.
For an enhanced monitoring experience, consider integrating Grafana with Prometheus to build custom dashboards with improved visualization and more interactive data exploration features.
The Expression Browser is a powerful tool for executing Prometheus queries and accessing detailed metrics data instantly. Whether you are troubleshooting your environment or performing a quick system check, this tool plays a critical role in your monitoring setup. For more comprehensive dashboards, you can seamlessly integrate tools like Grafana.Happy monitoring!