This article explains how metrics work in Prometheus, detailing their components, types, and the importance of labels and timestamps.
In this article, we delve into how metrics function within Prometheus. A Prometheus metric consists of three essential components: a name, labels, and a value.The metric name is a descriptive identifier that defines what the metric represents. Labels are key-value pairs that add context to the metric, and a metric can have multiple labels. The metric value indicates the observed measurement at a specific point in time.For example, consider the metric “node_cpu_seconds_total” from the Node Exporter. This metric captures the total number of seconds the CPU has spent in different modes. Labels provide further details—such as specifying which CPU core is being referenced and the state of the CPU. In the following example, the metric shows that CPU 0 spent approximately 258,000 seconds in idle mode. In multi-CPU systems, each CPU is identified with its unique label (e.g., “cpu=0”, “cpu=1”, etc.):
Labels make it possible to include detailed information about a metric. In the example above, the “cpu” label identifies the CPU number, while the “mode” label indicates the CPU state (such as idle, iowait, irq, etc.). When Prometheus scrapes a target, it collects metrics accompanied by a Unix timestamp. For instance, the output from a scrape might look as follows:
The Unix timestamp (e.g., 1668215300) represents the number of seconds since January 1, 1970, UTC (the Unix epoch). You can convert this timestamp into a human-readable format using any Unix timestamp converter.
Every metric stored in Prometheus is timestamped to record the exact moment the measurement was taken. This timestamp is vital for constructing time series data in Prometheus.
A time series in Prometheus is a sequence of timestamped values that share the same metric name and identical labels. In essence, any unique combination of a metric name with its labels represents a distinct time series. Consider the following example featuring metrics from two different systems:
Even though there are only two metrics (node_filesystem_files and node_cpu_seconds_total), the four distinct label combinations for each result in eight separate time series. Prometheus scrapes these metric values at fixed intervals (e.g., every 15 or 30 seconds) and assigns a timestamp to every measurement.
Beyond the name, labels, and value, every Prometheus metric includes two additional attributes: help and type. The help attribute describes the metric, while the type attribute indicates the metric’s nature. For example:
Copy
# HELP node_disk_discard_time_seconds_total This is the total number of seconds spent by all discards.# TYPE node_disk_discard_time_seconds_total counternode_disk_discard_time_seconds_total{device="sda"} 0node_disk_discard_time_seconds_total{device="sr0"} 0
Prometheus supports four primary metric types:
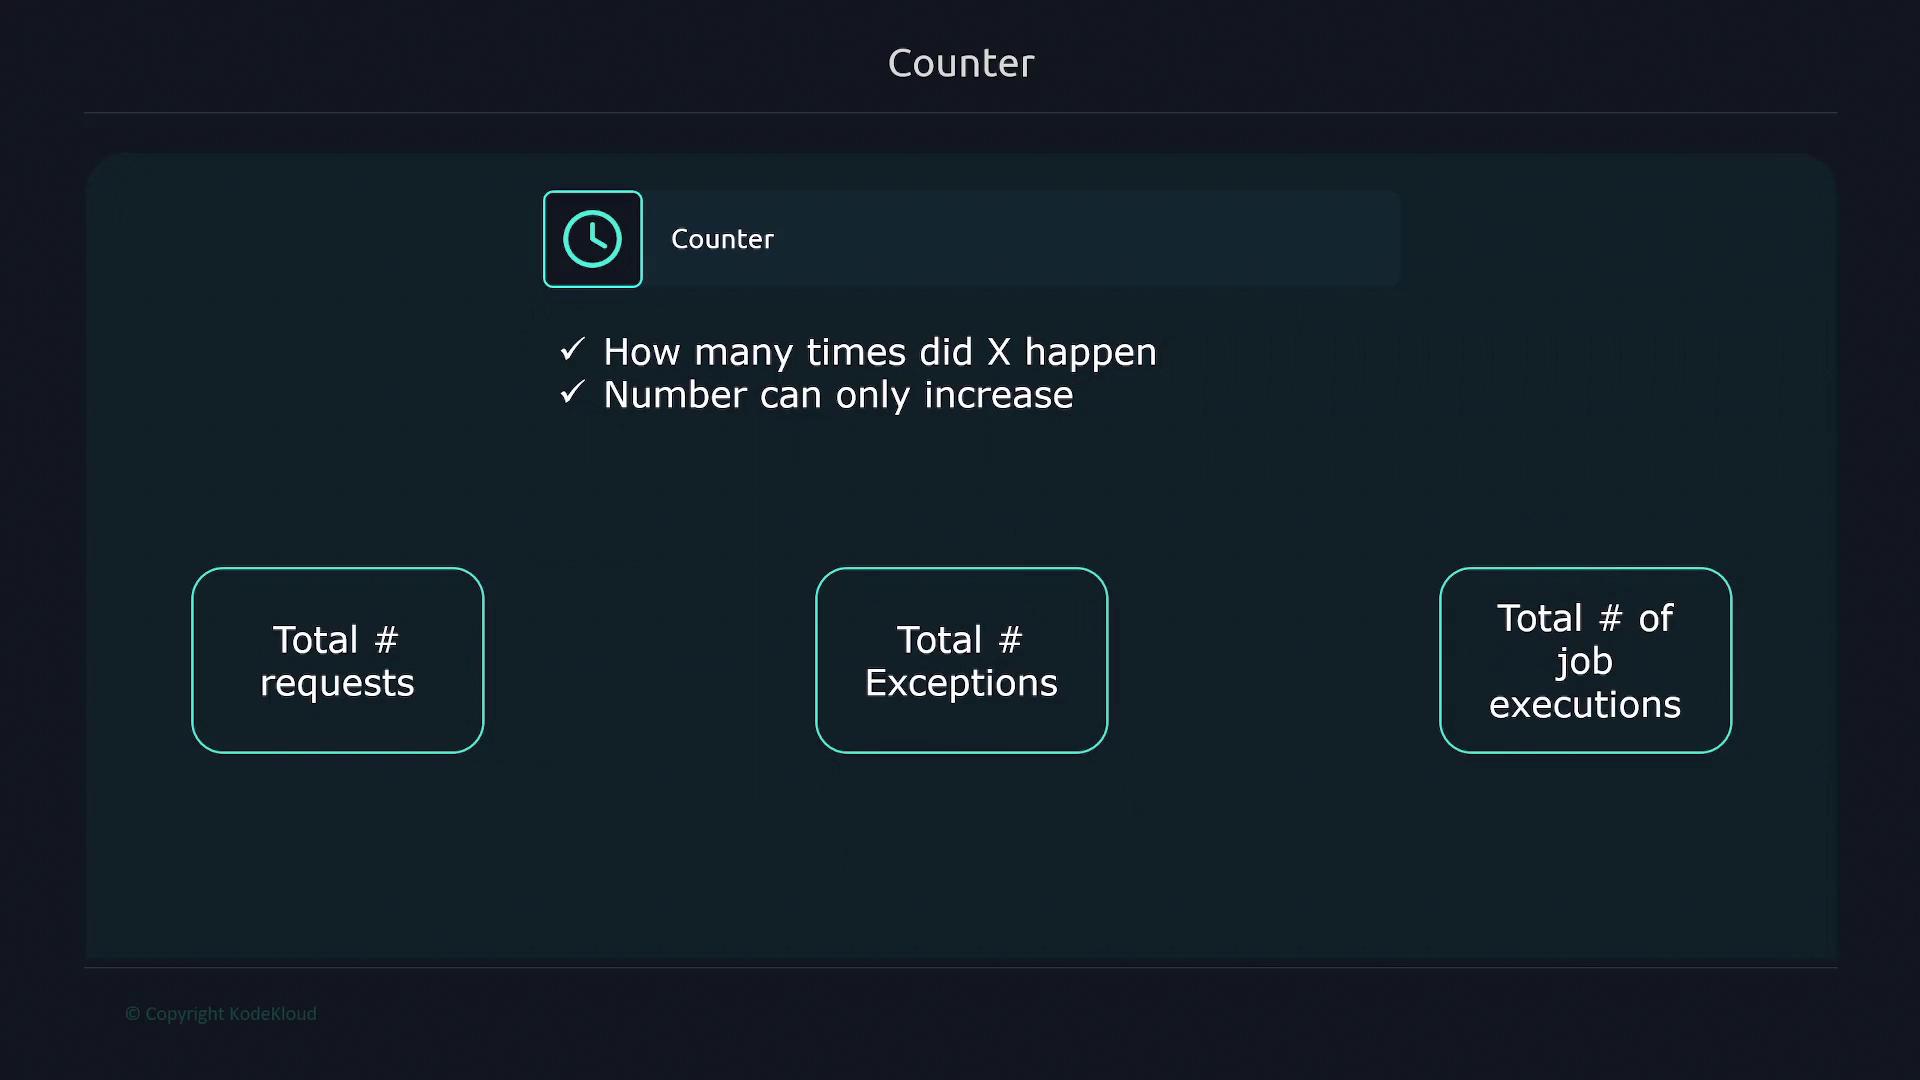
Counter:
A counter metric tracks the number of occurrences of an event and can only increase. It is ideal for monitoring total requests, errors, or other cumulative counts.
Gauge:
A gauge metric represents a value that fluctuates over time, such as current CPU utilization, memory usage, or the number of concurrent requests.
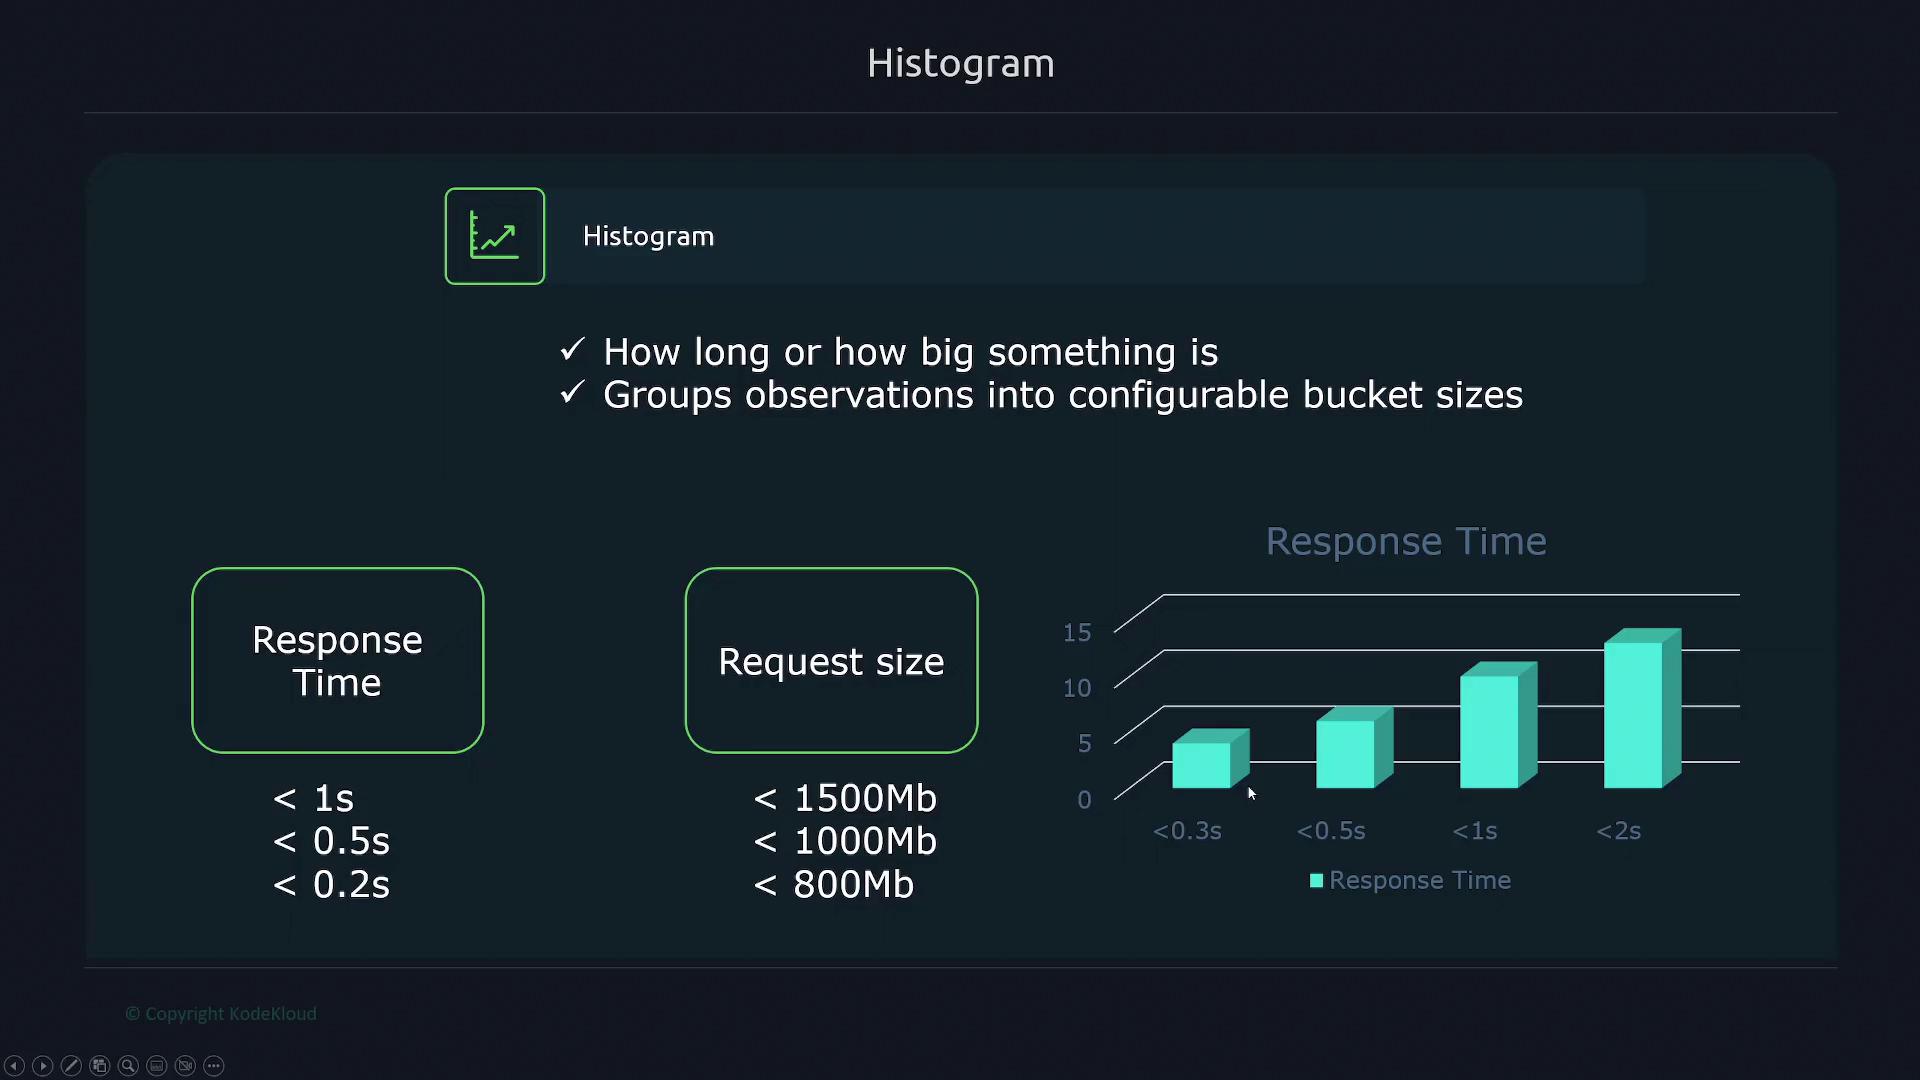
Histogram:
A histogram metric groups observations into configurable buckets, which is useful for tracking durations or sizes. For example, when monitoring application response times, you might set up buckets at 0.2 seconds, 0.5 seconds, and 1 second. The count in each bucket is cumulative, meaning that the bucket for 0.5 seconds includes all values from the 0.2-second bucket as well.
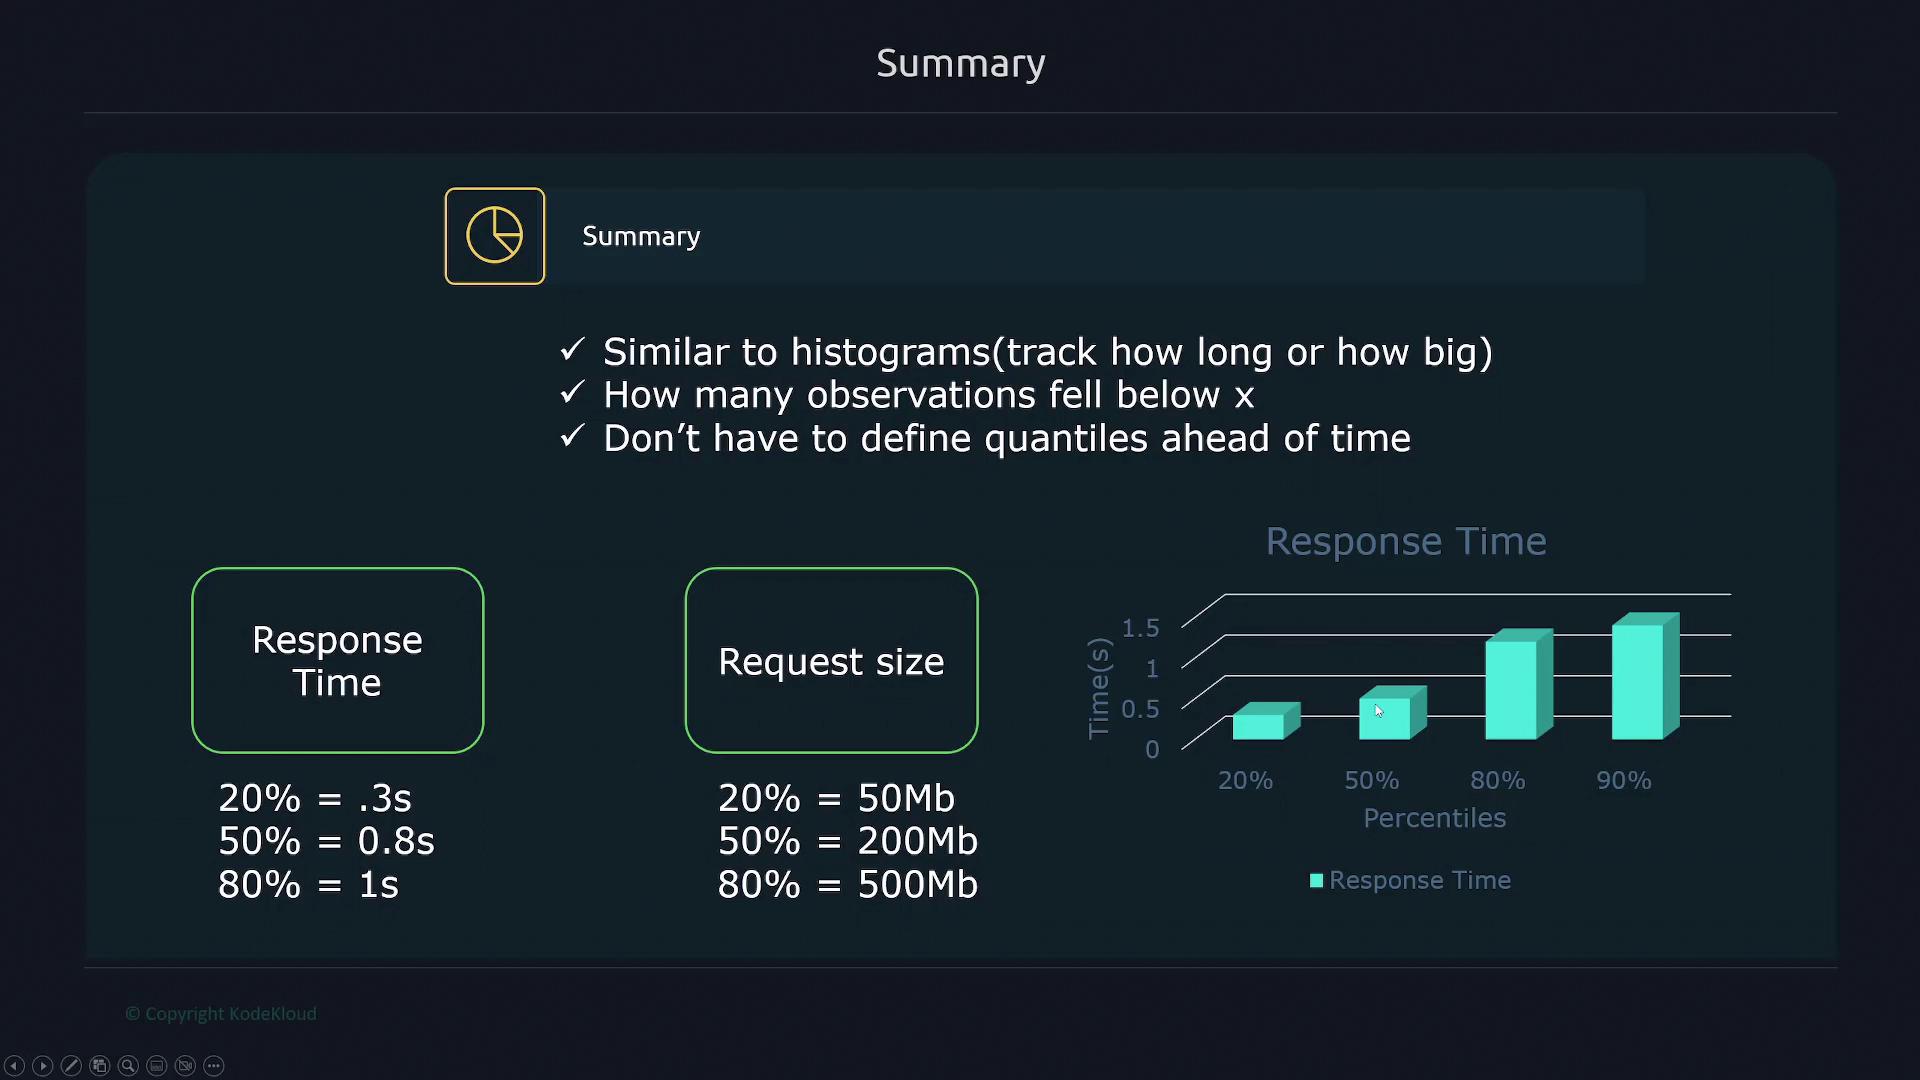
Summary:
A summary metric functions similarly to a histogram by tracking durations or sizes but additionally provides quantile information (e.g., 20%, 50%, 80% percentiles) without the need to predefine buckets. For example, a summary might indicate that 20% of requests finish in under 0.3 seconds, 50% under 0.8 seconds, and 80% under one second.
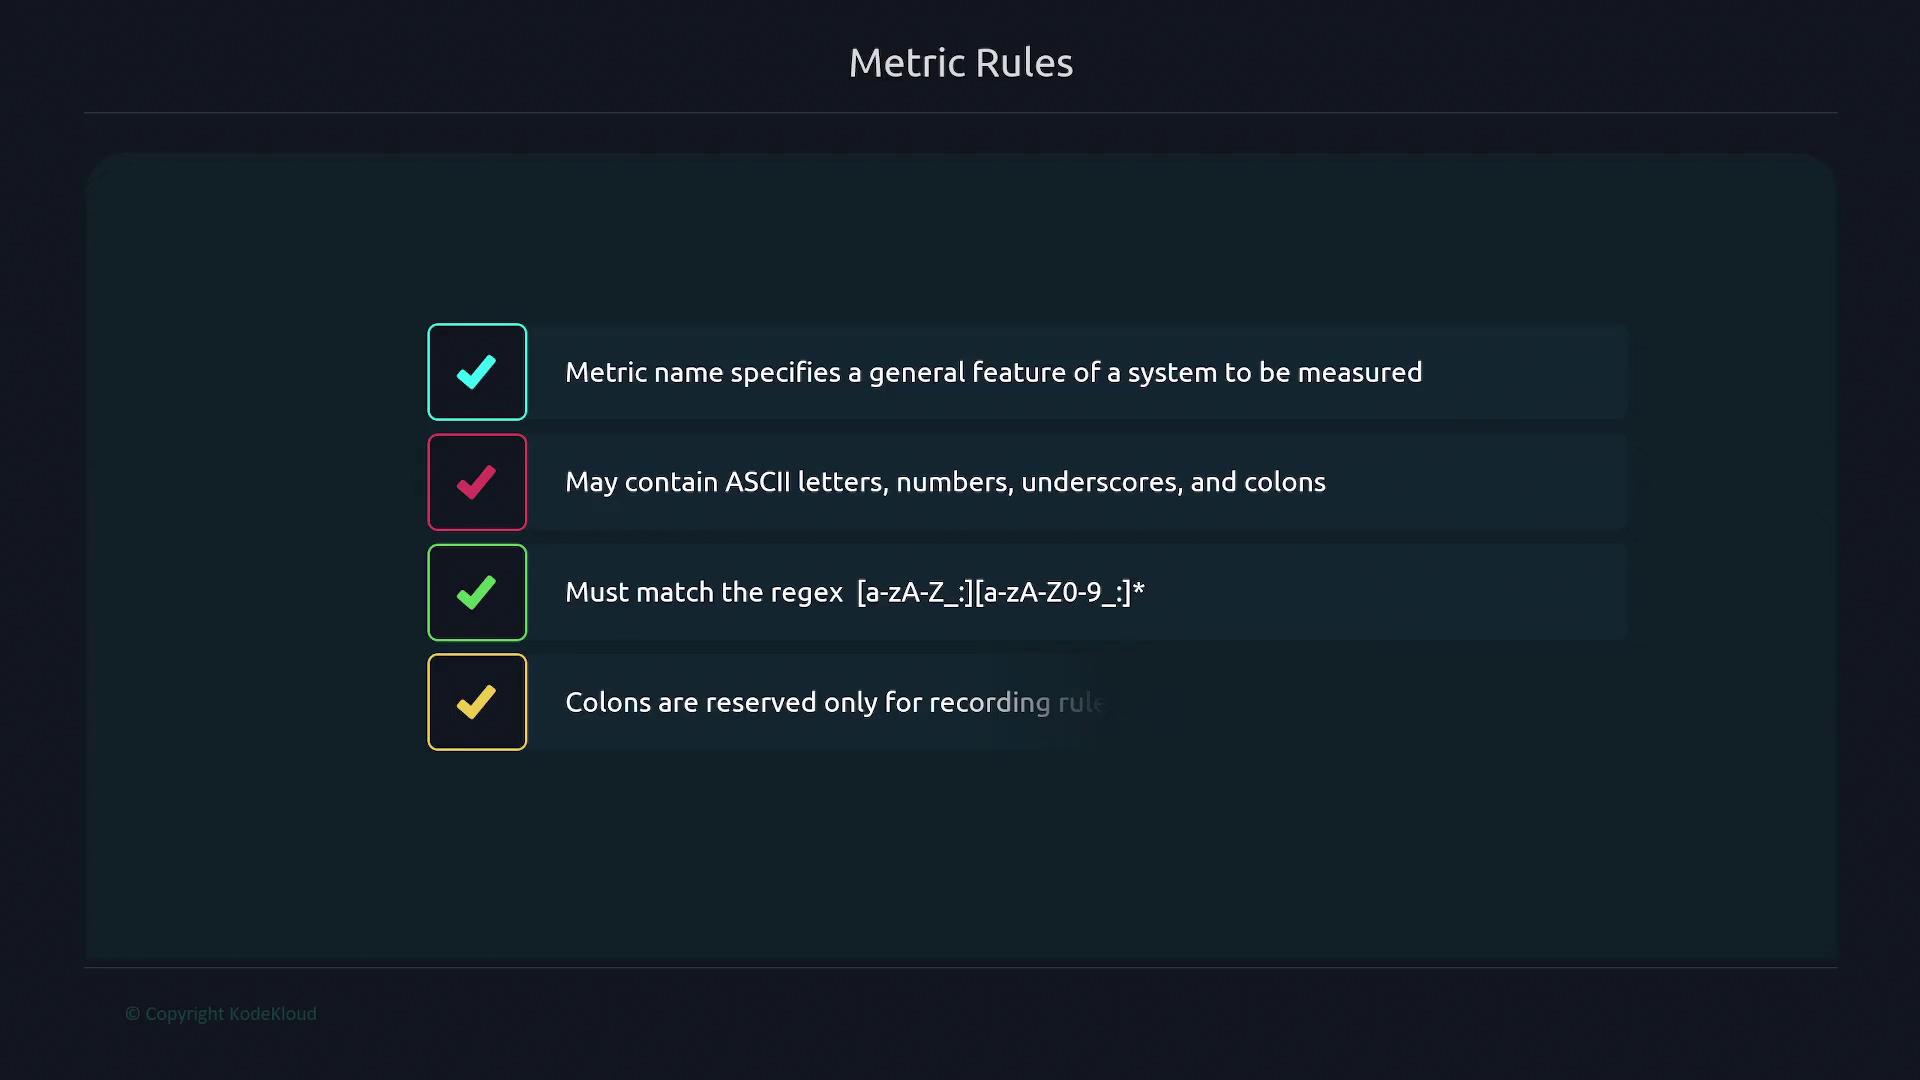
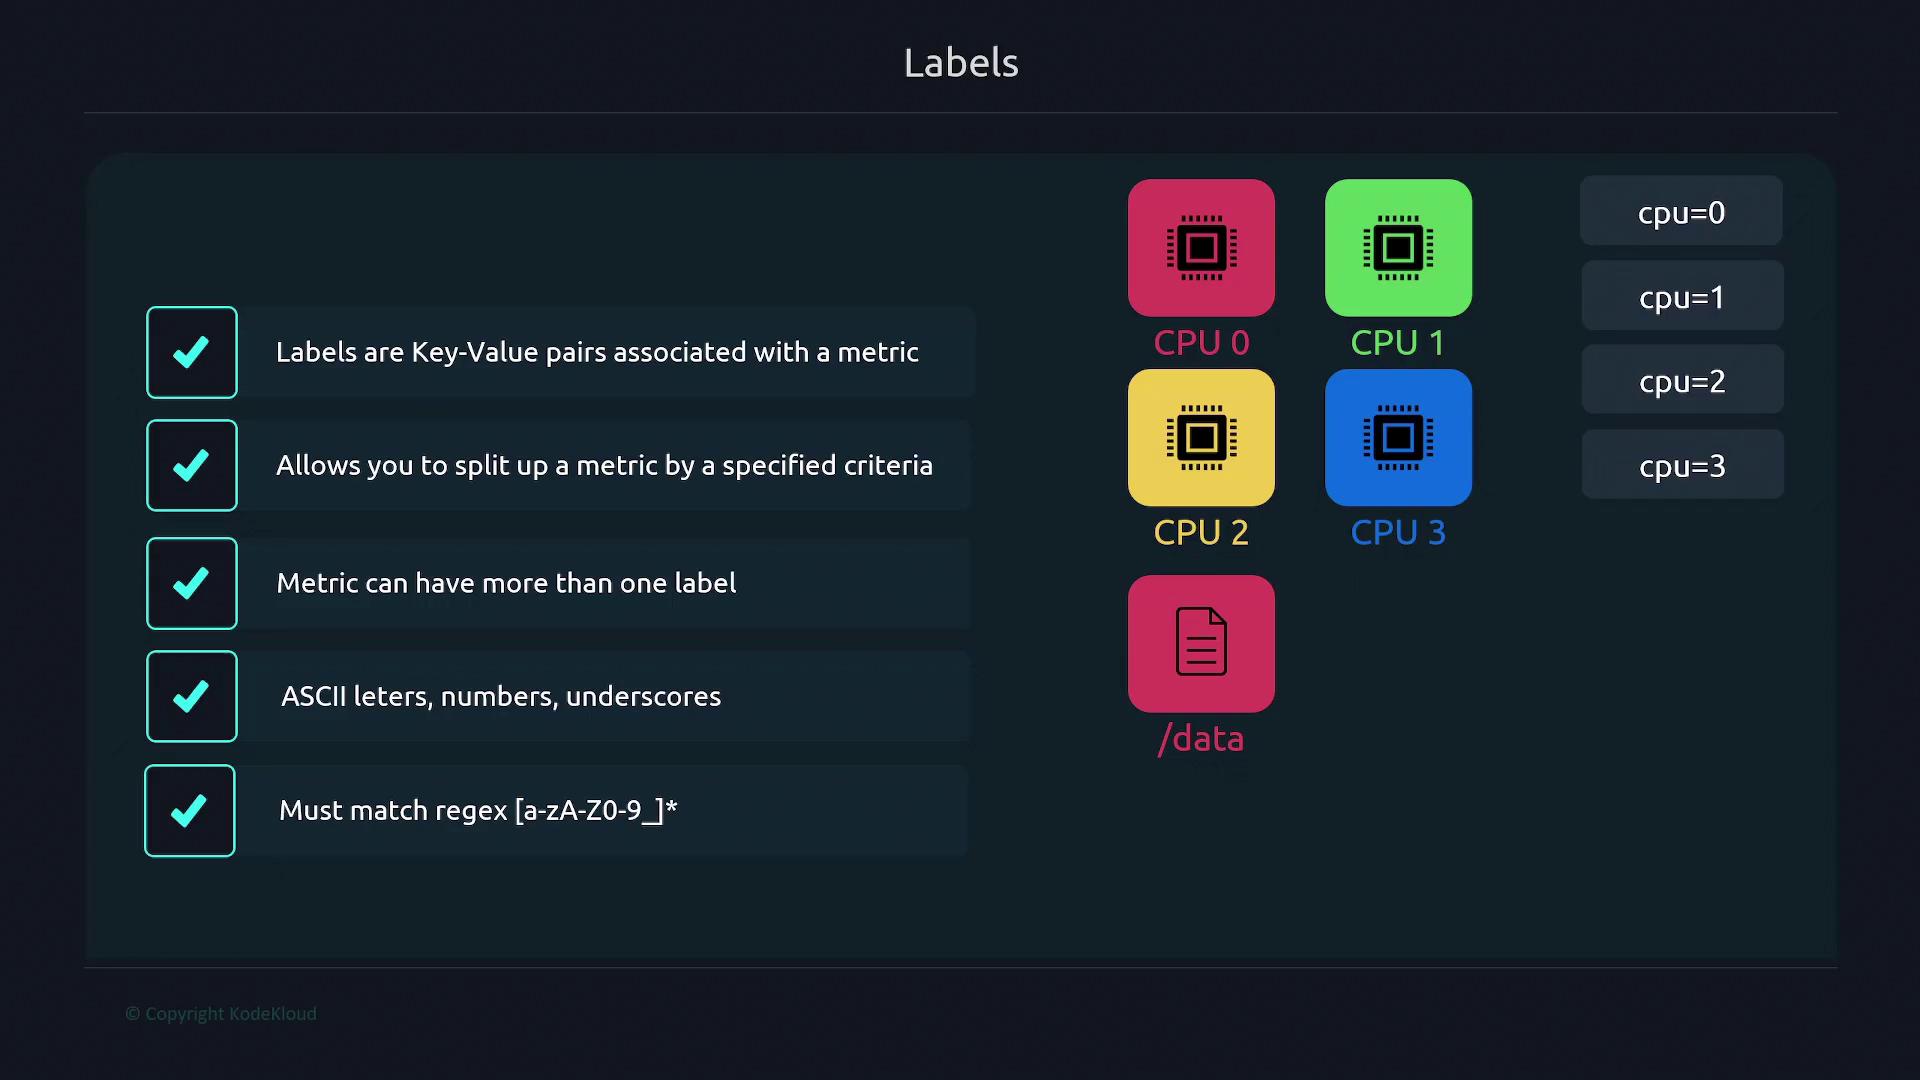
Metric names should clearly indicate the feature or component they represent. They are allowed to contain ASCII letters, numbers, underscores, and colons. However, colons are reserved exclusively for recording rules. Below is an example image that outlines the specifications for metric names:
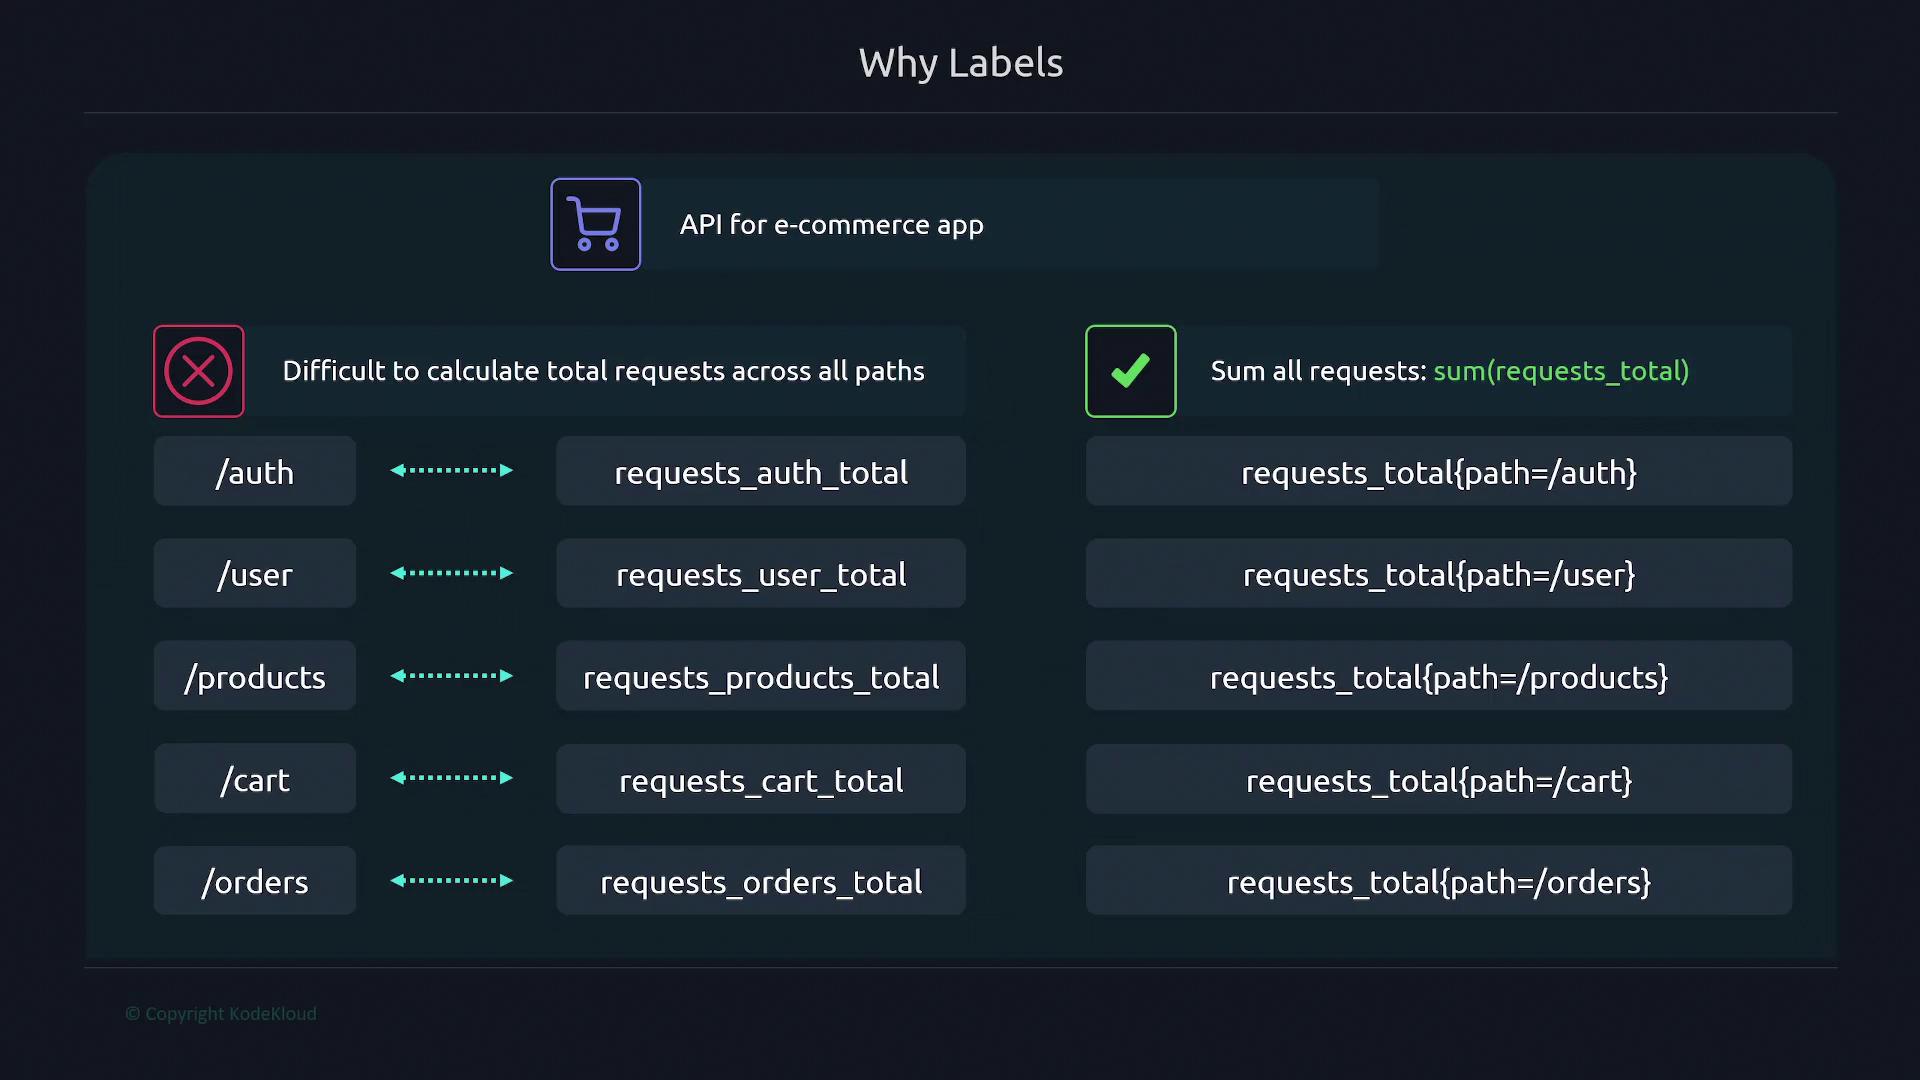
Labels are essential key-value pairs that provide additional categorization for metrics. They enable you to segment metrics based on specific criteria. Label names can include ASCII letters, numbers, and underscores and must match a defined regex pattern. For example, when monitoring CPU metrics, a label such as “cpu” differentiates between CPU cores.A practical application of labels can be seen in API request tracking. Instead of creating separate metrics for each endpoint (e.g., “requests_auth_total” and “requests_user_total”), a single metric “requests_total” can be used with a label called “path” to distinguish between endpoints. When metrics need further differentiation (such as by HTTP methods), an additional label (e.g., “method”) is introduced:
Internally, the metric name (such as “node_cpu_seconds_total”) is stored as a label called “name”. It is worth noting that labels with names enclosed in double underscores (like “name”) are reserved for internal use by Prometheus.By default, each metric is automatically assigned two labels: “instance” and “job”. The “instance” label corresponds to the target defined in your configuration, and the “job” label aligns with the job name provided in your “prometheus.yaml” file. Consider this example configuration snippet:
This configuration ensures that each scraped metric includes the appropriate “instance” and “job” labels.
This labeling approach streamlines monitoring and querying in Prometheus, allowing you to easily aggregate metrics across various endpoints, HTTP methods, and other label dimensions.By understanding and applying these concepts, you can effectively utilize Prometheus for monitoring and gain valuable insights from the collected metrics.