Prometheus Certified Associate (PCA)
Prometheus Fundamentals
Monitoring Containers
In this guide, learn how to collect metrics from containerized environments using Prometheus. Previously, we configured Prometheus to monitor metrics from Linux hosts; now, we extend that functionality by gathering container-specific metrics.
Prometheus can collect these metrics from two main sources:
- Docker Engine metrics
- Container-specific metrics with cAdvisor
Enabling Docker Engine Metrics
Follow these steps on your Docker host to enable Docker Engine metrics:
- Create a file named
daemon.json
in the/etc/docker
directory. - Configure the Docker daemon to expose the metrics endpoint. In this file, specify the metrics adapter, set the IP address and port, and enable experimental features.
- Restart Docker to apply these changes.
- Verify the configuration by curling the metrics endpoint.
The diagram below illustrates how container metrics collection using cAdvisor and Docker allows you to scrape metrics both from the containerized environment and the Docker Engine:
Below is an example configuration and the corresponding commands:
$ vi /etc/docker/daemon.json
$ sudo systemctl restart docker
$ curl localhost:9323/metrics
{
"metrics-addr": "127.0.0.1:9323",
"experimental": true
}
After restarting Docker, the metrics will be available on the configured port.
Next, update your Prometheus configuration by adding a new scrape job for Docker metrics:
scrape_configs:
- job_name: "docker"
static_configs:
- targets: ["12.1.13.4:9323"]
Replace "12.1.13.4" with the actual IP address of your Docker host.
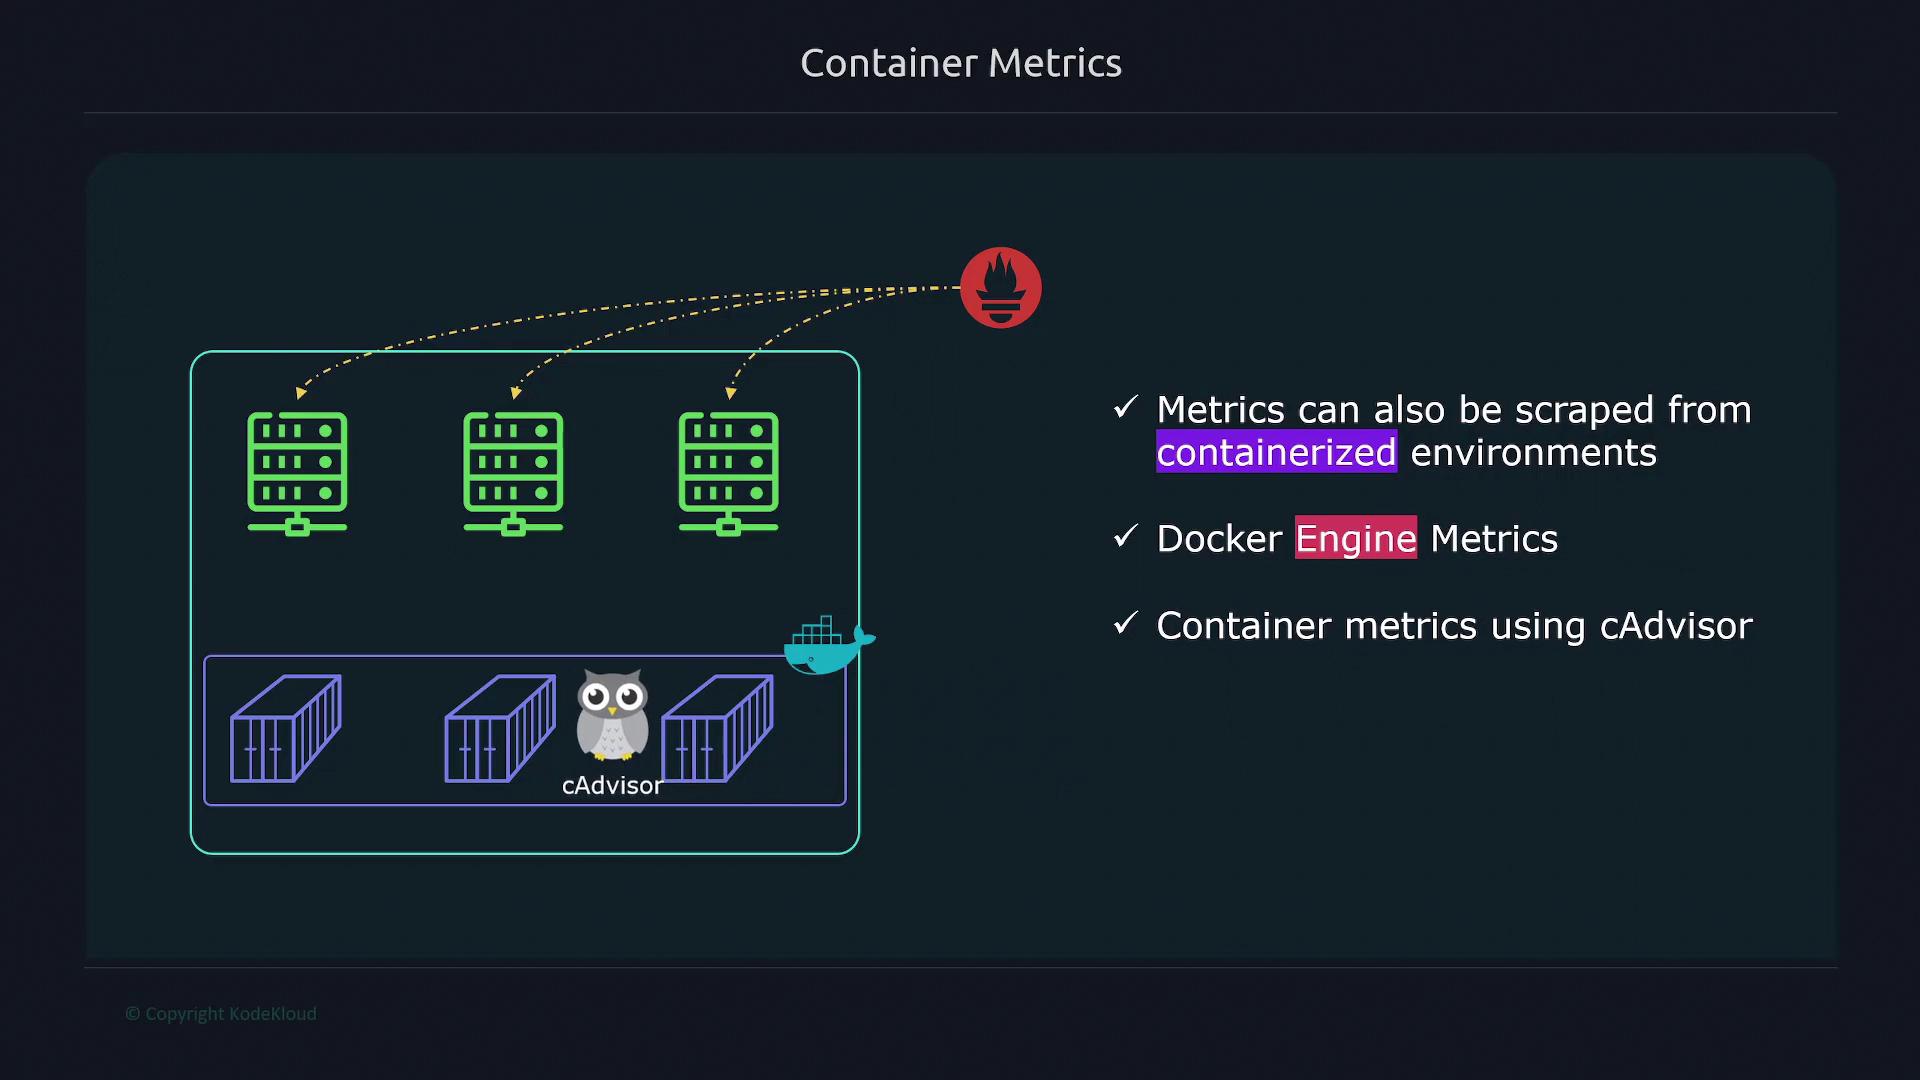
Enabling cAdvisor for Container Metrics
To obtain detailed, container-specific metrics, deploy cAdvisor using Docker Compose. Follow these steps:
- Create a Docker Compose file.
- Define a service for cAdvisor, ensuring it has the necessary privileges and mounts to access system metrics.
- Launch cAdvisor on your Docker host.
Below is an example Docker Compose configuration for deploying cAdvisor:
version: '3.4'
services:
cadvisor:
image: gcr.io/cadvisor/cadvisor
container_name: cadvisor
privileged: true
devices:
- "/dev/kmsg:/dev/kmsg"
volumes:
- /:/rootfs:ro
- /var/run:/var/run:ro
- /sys:/sys:ro
- /var/lib/docker:/var/lib/docker:ro
- /dev/disk:/dev/disk:ro
ports:
- 8000:8000
Start the cAdvisor container with Docker Compose:
docker-compose up
Once cAdvisor is running, verify its metrics by executing:
curl localhost:8000/metrics
Update your Prometheus configuration to add a scrape job for cAdvisor metrics:
scrape_configs:
- job_name: "cAdvisor"
static_configs:
- targets: ["12.1.13.4:8000"]
Replace "12.1.13.4" with your Docker host's actual IP address. For more details, refer to the official cAdvisor GitHub repository.
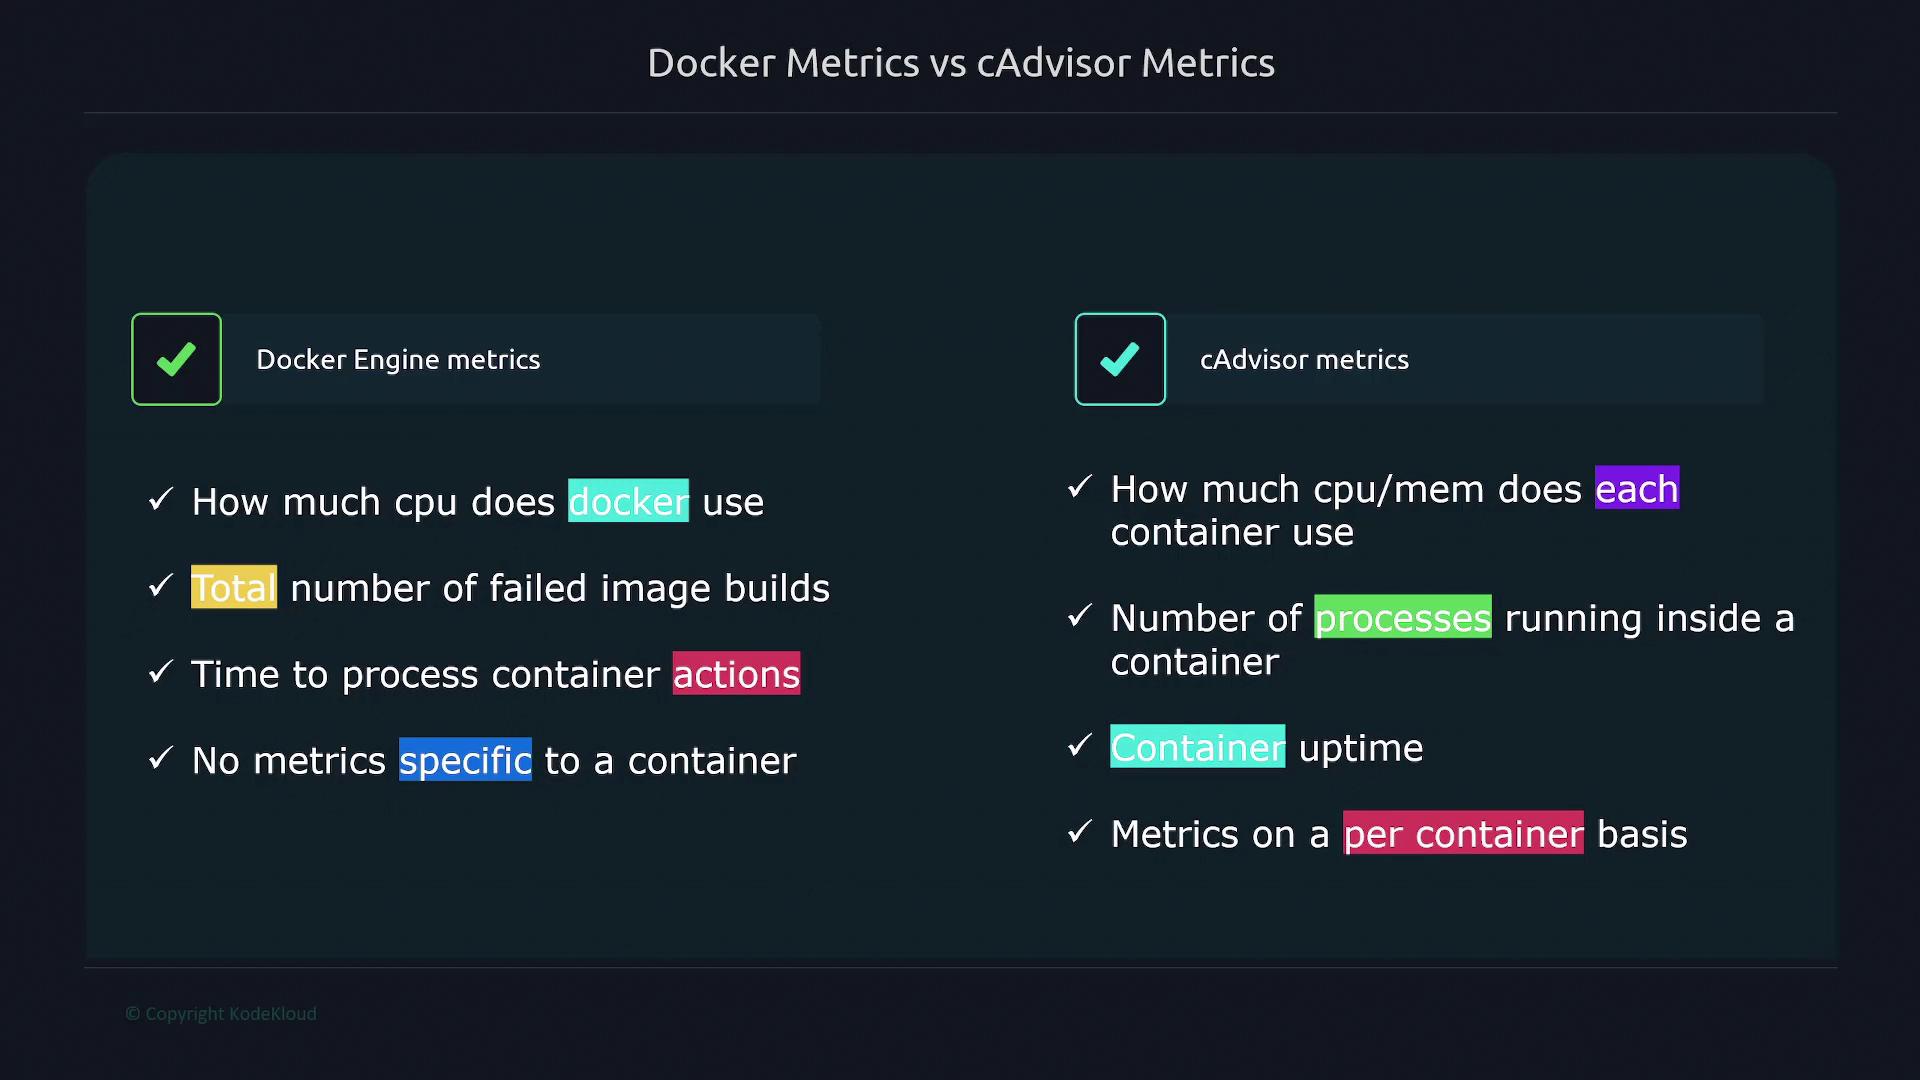
Comparing Docker Engine and cAdvisor Metrics
Docker Engine metrics provide insights into the performance of the entire Docker engine. These metrics include CPU usage, the total number of failed image builds, and the processing time for container actions. However, they do not offer container-specific details.
In contrast, cAdvisor delivers a granular view of individual container performance, covering:
- CPU and memory usage per container
- The number of processes running within a container
- Container uptime
Below is a summary comparison of Docker Engine and cAdvisor metrics:
Feature | Docker Engine Metrics | cAdvisor Metrics |
---|---|---|
Scope | Overall engine performance | Detailed container-specific performance |
CPU & Memory Utilization | General engine metrics | Per-container usage details |
Process Tracking | Not available | Detailed process count per container |
Use Case | Monitoring Docker daemon health | In-depth analysis of container behavior |
The following diagram further illustrates the distinctions between Docker Engine and cAdvisor in terms of CPU usage, container-specific metrics, and process tracking:
Quick Tip
For a comprehensive monitoring solution, use Docker metrics for overall engine health and cAdvisor metrics for detailed container performance insights.
By following the steps outlined in this guide, you can efficiently monitor both Docker Engine and container-specific metrics using Prometheus. This dual-approach provides you with a robust view that helps optimize performance and troubleshoot issues in containerized environments.
Watch Video
Watch video content
Practice Lab
Practice lab