This lesson explores PromQL, the query language for Prometheus, covering data types, selectors, operators, and advanced usage for metrics querying and visualization.
In this lesson, we explore PromQL (Prometheus Query Language), the primary method for querying metrics within Prometheus. Using a PromQL expression, you send a request to the Prometheus server and receive data that can be visualized on dashboards—whether using Grafana or Prometheus’s built-in visualization tools.
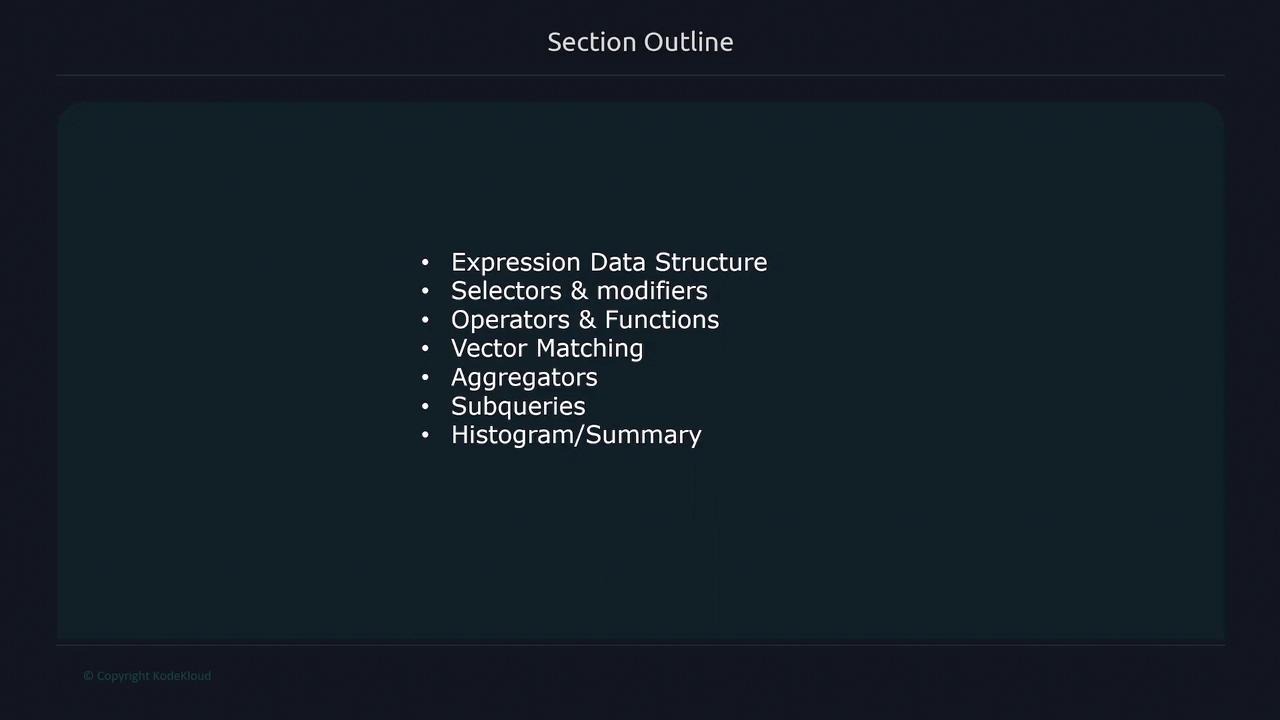
Additionally, PromQL is employed to construct alerting rules, alerting administrators when pre-set thresholds are exceeded. In this lesson, we cover topics such as:
Expression data structures and their returned types
Selectors and modifiers for retrieving specific data
When you run a PromQL expression, the Prometheus server returns data in one of four types:
String: A simple text value (currently unused in queries).
Scalar: A floating-point number (e.g., 54.743 or 127.43).
Instant Vector: A set of time series where each series contains exactly one sample, all sharing the same timestamp.
Range Vector: A set of time series where each series contains multiple data points across a specified time interval.
PromQL’s type system is designed to efficiently support real-time metrics querying and visualization. Understanding each type helps you choose the right queries for your monitoring needs.
A string is simply a text value and is not used for metric queries in Prometheus. In contrast, a scalar is a floating-point number that can represent values like 54.743. Scalars are excellent for calculations and can be paired with other data types in binary operations.
An instant vector returns a set of time series, with each series providing one sample at a single, consistent timestamp. Consider the following example query, which retrieves the metric “node_cpu_seconds_total”:
In this example, Prometheus identifies the metric along with its unique label combinations, resulting in four time series. The key characteristic here is that each time series is sampled at the same moment. For instance:
$ node_cpu_seconds_totalnode_cpu_seconds_total{cpu="0", instance="server1"} 258277.86 March 3rd 11:05AMnode_cpu_seconds_total{cpu="1", instance="server1"} 448430.21 March 3rd 11:05AMnode_cpu_seconds_total{cpu="0", instance="server2"} 941202.32 March 3rd 11:05AMnode_cpu_seconds_total{cpu="1", instance="server2"} 772838.83 March 3rd 11:05AM
Each line represents a sample taken at the identical timestamp, ensuring consistent data for snapshot analyses.
Unlike instant vectors, range vectors return multiple data points over a specified time window. By appending a [3m] modifier, the query instructs Prometheus to return data for the past three minutes:
$ node_cpu_seconds_total[3m]node_cpu_seconds_total{cpu="0", instance="server1"} 674478.07 March 3rd 08:05AMnode_cpu_seconds_total{cpu="0", instance="server1"} 674626.76 March 3rd 08:06AMnode_cpu_seconds_total{cpu="1", instance="server2"} 884597.02 March 3rd 08:05AMnode_cpu_seconds_total{cpu="1", instance="server2"} 540071.18 March 3rd 08:06AMnode_cpu_seconds_total{cpu="1", instance="server2"} 944799.49 March 3rd 08:07AM
Here, each time series includes multiple samples over the selected time range, providing a comprehensive view of metric trends. For example, one series might show values for 8:05, 8:06, and 8:07 AM, which is essential for analyzing behaviors over time.
Ensure you use the correct vector type based on your requirements. Instant vectors are useful for point-in-time snapshots, while range vectors are vital for understanding trends and diagnosing issues over time.