Prometheus Certified Associate (PCA)

Prometheus Fundamentals

Prometheus Architecture

In this article, we explore the detailed architecture of Prometheus, outlining its core components and explaining how they interact to collect, store, and query metrics data. This comprehensive overview is designed to help you understand how Prometheus ensures reliable monitoring with both pull-based and push-based models.

Core Components of Prometheus

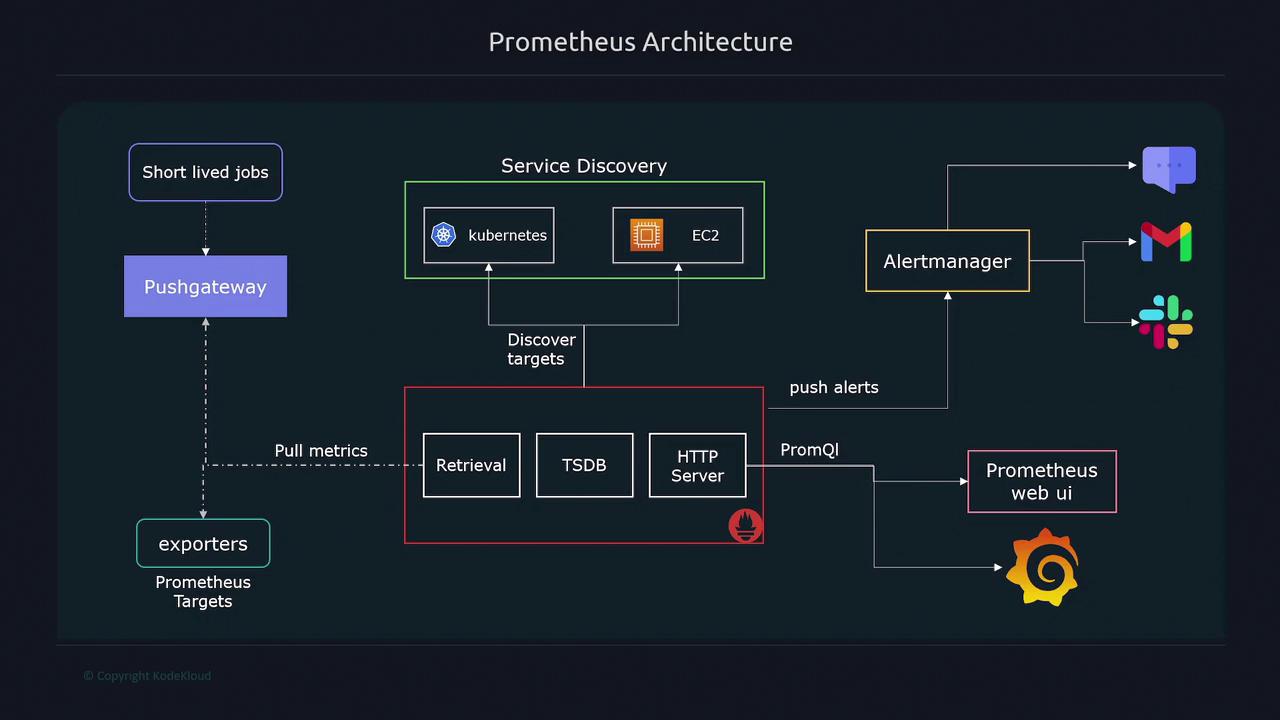
Prometheus is built around three primary components:

  1. Data Retrieval Worker
    This component is responsible for scraping metrics data from targets. It sends HTTP requests to the designated endpoints—typically at /metrics—to retrieve data, which is then forwarded for storage.

  2. Time Series Database
    Collected metrics are stored in a time series database. This database maintains all numerical data, allowing for efficient retrieval and analysis over time.

  3. HTTP Endpoint
    The built-in HTTP endpoint serves dual purposes:

    • It allows users to execute queries using PromQL.
    • It supports visualization and further analysis through tools like the Prometheus web UI and Grafana.

The tight integration of these components ensures that Prometheus can reliably collect and analyze metrics data.

The image is a diagram of Prometheus architecture, showing components like Pushgateway, Service Discovery, Alertmanager, and Prometheus web UI, with connections for metrics and alerts.

Prometheus scrapes metrics by sending requests to the /metrics endpoint of each target. For targets that expose metrics at an alternative URL, you can easily adjust your Prometheus configuration to accommodate the change.
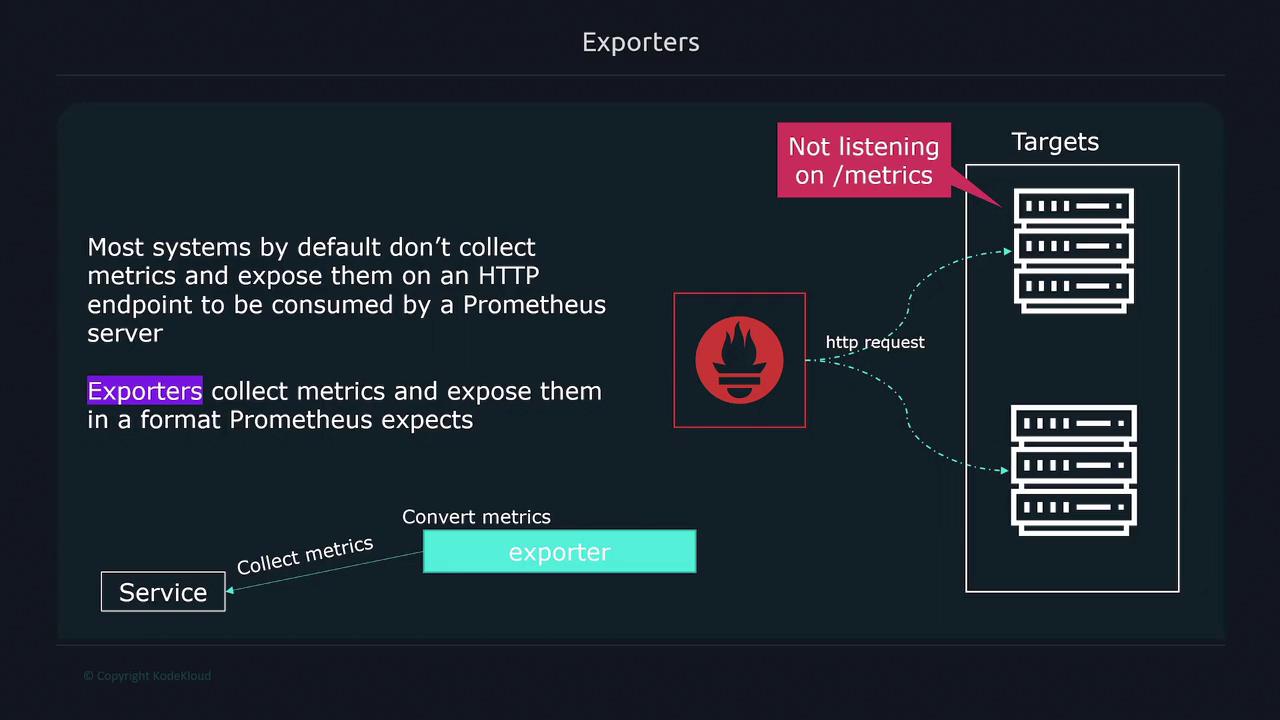
Exporters

In many cases, applications and servers do not natively expose metrics in a format that Prometheus can parse. Exporters serve as the bridge in these situations. They:

  • Collect metrics from a designated system, service, or application.
  • Translate internal data into a format that Prometheus understands.
  • Expose the metrics via a /metrics endpoint for Prometheus to scrape.

Exporters are invaluable for integrating Prometheus with diverse systems without modifying each application's codebase.

The image explains how exporters collect and expose metrics in a format expected by Prometheus, highlighting that most systems don't natively expose metrics on an HTTP endpoint. It includes a diagram showing the flow from service to exporter to Prometheus targets.

Prometheus supports a variety of native exporters, including:

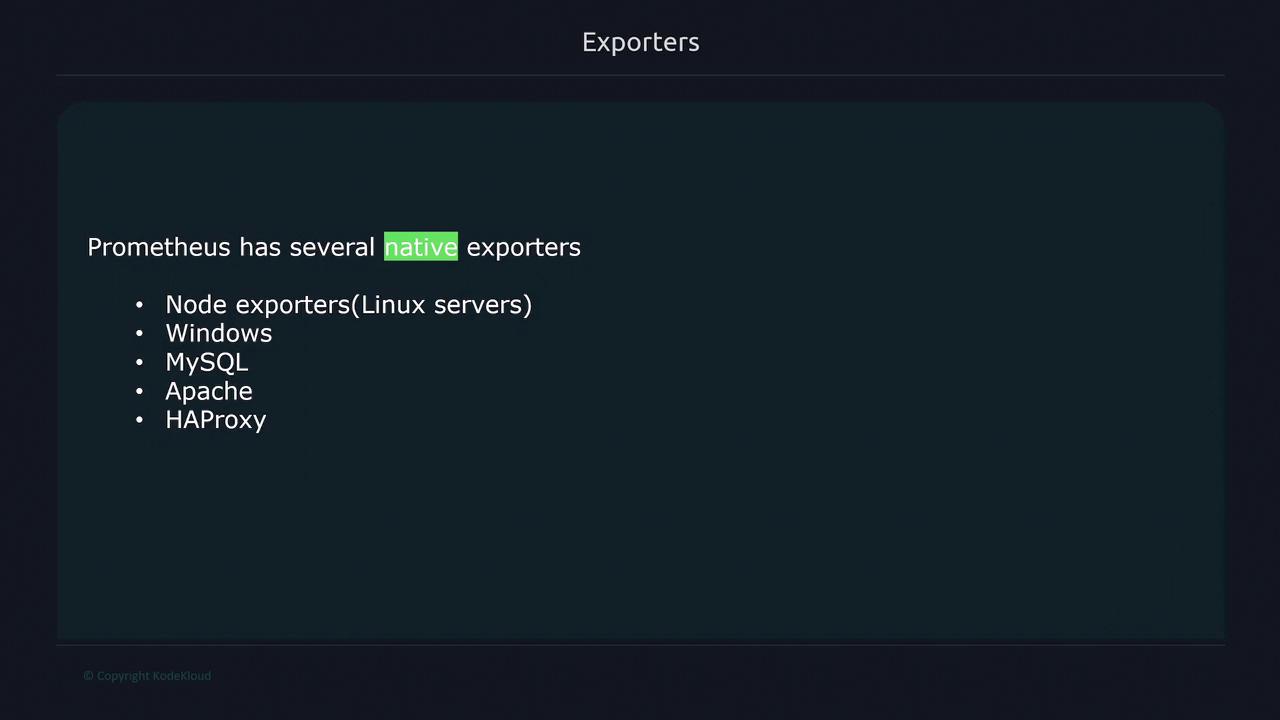
  • Node Exporter for Linux server metrics.
  • Exporters for Windows, MySQL, Apache, HAProxy, and more.

The image is a slide titled "Exporters" that lists several native Prometheus exporters, including Node exporters for Linux servers, Windows, MySQL, Apache, and HAProxy.

Refer to the official documentation for a complete list of supported exporters to ensure smooth integration with your environment.

Custom Application Metrics

For scenarios where you need to monitor custom application metrics—such as error rates, request latency, or process execution time—Prometheus offers a range of client libraries. These libraries support popular programming languages including Go, Java, Python, Ruby, and Rust, among others. Third-party libraries extend support to even more languages, enabling you to instrument your application without extra overhead.

The image is a slide discussing monitoring application metrics using Prometheus client libraries, which support languages like Go, Java, Python, Ruby, and Rust. It highlights tracking errors, request latency, and job execution time.

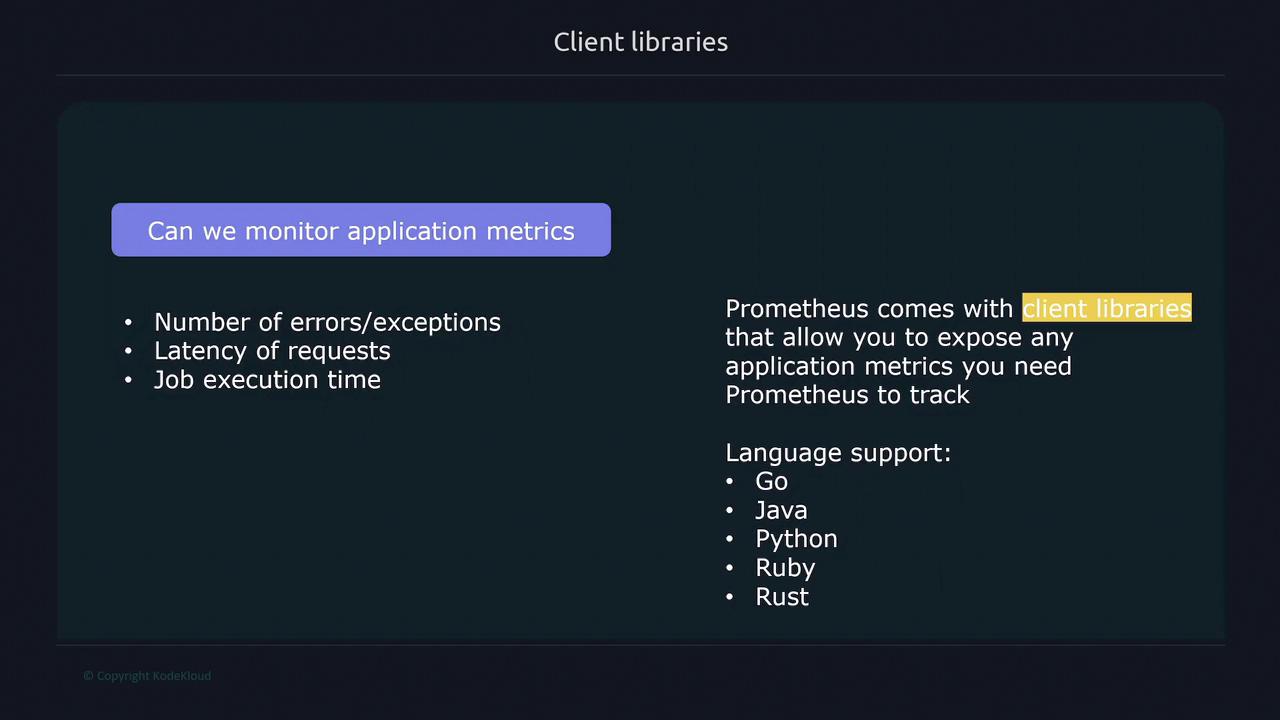
How Prometheus Discovers Targets

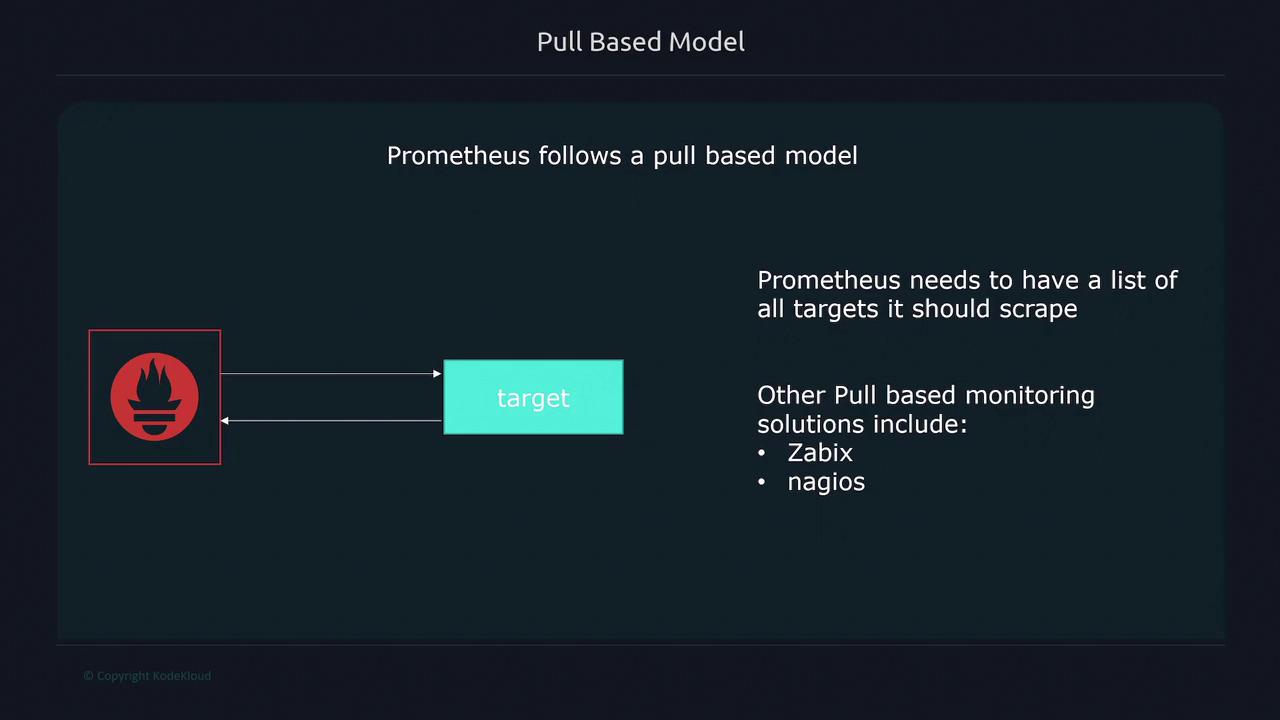
Prometheus operates primarily on a pull-based model, actively scraping metrics from a predefined list of targets. This list can be configured manually or dynamically populated using service discovery mechanisms in environments such as Kubernetes or cloud infrastructures.

This pull-based approach delivers several benefits:

  • Clear Target Visibility: It immediately identifies when a target is down.
  • Centralized Monitoring: Keeps a definitive list of all monitored targets.
  • System Protection: Helps prevent potential overload of the metrics server.

The image is a slide titled "Why Pull?" that lists the benefits of using a pull-based system, such as easier target status detection, avoiding server overload, and having a definitive list of targets.

For short-lived jobs that might vanish before the next scrape, Prometheus includes the Pushgateway component. This component allows such jobs to push their metrics, which Prometheus subsequently scrapes as part of its normal process.

Comparing Pull and Push Models

While Prometheus is fundamentally designed around the pull model, understanding both approaches is essential:

  • Pull-Based Model
    Prometheus scrapes data directly from targets, which ensures:

    • Every target is known and consistently monitored.
    • Verification of target availability during each scrape cycle.

    The image illustrates a pull-based model for Prometheus, showing how it scrapes data from targets. It also mentions other pull-based monitoring solutions like Zabbix and Nagios.

  • Push-Based Model
    In contrast, the push-based model requires targets to actively send data to a monitoring server. This model is particularly useful for:

    • Event-driven systems.
    • Short-lived jobs that might not be available during scraping cycles.

    However, this approach can complicate status checks and may risk overloading the server.

    The image illustrates a push-based monitoring model where targets send metric data to a monitoring server. It lists systems like Logstash, Graphite, and OpenTSDB as examples.

Note

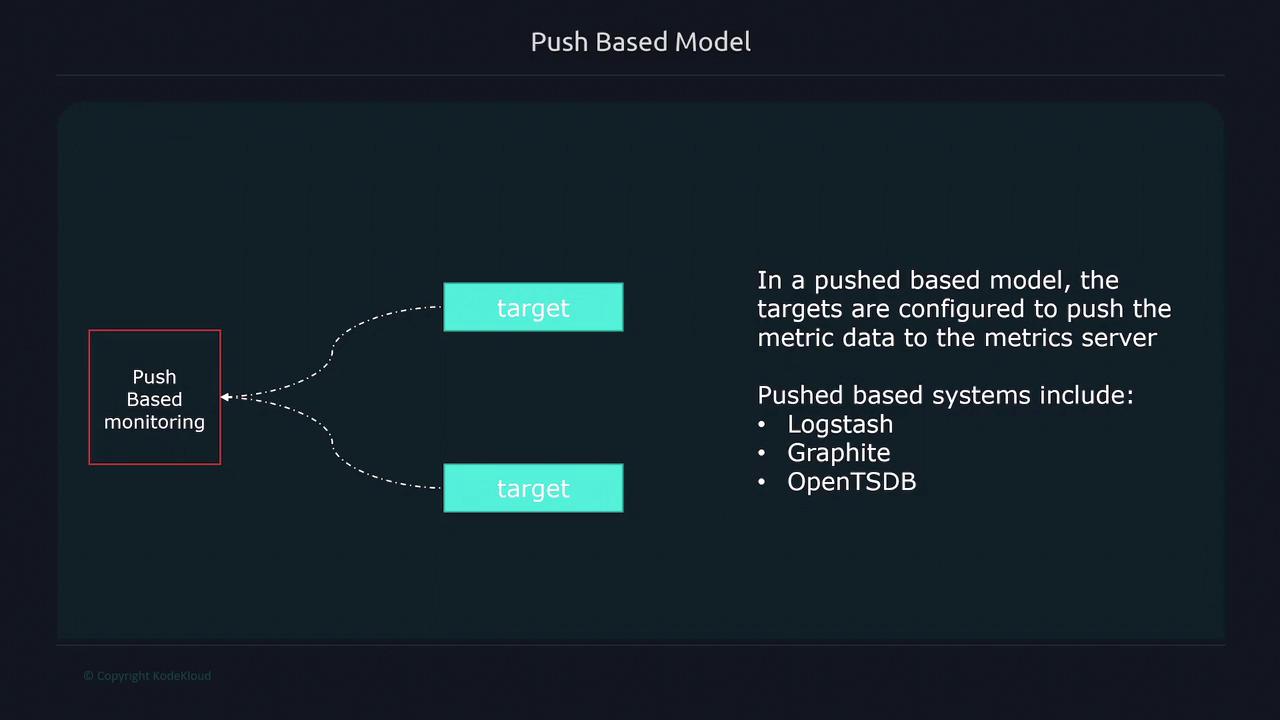
When using the push-based model, consider integrating the Pushgateway to bridge the gap for transient jobs. This ensures that even metrics from short-lived processes are captured accurately.

Additional benefits of the pull-based system include straightforward target verification and reduced risk of server overload due to a centralized monitoring approach.

The image is a slide titled "Why Pull?" that lists the benefits of using a pull-based system, such as easier target status detection, avoiding server overload, and having a definitive list of targets.

For scenarios demanding event-based data flow or monitoring of ephemeral jobs, the Pushgateway component accepts pushed metrics and makes them available for regular scraping by Prometheus.

The image is a slide discussing the advantages of push-based monitoring, highlighting its effectiveness in event-based systems and short-lived jobs.

This architecture overview illustrates how Prometheus efficiently collects, stores, and queries metrics, while offering flexible data ingestion options tailored to diverse monitoring requirements.

Watch Video

Watch video content

Previous
Prometheus Basics