Prometheus Certified Associate (PCA)

Prometheus Fundamentals

Prometheus Installation

In this lesson, you will learn how to install a Prometheus server with clear, step-by-step instructions.

Step 1: Downloading Prometheus

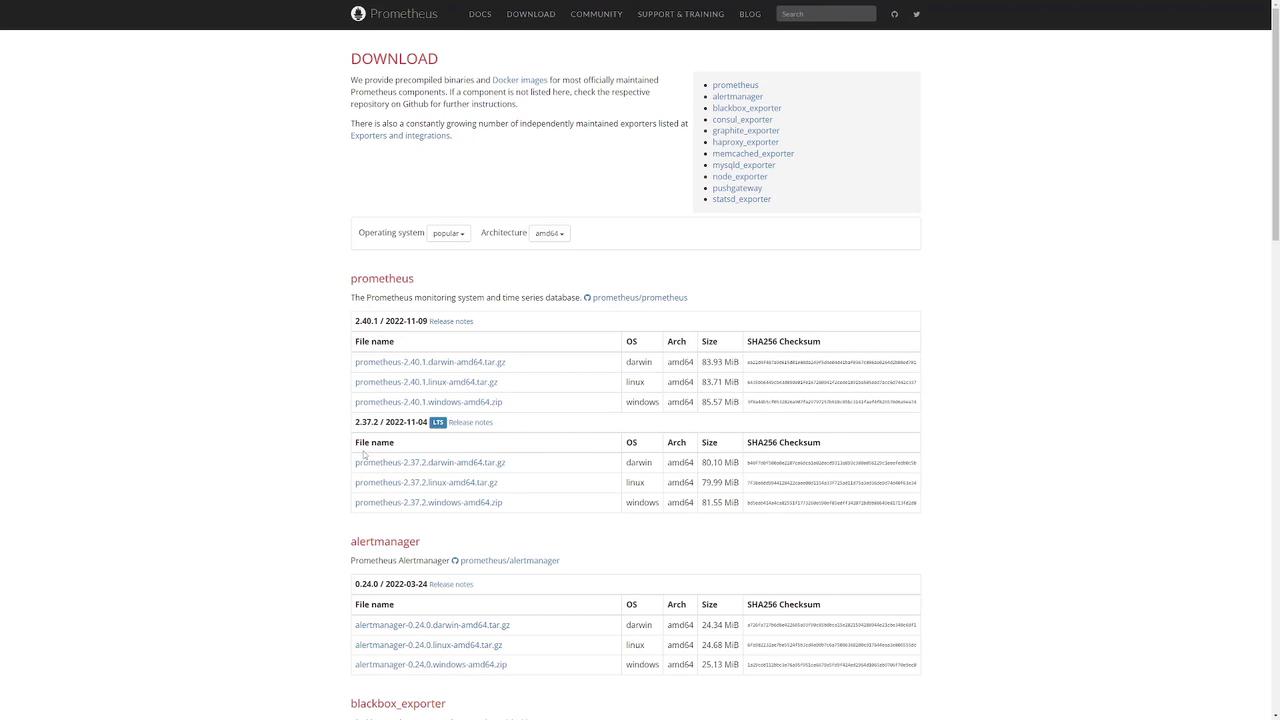
Visit the Prometheus download page to find the URL for the Prometheus binary. You have two options:

  • Download the file directly from your browser.
  • Copy the URL and download the binary using a command-line tool like wget.

Step 2: Verifying the Download

After downloading, verify that the tar file is present by listing your files. For example:

$ ls -l
total 173344
-rwxrwxrwx 1 user1 user1   1112 Sep  1 00:42 ca.crt
drwxr-xr-x 2 user1 user1   4096 Aug 16 11:58 Desktop
drwxr-xr-x 3 user1 user1   4096 Aug 19 01:28 Documents
drwxr-xr-x 4 user1 user1   4096 Aug 23 20:25 Downloads
drwxr-xr-x 2 user1 user1   4096 Aug 16 11:58 Music
drwxr-xr-x 2 user1 user1   4096 Aug 16 11:58 Pictures
-rw-rw-r-- 1 user1 user1 83782323 Jul 14 11:38 prometheus-2.37.0.linux-amd64.tar.gz
drwxr-xr-x 2 user1 user1   4096 Aug 16 11:58 Templates
drwxr-xr-x 2 user1 user1   4096 Aug 16 11:58 Videos

The Prometheus binary is packaged inside a tar file. The next step is to extract this tarball.

Step 3: Extracting the Tarball

Extract the Prometheus tarball by running the following command:

$ tar xvf prometheus-2.37.0.linux-amd64.tar.gz

To ensure the extraction was successful, list your files again. You should see a folder containing all Prometheus files:

$ ls -l
prometheus-2.37.0.linux-amd64/
prometheus-2.37.0.linux-amd64/console/
prometheus-2.37.0.linux-amd64/console/index.html.example
prometheus-2.37.0.linux-amd64/console/node-cpu.html
...

Step 4: Exploring the Prometheus Directory

Navigate into the newly created Prometheus directory and list its contents:

$ cd prometheus-2.37.0.linux-amd64/
$ ls -l
total 206216
drwxr-xr-x 2 user1 user1  4096 Jul 14 11:30 console_libraries
drwxr-xr-x 2 user1 user1  4096 Jul 14 11:30 consoles
-rw-r--r-- 1 user1 user1  11357 Jul 14 11:30 LICENSE
-rw-r--r-- 1 user1 user1   3773 Jul 14 11:30 NOTICE
-rwxr-xr-x 1 user1 user1 109655433 Jul 14 11:16 prometheus
-rw-r--r-- 1 user1 user1    934 Jul 14 11:30 prometheus.yml
-rwxr-xr-x 1 user1 user1 101469395 Jul 14 11:18 promtool

Key components in this directory include:

  • prometheus: The main server executable.
  • prometheus.yml: The configuration file.
  • promtool: A command-line utility to validate configurations.
  • consoles and console_libraries: Directories used for dashboards and visualization.

Note

For further configuration options, refer to the Prometheus documentation.

Step 5: Starting Prometheus

Launch the Prometheus server by executing the binary:

$ ./prometheus

You should see output similar to the following:

ts=2022-09-02T03:25:25.910Z caller=main.go:996 level=info msg="TSDB started"
ts=2022-09-02T03:25:25.910Z caller=main.go:1177 level=info msg="loading configuration file" filename=prometheus.yml
ts=2022-09-02T03:25:25.910Z caller=main.go:1214 level=info msg="Completed loading of configuration file" filename=prometheus.yml totalDuration=308.821µs db_storage=496ns remote_storage=809ns web_handler=206ns query_engine=477ns scrape=108.631µs scrape_sd=13.469µs notify=16.746µs notify_sd=7.923µs rules=1.049µs tracing=3.23µs
ts=2022-09-02T03:25:25.910Z caller=main.go:957 level=info msg="Server is ready to receive web requests."
ts=2022-09-02T03:25:25.910Z caller=manager.go:941 level=info component="rule manager" msg="Starting rule manager..."

If you do not see any errors, your Prometheus server is running successfully.

Step 6: Accessing the Web Interface

Open your web browser and navigate to the Prometheus web interface. If running on your local machine, visit:

http://localhost:9090

For remote installations, replace "localhost" with your server’s IP address. In the default configuration, Prometheus listens on port 9090.

The image shows a diagram for accessing a Prometheus server using a web browser at "http://localhost:9090" and a screenshot of the Prometheus web interface.

To verify functionality, open the Prometheus expression browser and run the query:

up{instance="localhost:9090", job="prometheus"}

A value of 1 indicates the target is up, while 0 indicates it is down. By default, Prometheus monitors its own metrics.

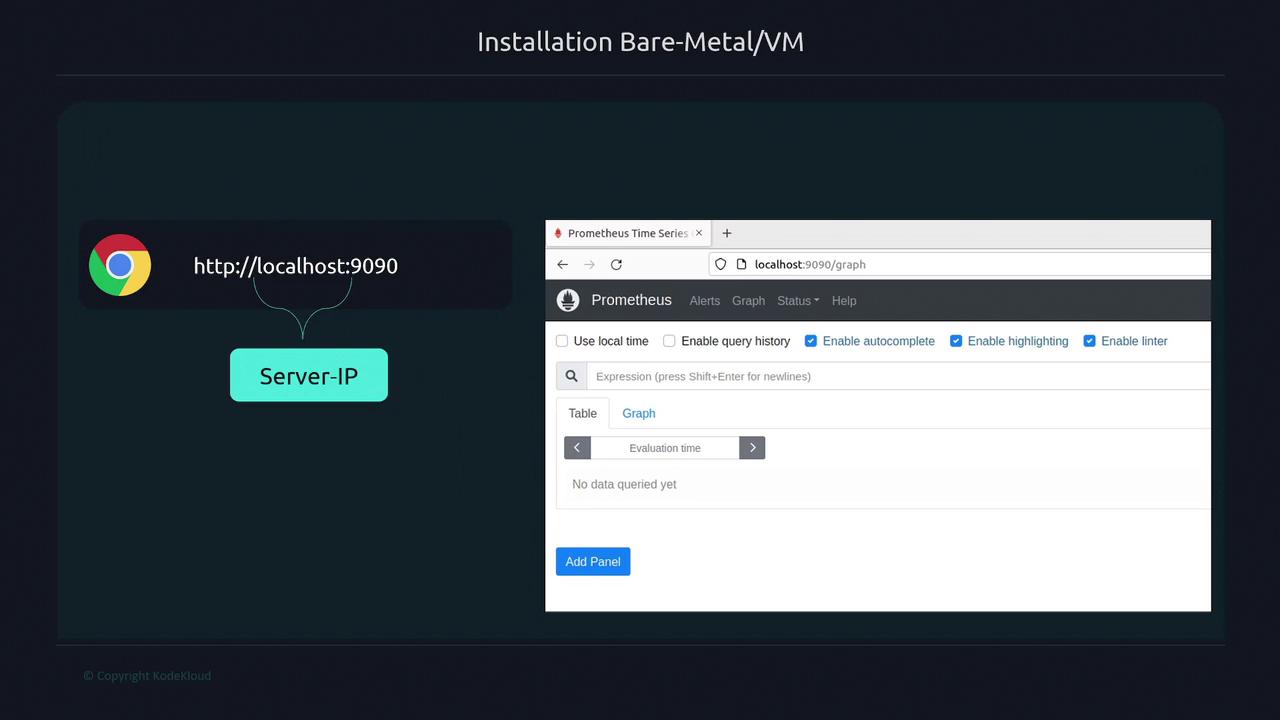
Step 7: Detailed Walkthrough via the Prometheus Website

Head back to the Prometheus website’s download section for additional details:

The image is a screenshot of the Prometheus website, highlighting its features as an open-source monitoring solution with sections on dimensional data, powerful queries, and integrations. It also includes a statement condemning Russia's invasion of Ukraine.

Within the download block, choose the appropriate Prometheus binary version for your operating system:

The image shows a download page for Prometheus, listing different versions and file types available for various operating systems and architectures, along with their sizes and SHA256 checksums.

Copy the download link for the version you need and execute the following commands:

$ wget https://github.com/prometheus/prometheus/releases/download/v2.37.2/prometheus-2.37.2.linux-amd64.tar.gz
$ ls -l

Extract the tarball:

$ tar xvf prometheus-2.37.2.linux-amd64.tar.gz

Then, navigate into the Prometheus directory and check its contents:

$ cd prometheus-2.37.2.linux-amd64
$ ls -la

Finally, start the Prometheus server:

$ ./prometheus

The startup logs should resemble the following:

ts=2022-11-12T08:22:18.102Z caller=main.go:491 level=info msg="No time or size retention was set so using the default time retention" duration=15d
ts=2022-11-12T08:22:18.102Z caller=main.go:535 level=info msg="Starting Prometheus Server" mode=server version="(version=2.37.2, branch=HEAD, revision=dd46b6bf1261ae67f54d4f5642874aa462bfbb63c)"
ts=2022-11-12T08:22:18.103Z caller=main.go:540 level=info build_context="(go-gol1.18.8, user=root@dfb1e29f33b, date=20221104-11:06:40)"
ts=2022-11-12T08:22:18.103Z caller=main.go:541 level=info host_details="(Linux 5.15.0-52-generic #58~Ubuntu SMP Thu Oct 13 08:03:55 UTC 2022 x86_64 user1 (none))"
ts=2022-11-12T08:22:18.134Z caller=web.go:553 level=info component=web msg="Start listening for connections" address=0.0.0.0:9090
ts=2022-11-12T08:22:18.137Z caller=main.go:691 level=info msg="Starting TSDB ..."
ts=2022-11-12T08:22:18.139Z caller=main.go:695 level=info component=tsdb msg="Replaying on-disk memory mappable chunks if any"
ts=2022-11-12T08:22:18.195Z caller=component_web.go:195 level=info component=web msg="TLS is disabled." http2=false
ts=2022-11-12T08:22:18.498Z caller=head.go:536 level=info component=tsdb msg="On-disk memory mappable chunks replay completed" duration=3.578µs
ts=2022-11-12T08:22:18.502Z caller=component-tsdb msg="Replaying WAL, this may take a while"
ts=2022-11-12T08:22:18.903Z caller=component-tsdb msg="WAL segment loaded" segment=0 maxSegment=0
ts=2022-11-12T08:22:18.946Z caller=main.go:996 level=info msg="TSDB started"
ts=2022-11-12T08:22:18.947Z caller=main.go:1214 level=info msg="Loading configuration file" filename=prometheus.yml
ts=2022-11-12T08:22:18.947Z caller=main.go:997 level=info msg="Loading configuration file" filename=prometheus.yml totalDuration=458.911µs db_storage=4.936µs
ts=2022-11-12T08:22:18.946Z caller=manager.go:941 level=info msg="Server is ready to receive web requests."
ts=2022-11-12T08:22:18.946Z caller=manager.go:941 level=info component="rule manager" msg="Starting rule manager..."

Open your web browser and go to:

http://localhost:9090

In the Prometheus expression browser, run the following query:

up{instance="localhost:9090", job="prometheus"}

If the result is 1, Prometheus is successfully scraping its own metrics.

Installation Complete

Congratulations! You have successfully installed and set up Prometheus. For more detailed configurations and integrations, refer to the Prometheus Documentation.

Watch Video

Watch video content

Previous
Prometheus Architecture