This article explains how to configure AWS EC2 service discovery in Prometheus for real-time monitoring of dynamic cloud resources.
Cloud infrastructure is inherently dynamic—especially with auto-scaling enabled. Resources are continuously deployed and terminated, making real-time EC2 service discovery essential for Prometheus to maintain an updated list of instances to scrape.In this guide, you’ll configure EC2 service discovery by setting up the EC2 SD configuration block within Prometheus. This setup requires three pieces of information:
The AWS region of interest
The access key
The secret key
These credentials must belong to an IAM user with Amazon EC2 read-only access.
Ensure that the IAM user you create has only the necessary read-only permissions to enhance security.
Below is an example configuration snippet for Prometheus:
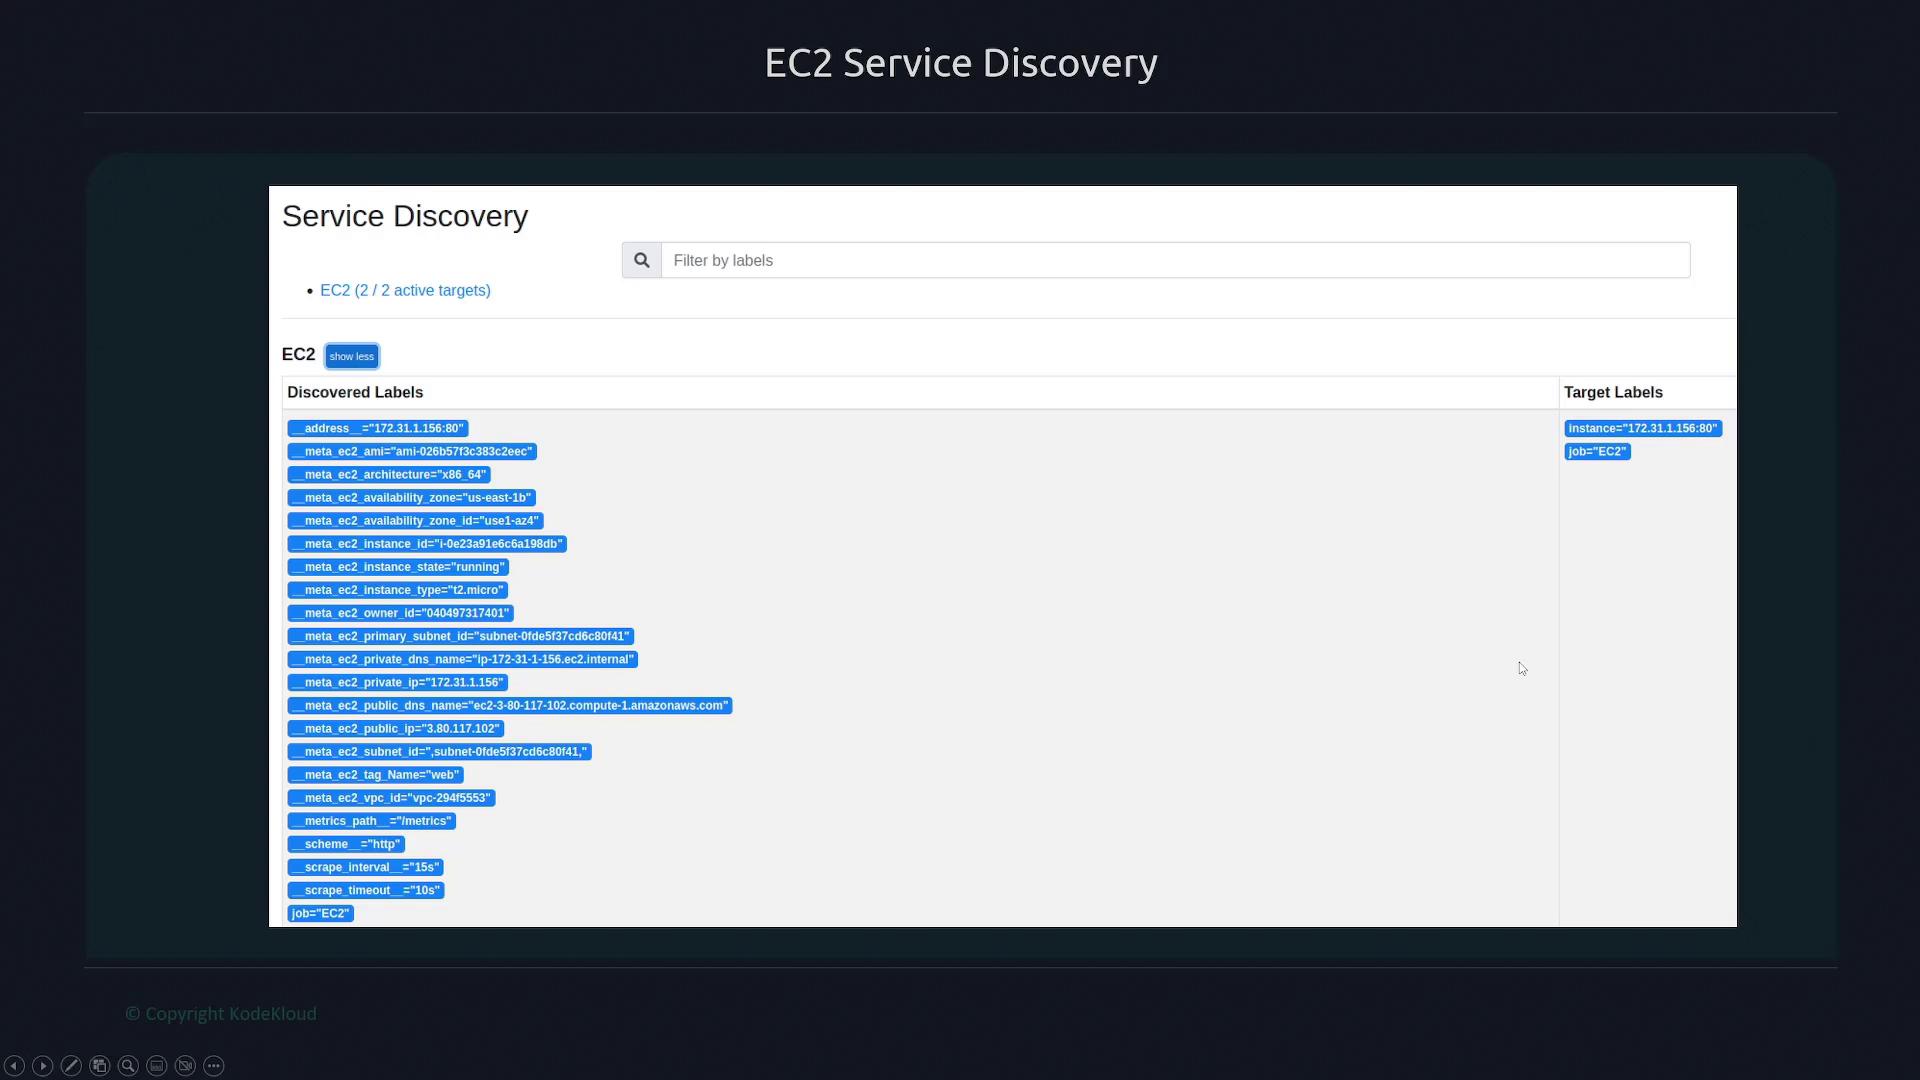
Once configured, Prometheus begins collecting extensive metadata from your EC2 instances. You can view many discovered labels—such as tags, instance types, VPC IDs, and private IPs. By default, Prometheus uses the private IP as the instance label because it is typically deployed close to its targets within the same cloud environment. If needed, you can also access the public IP via metadata labels, which is useful when some EC2 instances lack a public IP address.
To enable Prometheus to access AWS EC2 metadata, you need to create an IAM user specifically for this purpose. Follow these steps in the AWS Management Console:
Navigate to the IAM section.
Create a new user named “Prometheus”. This account is exclusively for programmatic access and will not use the AWS Console.
Enable programmatic access by generating an access key.
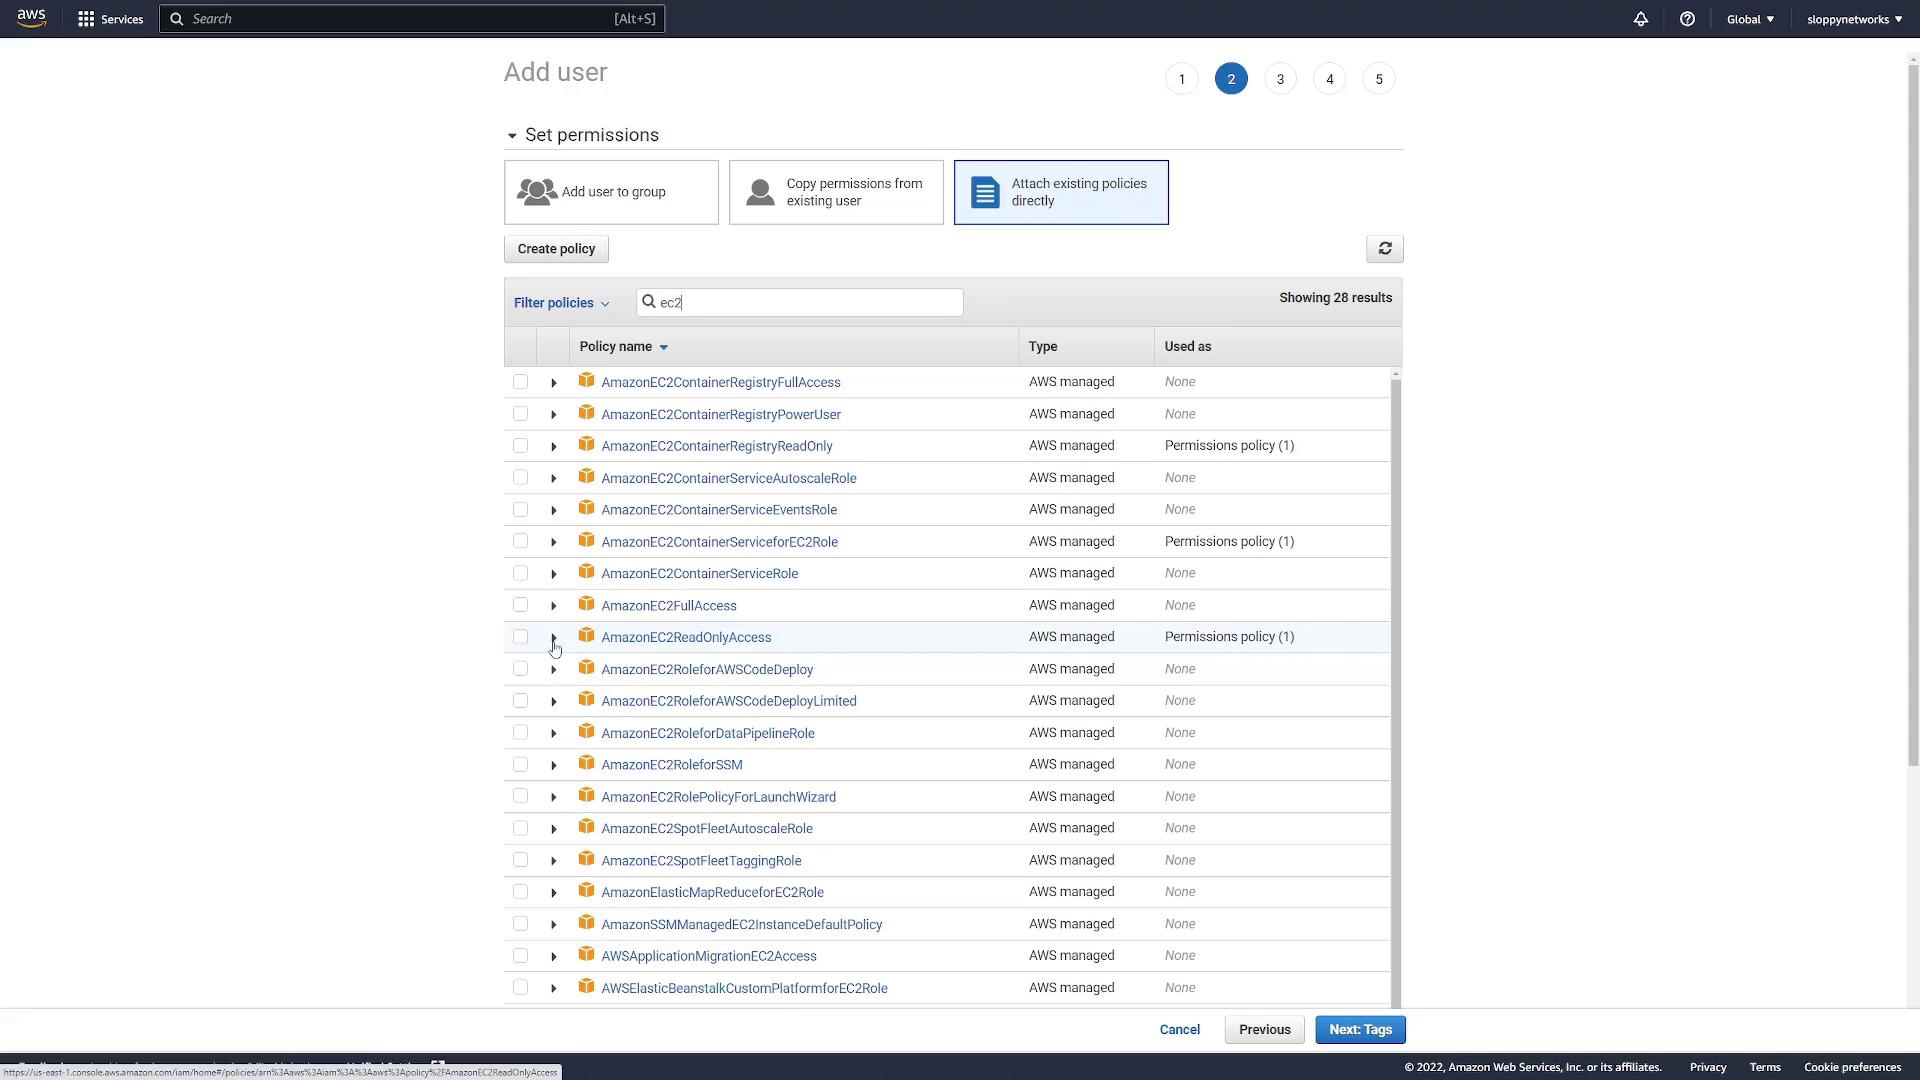
Attach the “Amazon EC2 read-only access” policy to the user.
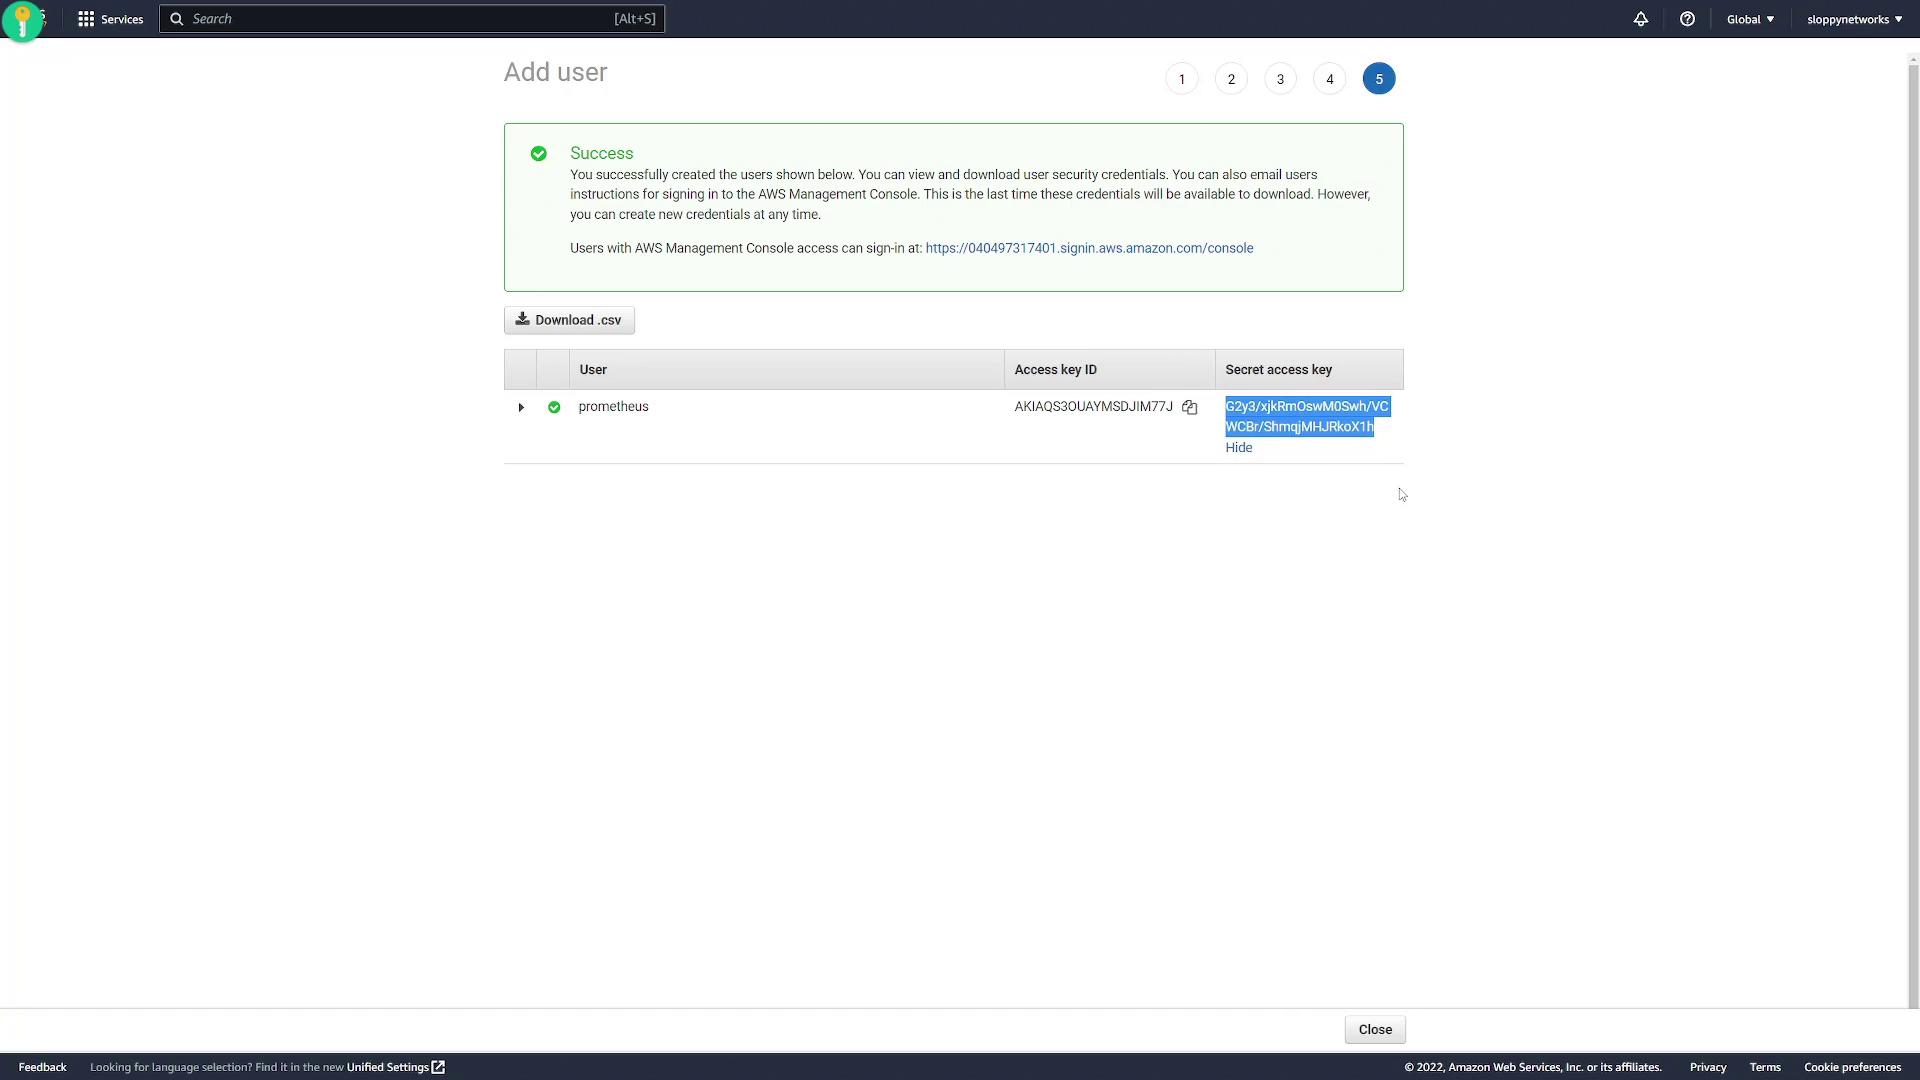
After attaching the required permissions, review the configuration and create the user. Once the new user is created, be sure to note the displayed access key and secret key, as these credentials are required in your Prometheus configuration.
Edit your Prometheus configuration file, typically located at /etc/prometheus/prometheus.yaml, to add a new job definition for EC2 service discovery. Below is an example configuration integrating the EC2 SD setup with other scrape configurations:
Copy
# Global configurationsglobal: scrape_interval: 15s # Scrape every 15 seconds (default is 1 minute). evaluation_interval: 15s # Evaluate rules every 15 seconds (default is 1 minute).# Alertmanager configurationalerting: alertmanagers: - static_configs: - targets: - alertmanager:9093# Rule files configuration (load rules periodically)rule_files: # - "first_rules.yml" # - "second_rules.yml"# Scrape configurationsscrape_configs: # Scrape configuration for Prometheus itself - job_name: "prometheus" static_configs: - targets: ['localhost:9090'] # Scrape configuration for Node Exporter - job_name: "node" static_configs: - targets: ['192.168.1.168:9100'] # Scrape configuration for EC2 instances - job_name: "ec2" ec2_sd_configs: - region: "us-east-1" # Replace with your desired region access_key: "<access key>" # Replace with your actual access key secret_key: "<secret key>" # Replace with your actual secret key
After saving the configuration file, restart Prometheus to apply these changes:
Copy
sudo systemctl restart prometheus
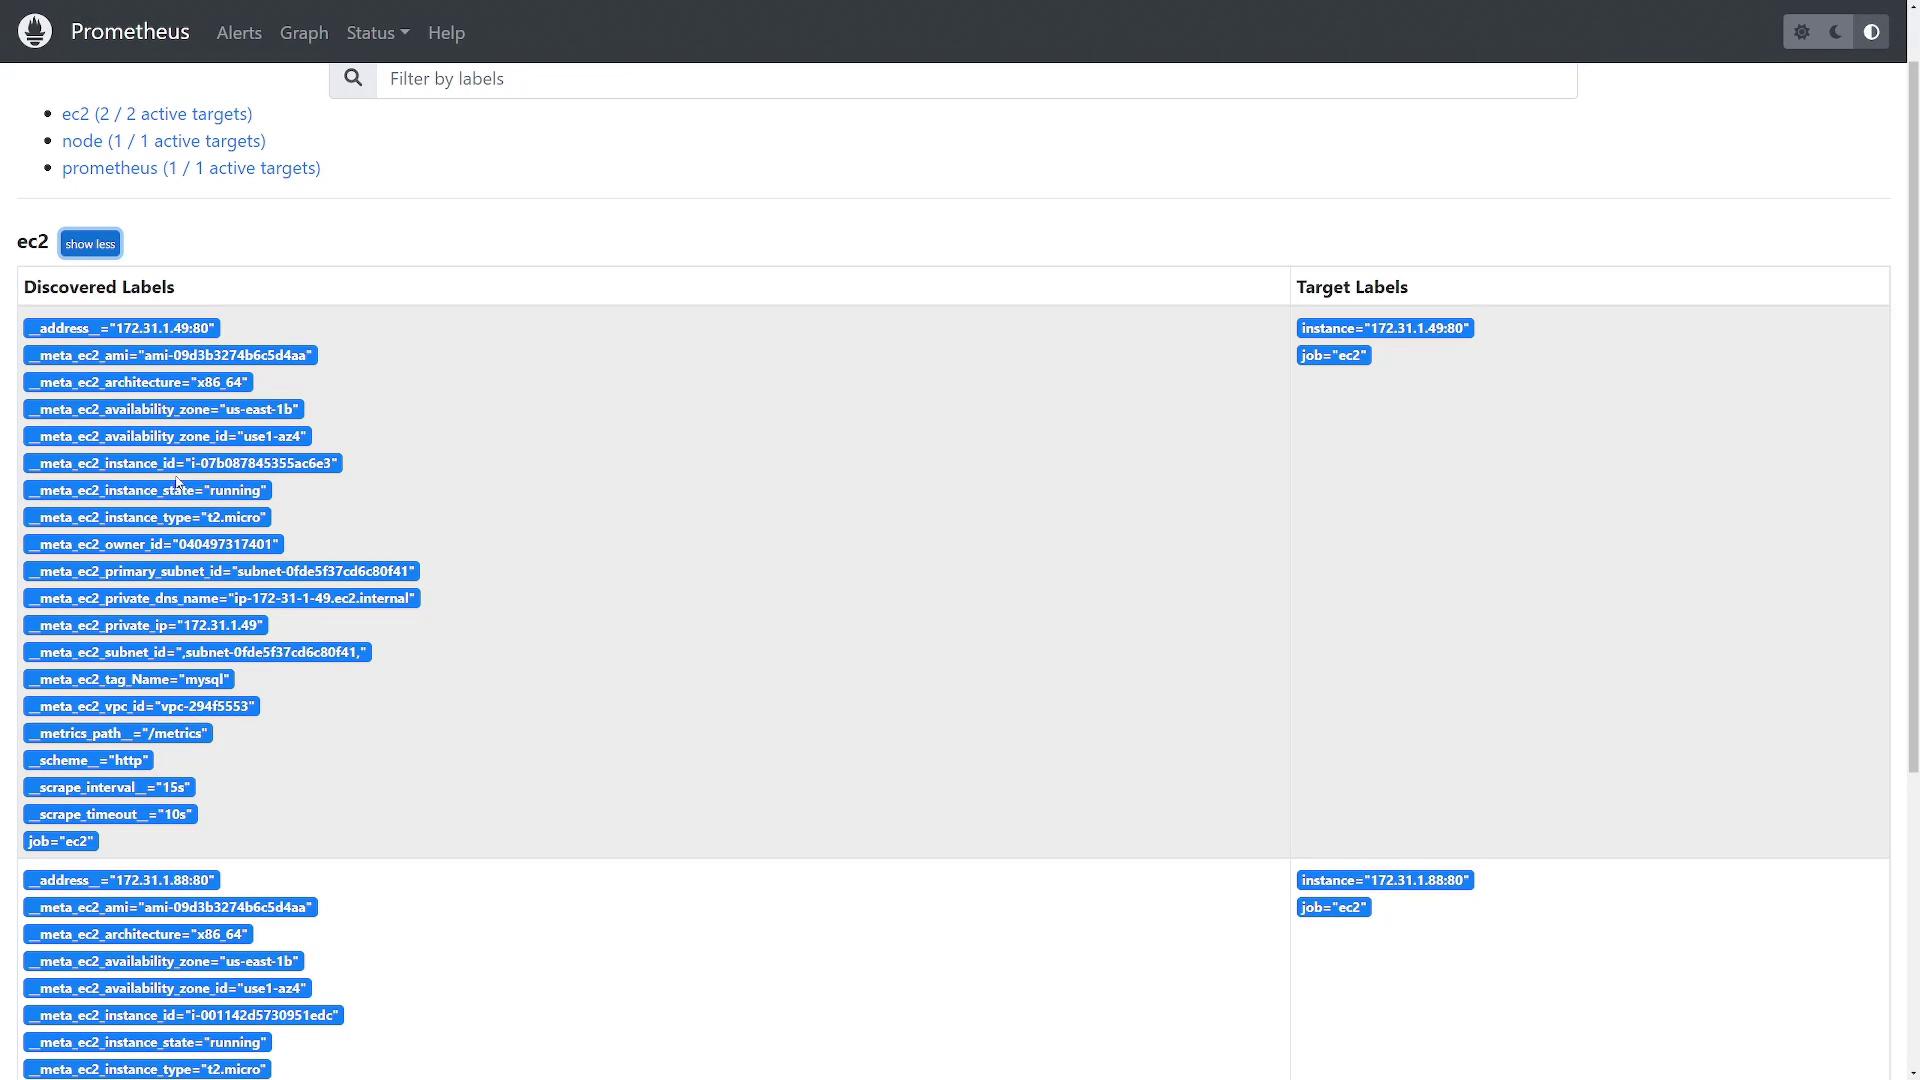
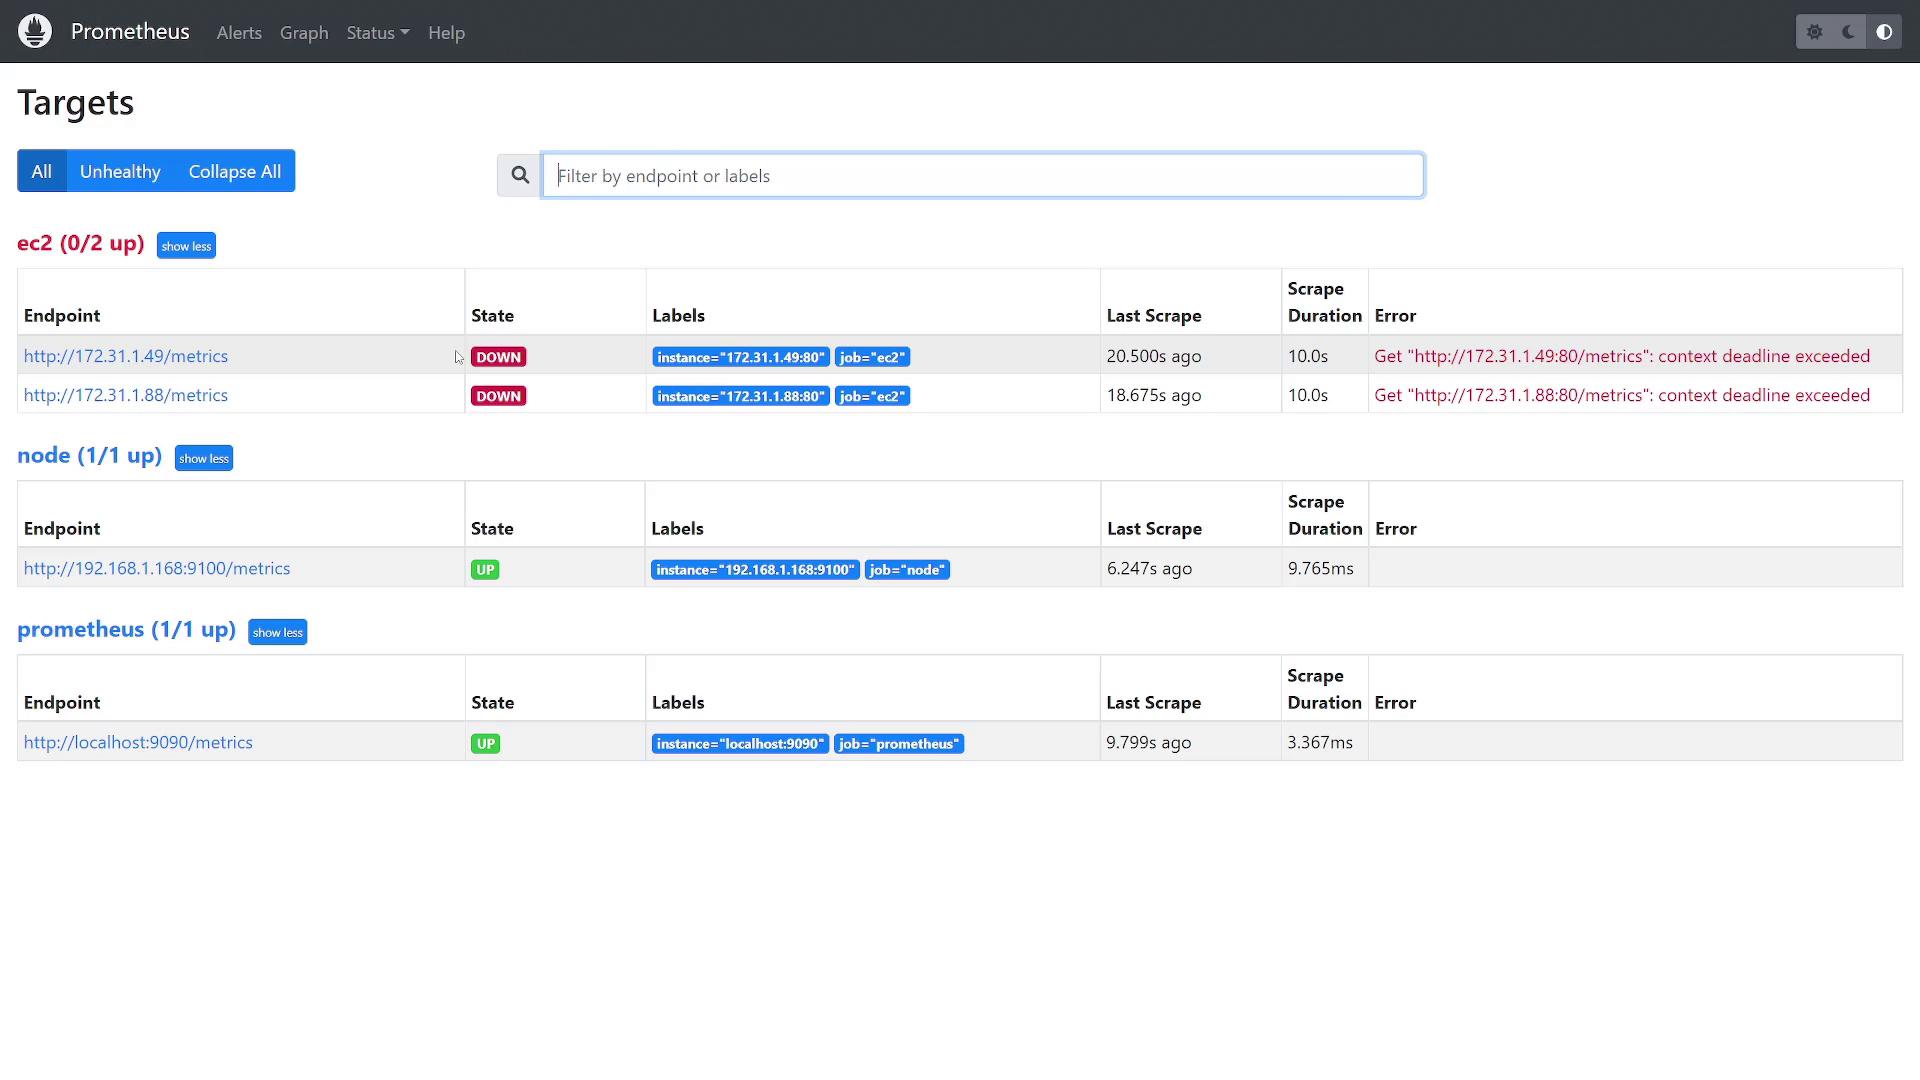
Once Prometheus restarts, navigate to the Status > Service Discovery section within the Prometheus interface. You should see discovered targets under the EC2 job, along with associated labels such as the AMI, architecture, owner ID, instance type, and private IP.
Keep in mind that if the Prometheus server cannot reach the EC2 instances, they may be marked as “down.” Once proper network connectivity is confirmed, the targets should display as “up.” Additionally, as new EC2 instances are launched or terminated, Prometheus will automatically update the service discovery, ensuring only active servers are monitored.
This completes the setup for AWS EC2 service discovery in Prometheus. With this configuration, your Prometheus instance will consistently monitor current EC2 instances, ensuring accurate and dynamic target discovery.