Filtering Targets with relabel_configs
When Prometheus performs service discovery for a job, it gathers targets along with a variety of discovered labels (e.g., environment, team, size, type). For instance, targets might include an environment label such as dev, staging, or prod, and a team label that identifies ownership (like “web” or “database”). You can configure Prometheus to include or exclude targets using relabeling rules before scraping. In the following example, we configure Prometheus to scrape only the targets where the environment is set to production. The configuration below uses file-based service discovery for simplicity.- The rule examines the
envlabel. - The regular expression
prodselects targets labeled with production. - The
keepaction ensures that only matching targets are scraped, while all others are dropped.
To drop production targets instead, simply change the action from
keep to drop: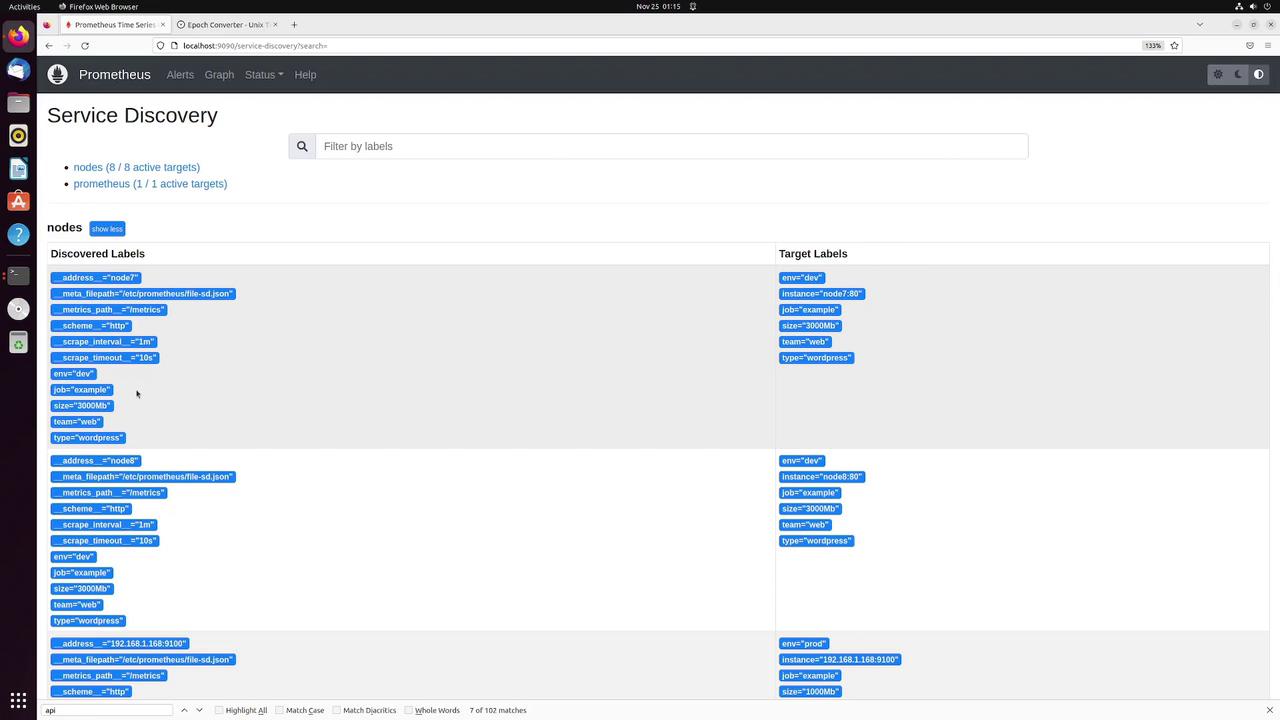
Combining Labels with Replacement
Another powerful operation is combining two or more labels into a new one. For example, you can merge theteam and env labels into a new target label called info. This new label might have values such as database-prod or web-dev.
Below is an example rule that demonstrates this operation:
- Two source labels (
teamandenv) are combined. - The regular expression
(.*);(.*)extracts their values, using the semicolon as an internal separator. - The
replaceaction creates the newinfolabel formatted as “team-environment” using$1-$2.
Dropping Unwanted Labels
Sometimes it is beneficial to eliminate extraneous labels that do not contribute any useful information. For example, if thesize label is unnecessary, you can remove it using the labeldrop action:
size is dropped while preserving all other labels.
Renaming Metrics with metric_relabel_configs
Metric relabeling takes place after scraping, allowing you to modify the metrics themselves. For example, suppose you want to rename the metricnode_cpu_seconds_total to host_cpu_seconds_total. Use the following configuration:
- The special label
__name__, representing the metric name, is used. - If it matches
node_cpu_seconds_total, the metric name is replaced withhost_cpu_seconds_total.
Keeping or Dropping Specific Metrics
There may be instances where you want to focus on a specific metric and filter out the rest. For example, to keep only the metricnode_arp_entries, add the following rule under the metric relabeling section:
node_arp_entries is retained while all other metrics are dropped from that particular target.
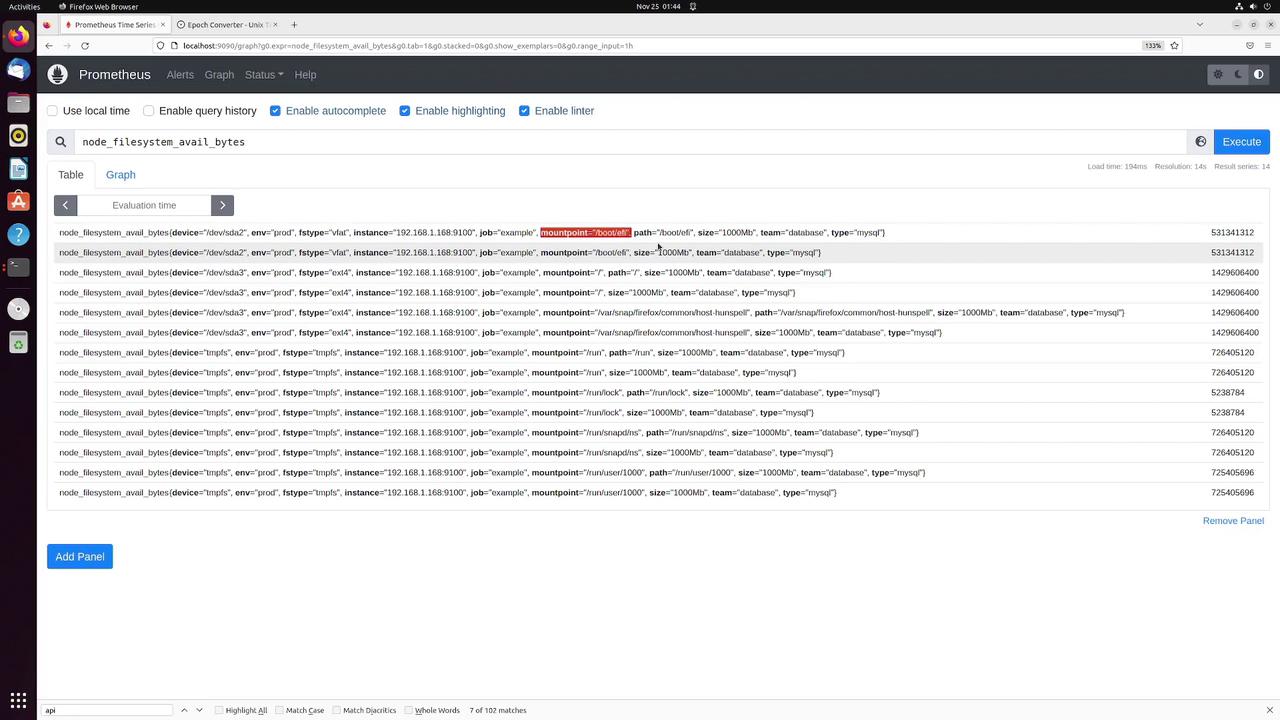
Renaming a Label Within a Metric
You can also modify labels attached to a metric. For instance, if you want to rename themountpoint label to path, the following metric relabel configuration can be used:
- The rule captures the original
mountpointlabel value. - The regex
(.*)grabs the entire value. - The new
pathlabel is created with the same value. - The original
mountpointlabel remains unless you add an additional rule to remove it.
path label while the mountpoint remains visible if not dropped.
Final Notes
This lesson demonstrated how to:- Filter targets before scraping using the
keepordropactions. - Combine multiple labels into a new composite label with the
replaceaction. - Remove unnecessary labels using
labeldrop. - Rename metrics and adjust labels post-scraping with metric relabeling.
Understanding and utilizing relabeling configurations enhances your metric management in Prometheus, enabling you to optimize which data gets scraped and stored. For more details on Prometheus configurations, review the Prometheus Documentation.