[Updated] AZ-104: Microsoft Azure Administrator

Administer Monitoring

Azure Activity Logs

Azure Activity Logs provide subscription-level logging for all events occurring at the Azure Resource Manager level. Every operation that modifies resources—such as creating or updating a virtual machine, deleting a database, or changing configurations—is recorded as a POST or PUT request. Note that simple GET operations, like merely viewing resources, are not logged.

These logs offer detailed insights into resource operations by recording essential data such as the initiator, timestamp, status, and other relevant information that is crucial for auditing.

Default Configuration

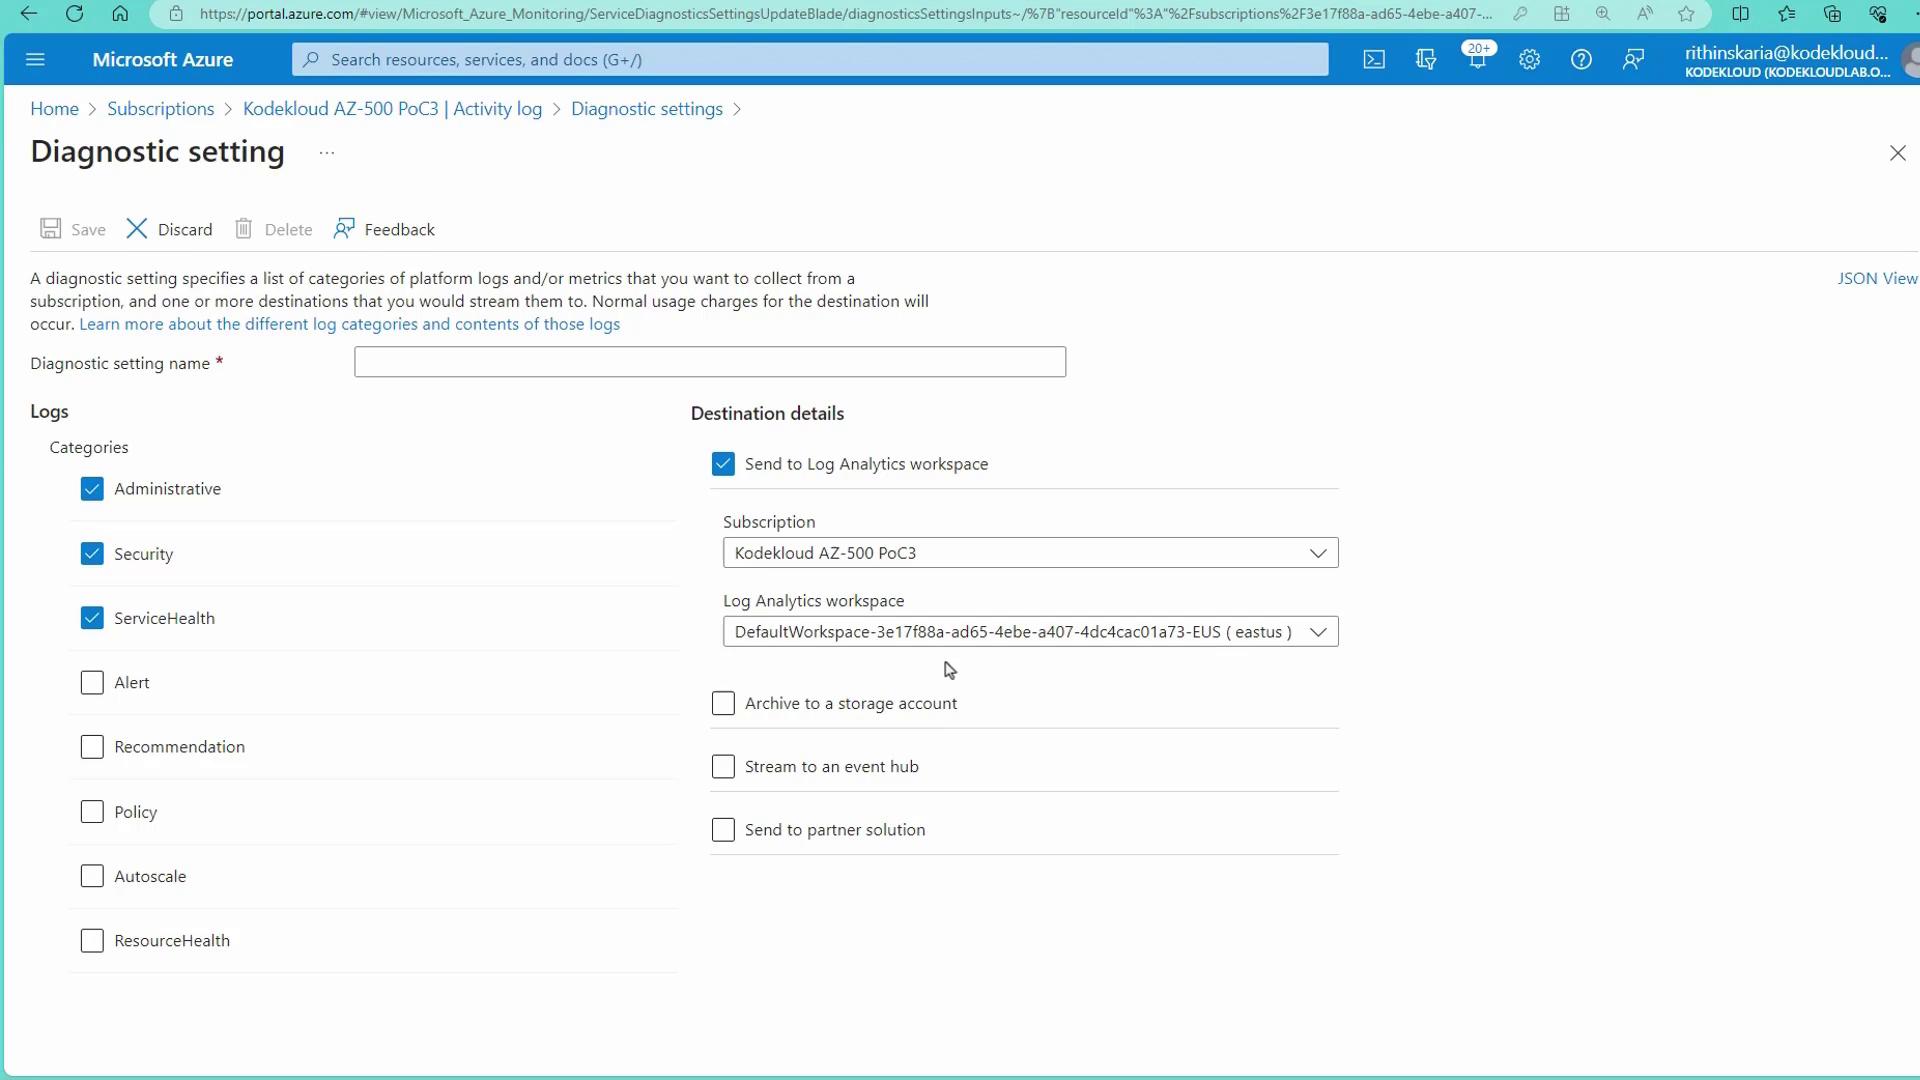
Azure Activity Logs are enabled by default with no additional setup required. They retain data for up to 90 days within the portal. For organizations needing longer retention periods (e.g., 180 days for compliance), logs can be exported to a storage account or sent to a Log Analytics workspace.

Querying Activity Logs

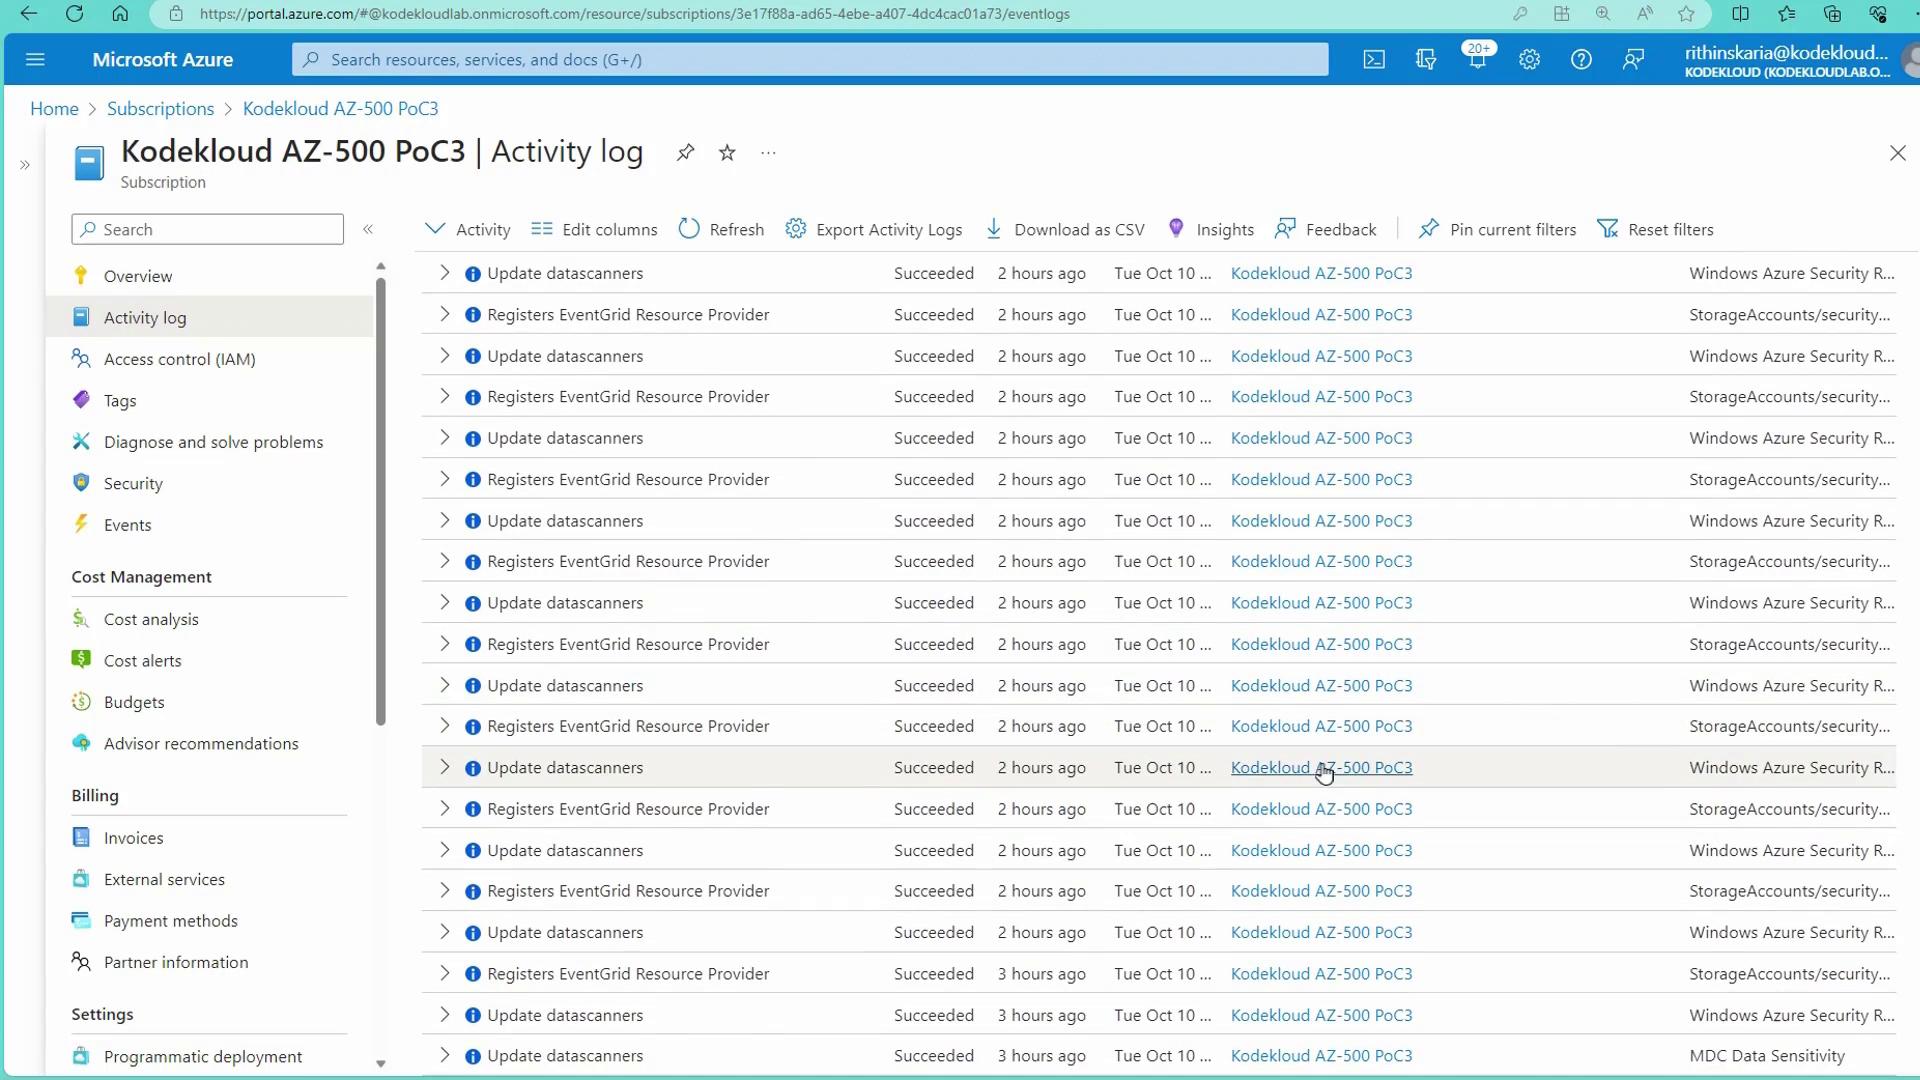
You can query Activity Logs directly from the Azure portal. The portal offers several filtering options including:

  • Subscription
  • Timespan
  • Severity
  • Resource group
  • Resource
  • Initiating user
  • Keyword search

This intuitive filtering allows you to view recent events without needing deep query language expertise. However, when querying older data stored in a Log Analytics workspace, familiarity with the query language is beneficial.

Position of Activity Logs in the Azure Resource Stack

Activity Logs sit above the Azure infrastructure but below the host virtual machine and guest operating system layers. This means that internal events within a guest OS (for example, Windows events) are not captured in the Activity Logs. Instead, these logs record operations that directly interact with Azure’s infrastructure.

Viewing Metrics and Activity Logs in the Azure Portal

In the Azure portal, you can access both operational metrics and activity logs for your resources. For instance, when you navigate to a virtual machine and select the "Monitoring" section, you can view platform metrics. Clicking on "See all metrics" opens the Metrics Explorer, where you can compare metrics like CPU usage and available memory.
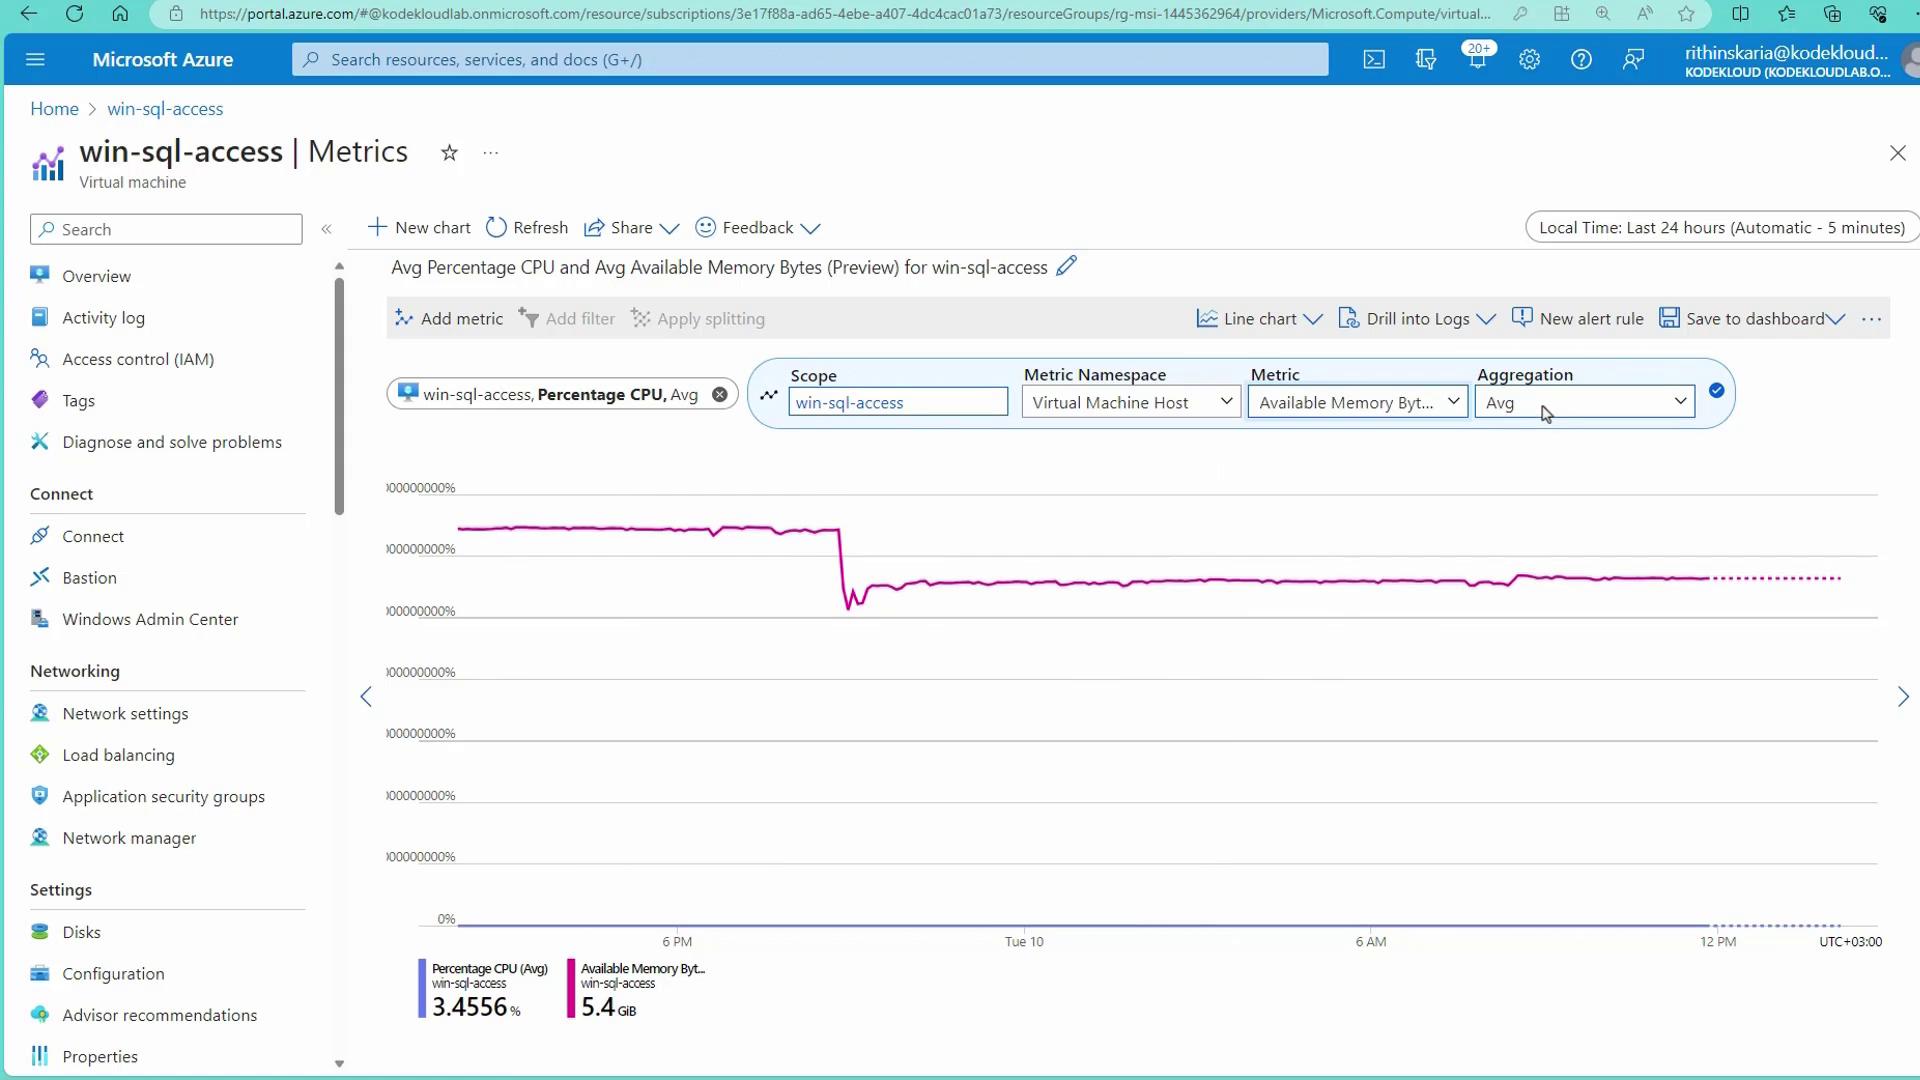
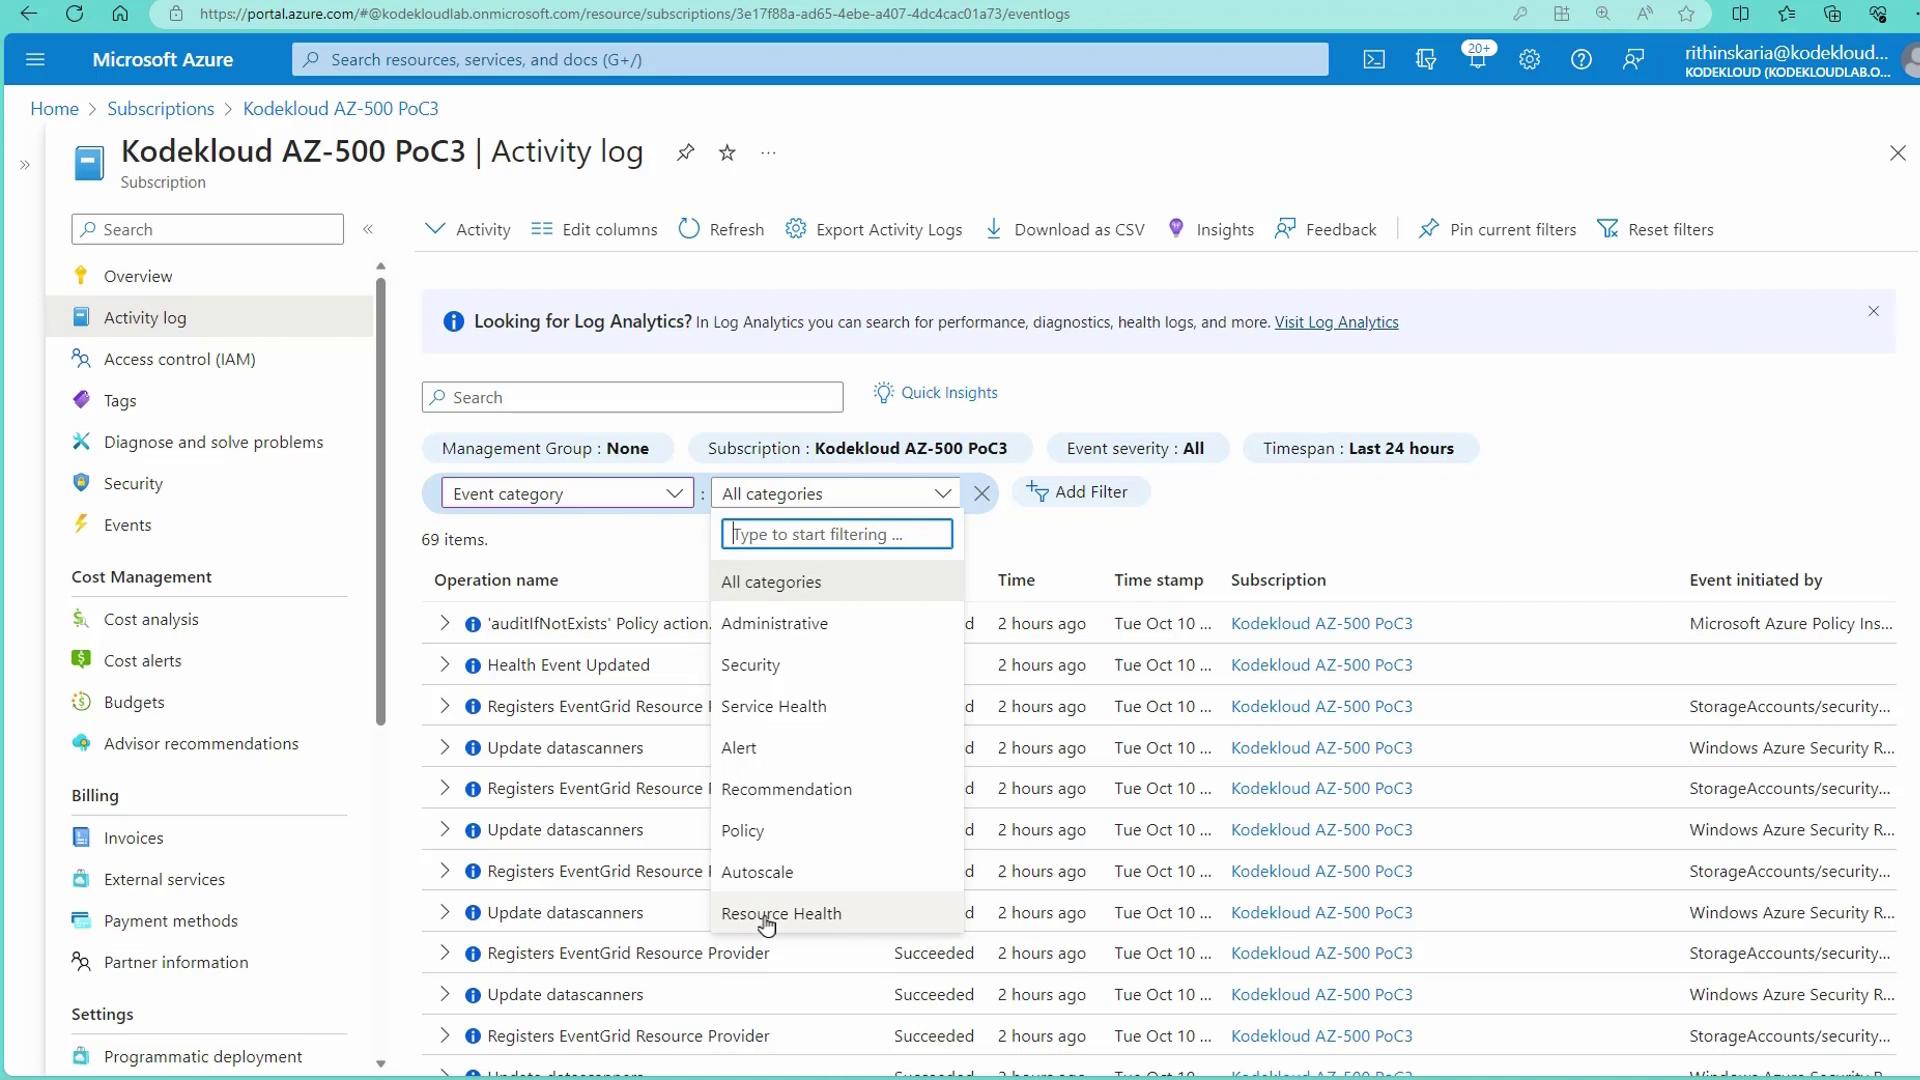
The image shows a Microsoft Azure metrics dashboard for a virtual machine named "win-sql-access," displaying a line chart of average CPU percentage and available memory bytes over time. The chart indicates a drop in available memory at one point, with current values of 3.4556% CPU usage and 5.4 GiB available memory.

Access the "Activity Log" blade from any resource to inspect scoped events. When viewed at the subscription level, it provides a comprehensive log of all activities, including details about who initiated each action.

The image shows an activity log from the Microsoft Azure portal, listing various activities such as "Update datascanners" and "Registers EventGrid Resource Provider," all marked as succeeded.

Adjust the timeframe (e.g., last 6 hours, 24 hours) and apply filters such as resource group, resource, or specific operations (like create or update VM events). The "Event Severity" filter further refines logs based on their importance, and you can filter by event categories as needed.

Event Categories

Azure Activity Logs categorize events into several types:

CategoryDescription
AdministrativeActions performed by users, service principals, or accounts.
SecurityAlerts from Microsoft Defender for Cloud.
Service HealthInformation on Azure service health.
RecommendationSuggestions from Microsoft Azure Advisor.
PolicyPolicy-related actions (e.g., deny, audit, or deploy if not exists).
Auto ScaleActivities related to auto scaling.
Resource HealthEvents pertaining to the health of specific resources.

For example, filtering the logs by administrative events or searching by your email address under "Event initiated by" displays all actions you have taken within a specified timeframe.

The image shows the activity log page of a Microsoft Azure subscription, displaying various operations and filters for event categories.

If further analysis is required, Activity Logs can be exported as CSV files. To extend retention beyond 90 days, use the "Export Activity Logs" option and configure diagnostic settings to send logs to a Log Analytics workspace or a storage account, based on your compliance requirements.

The image shows a Microsoft Azure portal page for configuring diagnostic settings, where various log categories can be selected and sent to a Log Analytics workspace. Options for archiving to a storage account, streaming to an event hub, and sending to a partner solution are also available.

Working with Azure Monitor Alerts

Azure Monitor Alerts complement Activity Logs by enabling proactive surveillance of resource events. The diagram below summarizes the integration of Activity Logs with alerting, auditing, retention, and querying across various resource types (both compute and non-compute):

The image is a diagram of the Azure Activity Log, showing components like subscription-level logging, auditing, retention, and querying data, along with application and resource logs. It categorizes logs into compute and non-compute resources.

Integrated Monitoring

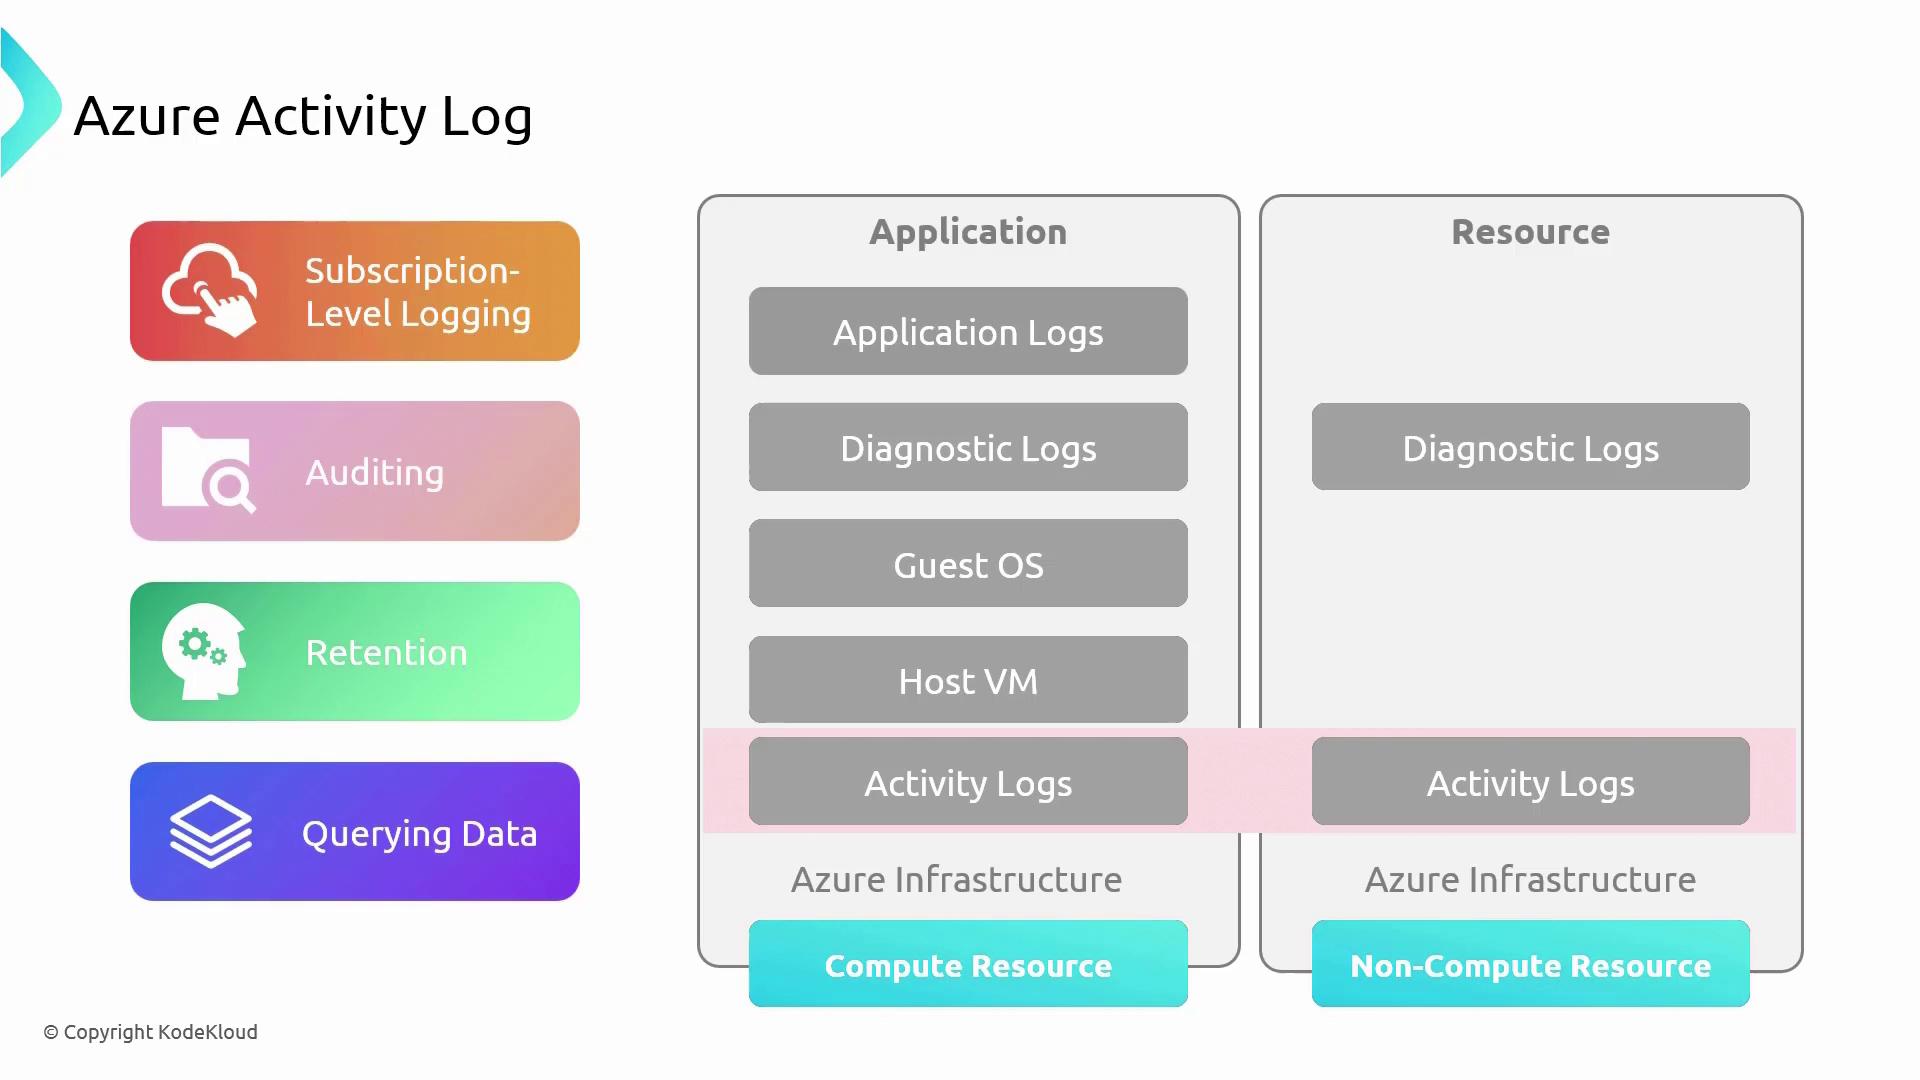
This integrated approach enhances your ability to track and manage resource operations effectively across your entire subscription.

Summary

This article details how Azure Activity Logs capture interactions with the Azure Resource Manager, outlines methods to view and query these logs using the Azure portal, and explains how to extend log retention to meet organizational compliance needs.

For more detailed information, you may refer to Microsoft Azure Documentation.

Watch Video

Watch video content

Previous
Azure Monitor