Azure Monitor Architecture
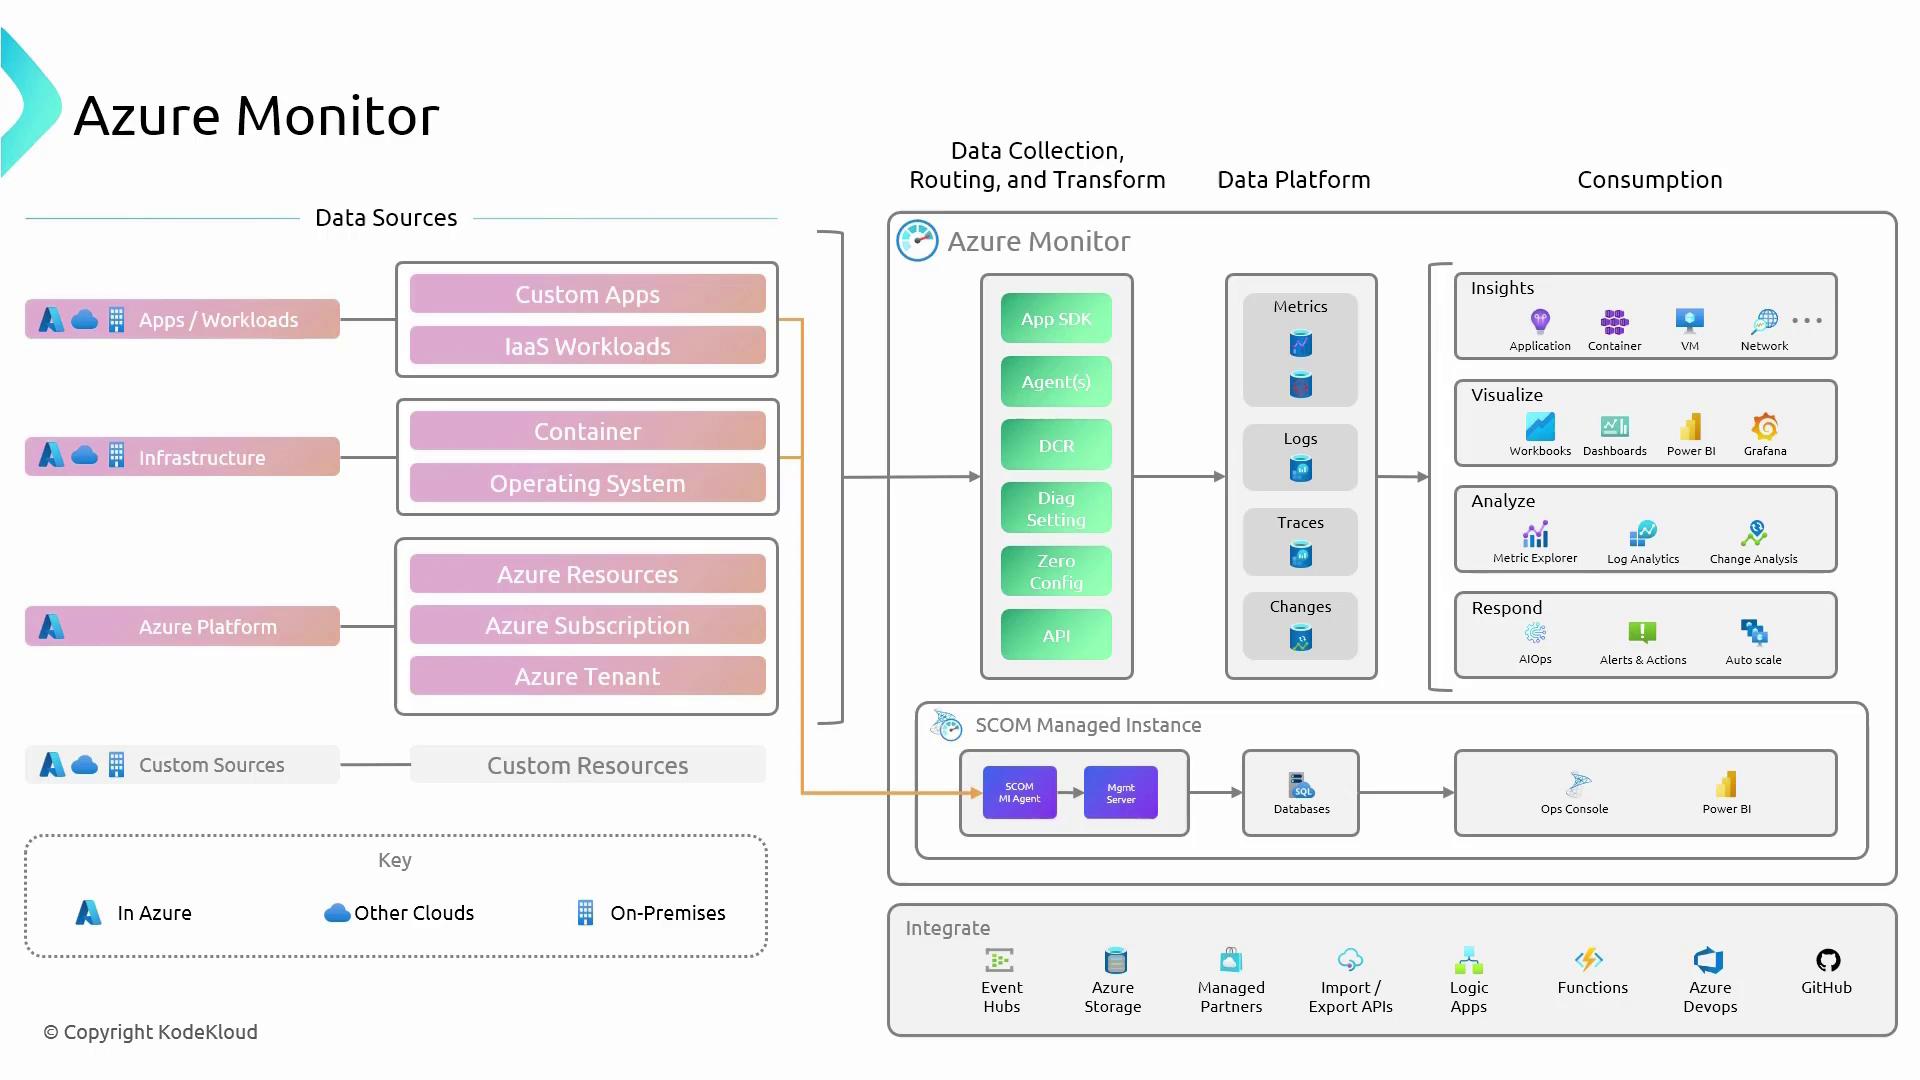
Azure Monitor’s architecture is designed to efficiently collect and process vast amounts of telemetry data through a series of structured stages. The process begins at the data sources and continues through data collection, processing in the data platform, and finally, data consumption where insights, visualization, analysis, and response come into play.Data Sources
Monitoring starts at the data source level, where Azure Monitor collects data from multiple origins:- Applications and Workloads: Telemetry from applications running in Azure, other clouds, or on-premises.
- Infrastructure Components: Metrics and logs from virtual machines, networks, and other infrastructure components.
- Azure Platform: Built-in telemetry from Azure services.
- Custom Sources: User-configured sources that capture specialized data.
Data Platform
At the core of Azure Monitor lies the Data Platform, serving as the centralized repository for all telemetry data. The platform categorizes data into several types:- Metrics: Numerical values representing system states at specific time intervals.
- Logs: Timestamped records that detail operations and state changes.
- Traces: In-depth insights into application code execution.
- Change Data: Records that trace modifications in Azure resource configurations.
Data Consumption
Once processed, the telemetry data is made available for various consumption methods to generate actionable insights and responses:- Insights: Detailed performance and health metrics for applications, containers, virtual machines, and network resources.
- Visualization: Interactive representations using workbooks, dashboards, Power BI, and Grafana.
- Analysis: Advanced examination with tools like Metrics Explorer and Log Analytics.
- Response: Automated alerts, autoscaling actions, and AI-driven operational responses through features like AIOps.
In this article, the focus will be on two crucial components of Azure Monitor for exam preparation: metrics and logs.
Metrics
Metrics within Azure Monitor are numerical data points collected at regular intervals that provide a near real-time snapshot of resource performance and health. Examples of common metrics include CPU usage and network traffic, which help in monitoring the operational efficiency of virtual machines and other resources without the need for complex configuration. Metrics are typically rendered as time series, offering frequent updates that present an accurate view of system performance.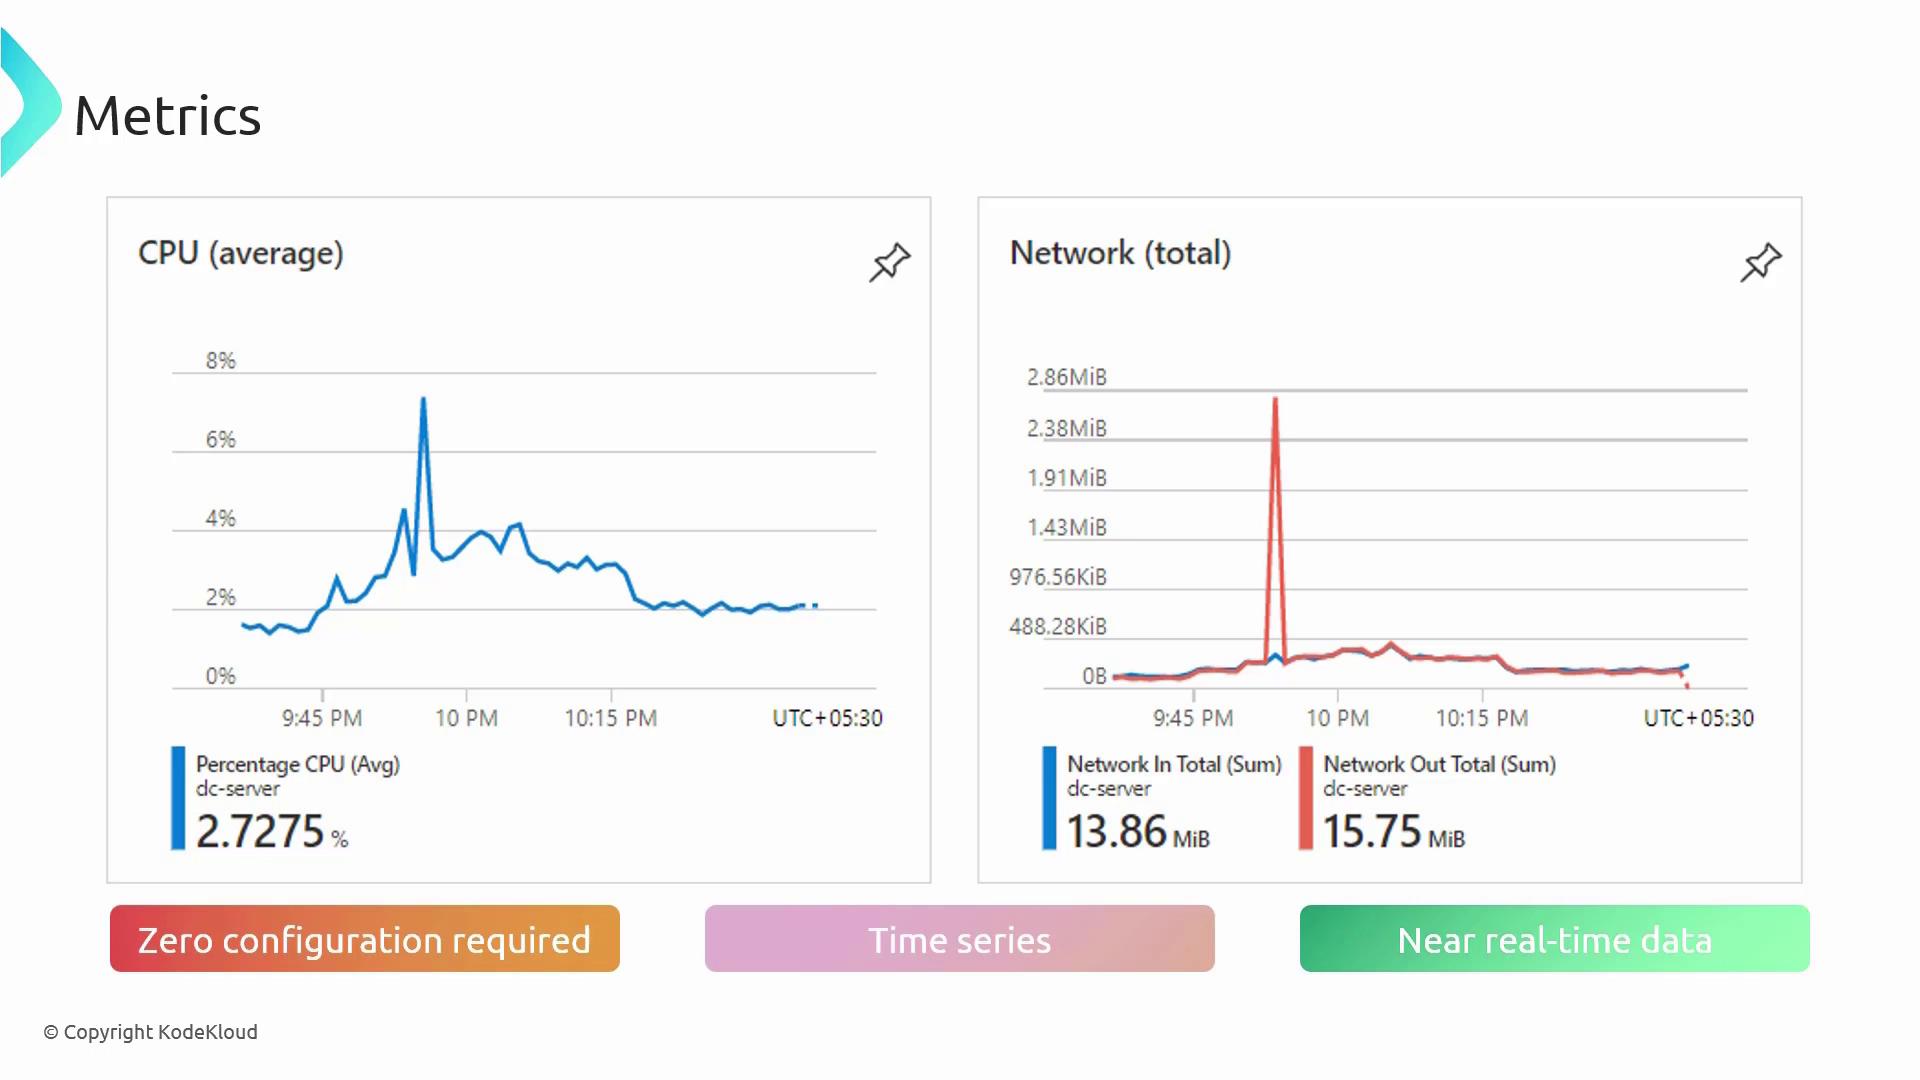
Logs
Logs in Azure Monitor are a vital resource for diagnosing issues, understanding system behavior, and performing comprehensive analyses. Unlike metrics, logs capture a range of data types and provide descriptive context. Each log entry consists of fields such as the timestamp, resource identifiers, and event details, allowing for efficient search and filtering. A powerful tool for exploring logs is the Kusto Query Language (KQL). For instance, the following KQL snippet filters log data for specific events:Data Sources Relevant for the Exam
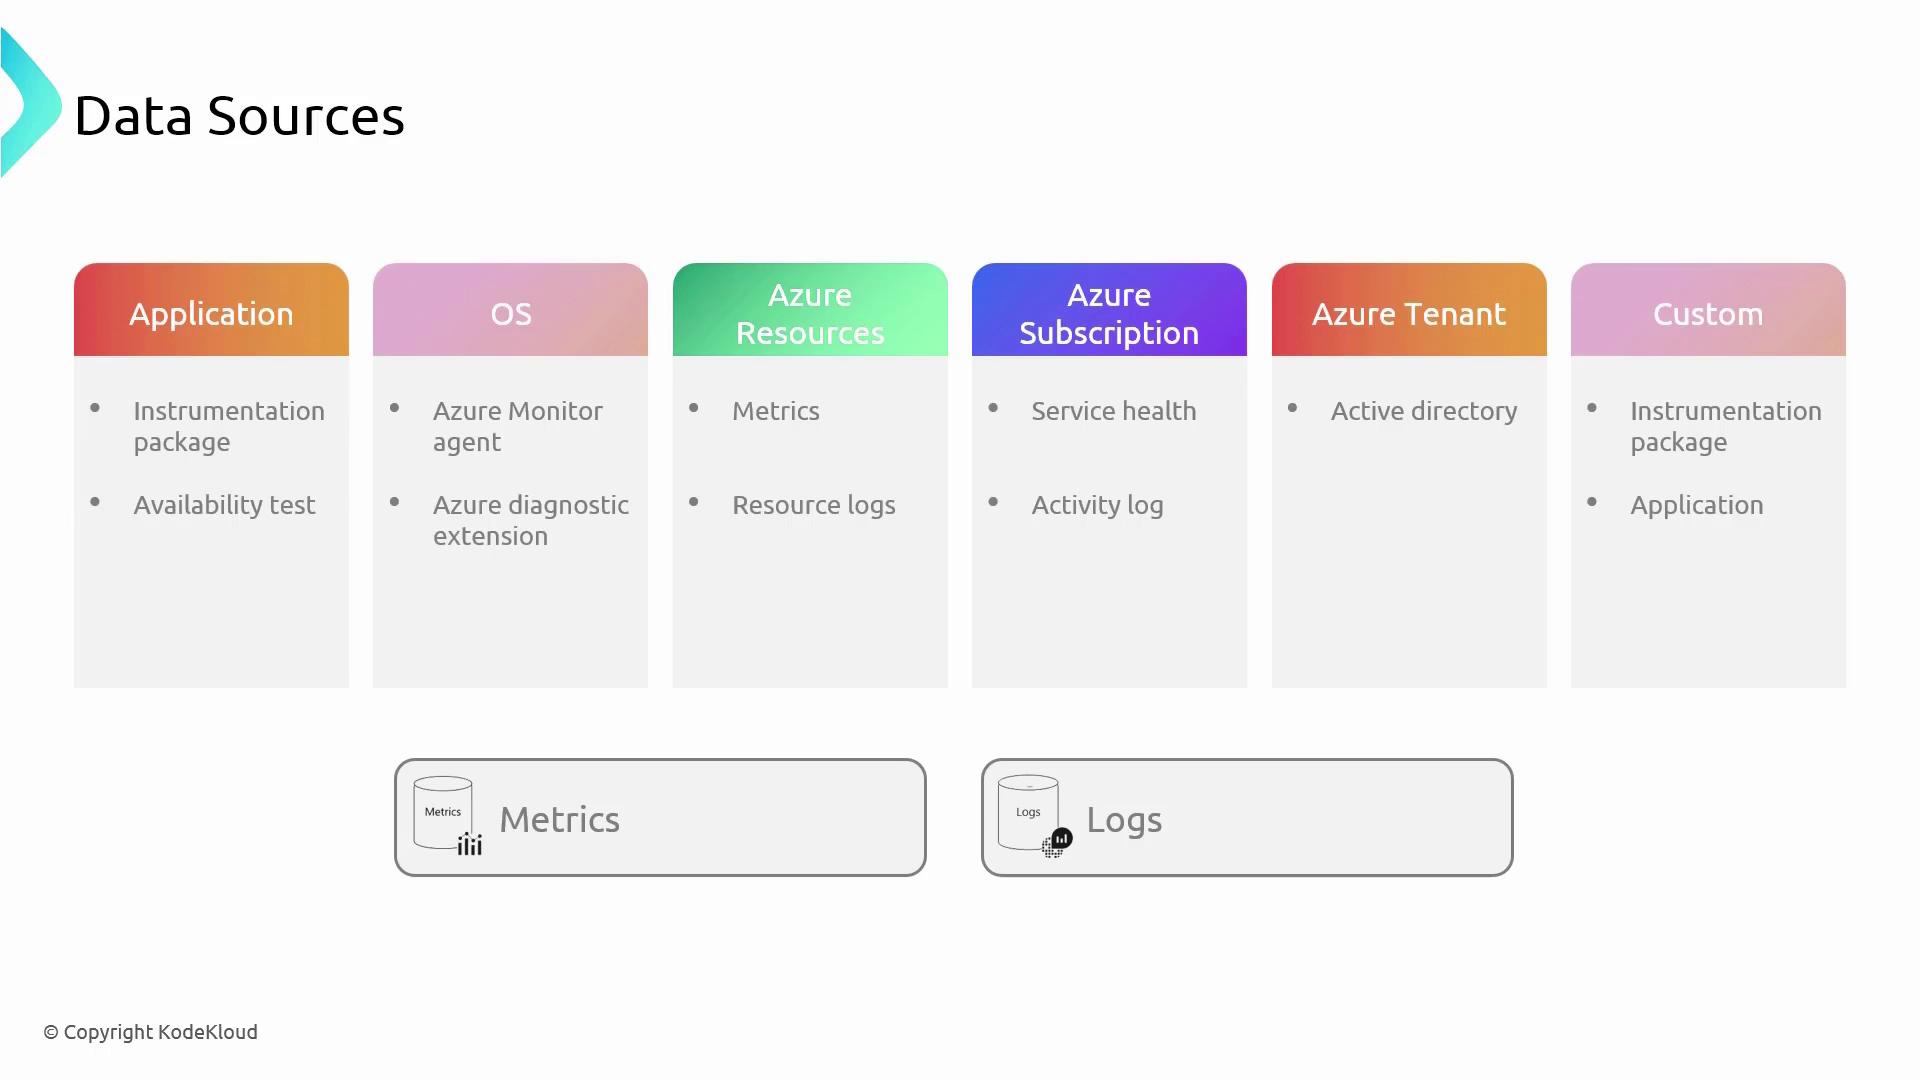
Azure Monitor ingests data from several critical sources, each contributing unique insights:| Data Source | Description | Key Components/Mechanisms |
|---|---|---|
| Application | Telemetry from applications via instrumentation packages such as Application Insights and availability tests | Application performance, response times, exceptions |
| Operating System | Performance metrics and operational events collected from virtual machines using agents | Azure Monitor Agent, Diagnostics Extensions |
| Subscription | Activity logs that document subscription-level events including resource creation, updates, and deletions | Activity Log monitoring of resource changes |
| Azure Tenant | Logs from services such as Microsoft Entra ID (formerly Active Directory) that monitor user activities and security events | User authentication events, security alerts, policy changes |
| Custom Sources | Monitors additional customer-defined data such as specialized workloads or custom applications | Custom configuration using diagnostic settings and agents |
Azure Activity Logs
Azure Activity Logs provide a comprehensive record of subscription-level events, including resource creation, updates, and deletions, as well as insights into service health. These logs are crucial for maintaining an overview of changes and activities within your Azure environment and ensuring that you can effectively troubleshoot and verify operations.This article has provided an overview of Azure Monitor’s architecture, highlighting the key components of metrics and logs essential for both operational insights and exam preparation.