[Updated] AZ-104: Microsoft Azure Administrator

Administer Monitoring

Azure Alerts

In this lesson, you will learn how to enable and configure Azure Monitor Alerts to stay informed of critical events in your Azure subscription. Azure Monitor Alerts provide a unified experience for creating notifications on various data sources such as activity logs, service health events, Log Analytics queries, and metrics.

The image shows an Azure Monitor Alert dashboard with a list of critical alerts related to "Missing Assessment Data," all marked as fired and new. The dashboard displays a total of 24 critical alerts within the past 24 hours.

Azure Monitor Alerts work consistently across all resource types by classifying alerts by severity (from 0 to 4), categorizing them based on user responses (new, acknowledged, or closed), and integrating seamlessly with action groups. Action groups allow you to customize your notification and automation preferences—whether it’s email, SMS, voice calls, or triggering automated workflows using services like Automation Accounts, Function Apps, Logic Apps, or webhooks.

Key Benefit

Using Azure Monitor Alerts ensures that you receive timely notifications, making it easier to manage and remediate issues before they impact your production workloads.

Below are the four key stages for creating an alert rule:

1. Scope

The Scope defines the resources that the alert will monitor. Similar to Azure RBAC or Azure Policy, you can include one or more resources in your alert. This flexibility is particularly useful when creating alerts for activity logs or log query results.
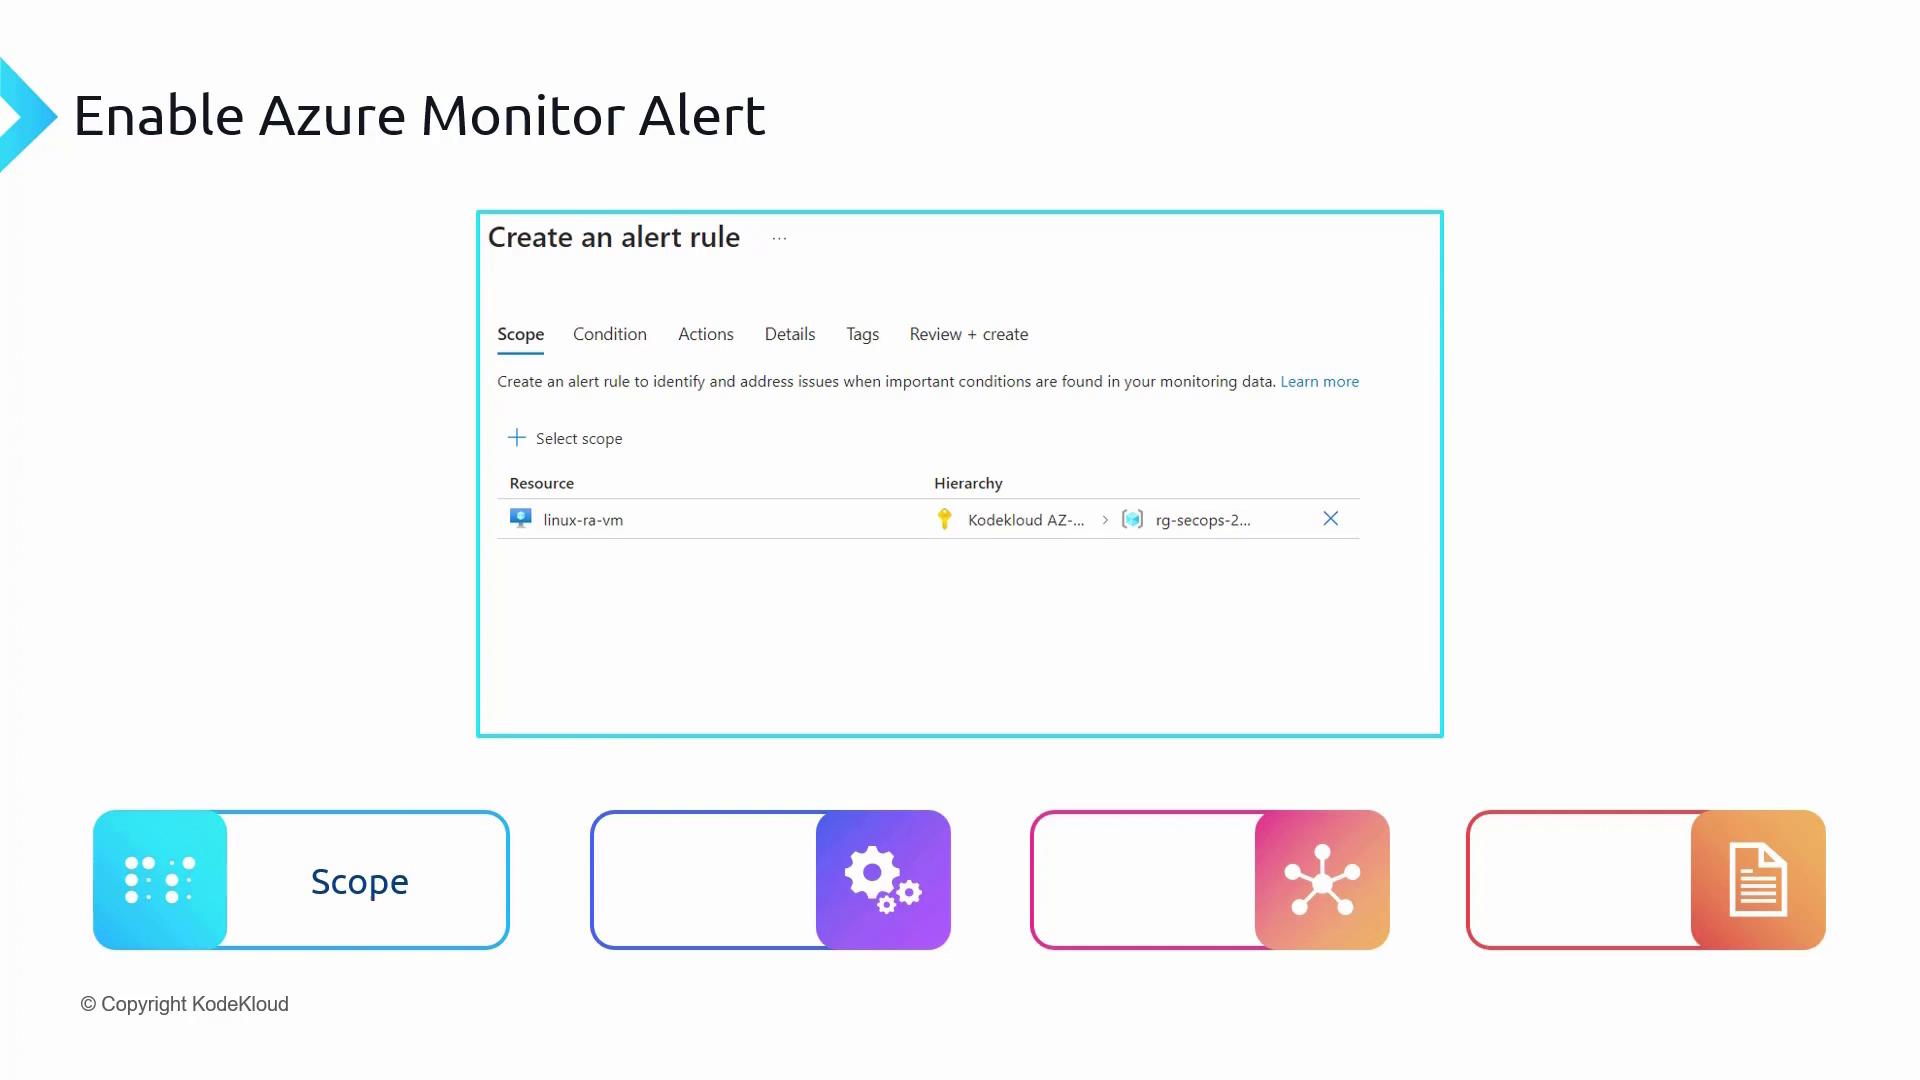
The image shows a screenshot of the "Create an alert rule" interface in Azure Monitor, focusing on setting the scope for an alert. Below are icons representing different steps in the alert creation process.

2. Condition

In the Condition step, you define the signal and the criteria that will trigger the alert. For example, you can set up a condition where an alert is fired if the percentage CPU utilization exceeds 80%.
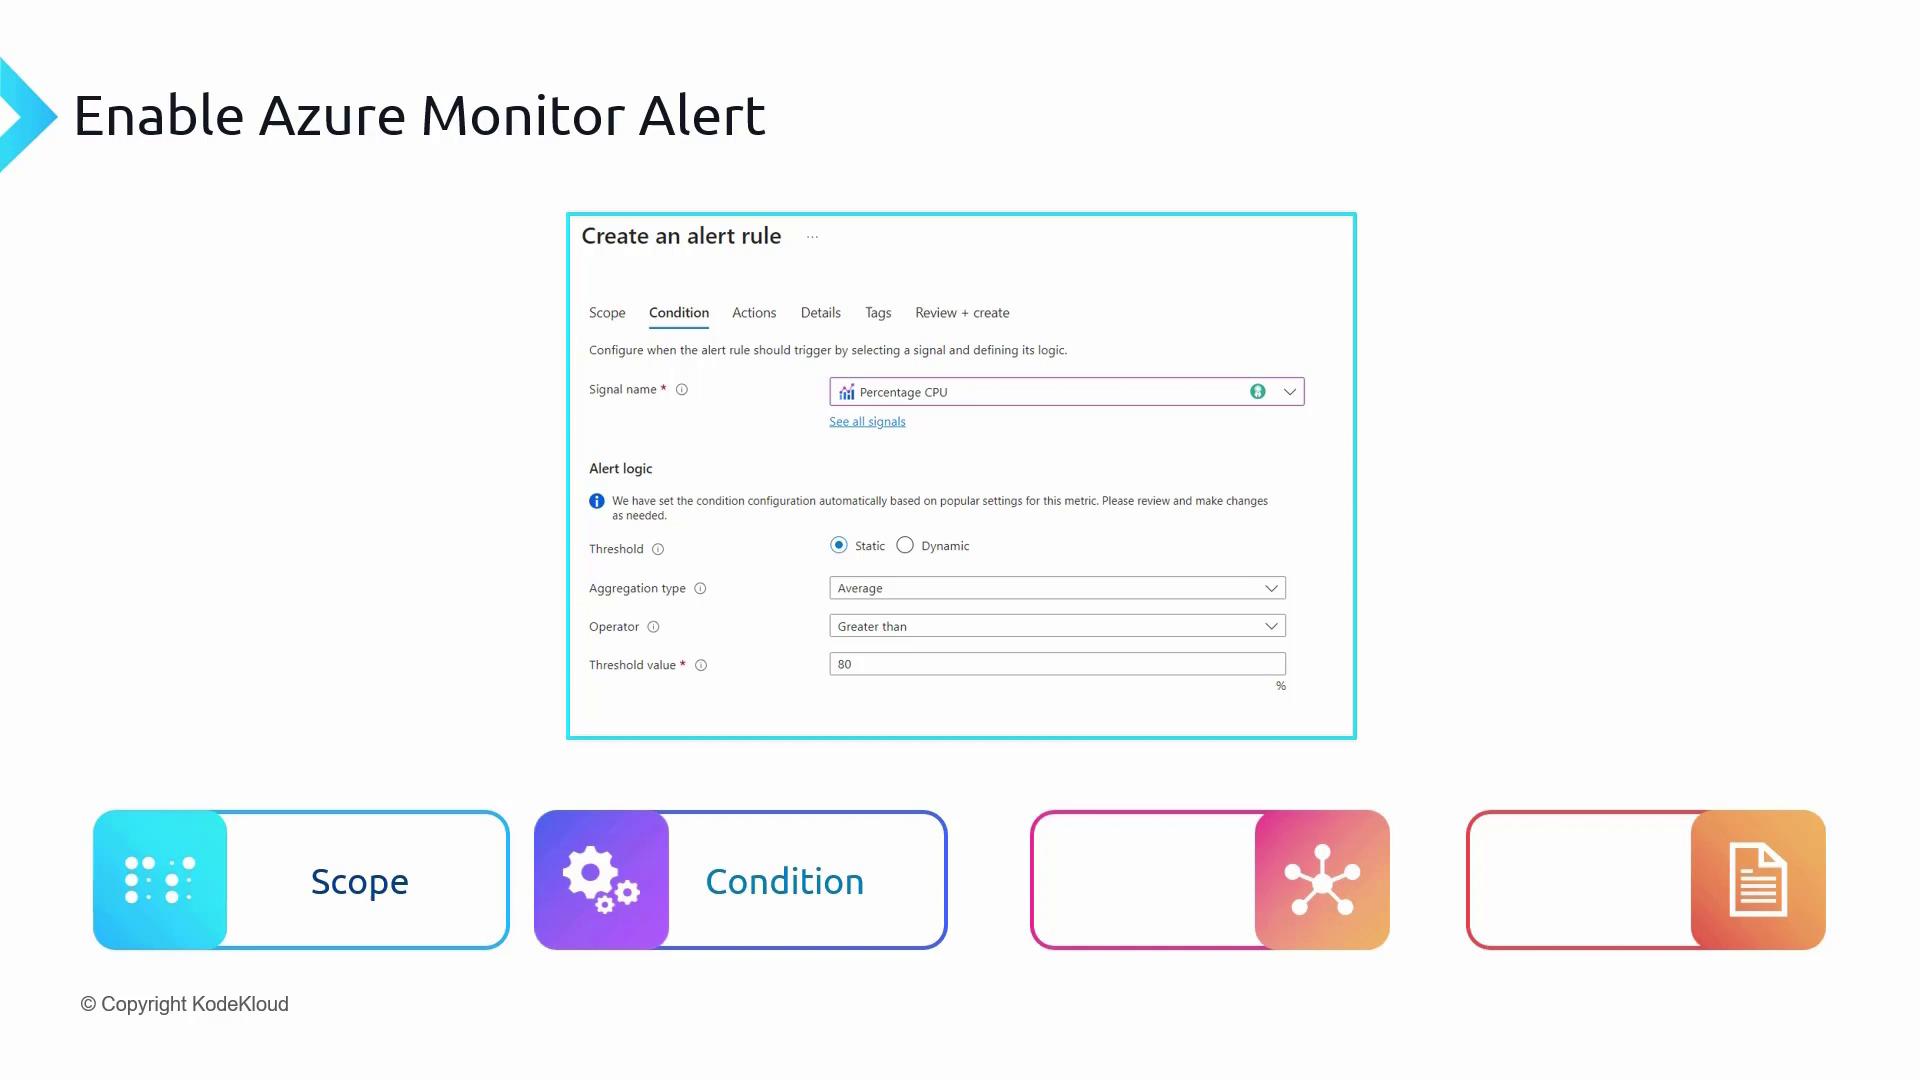
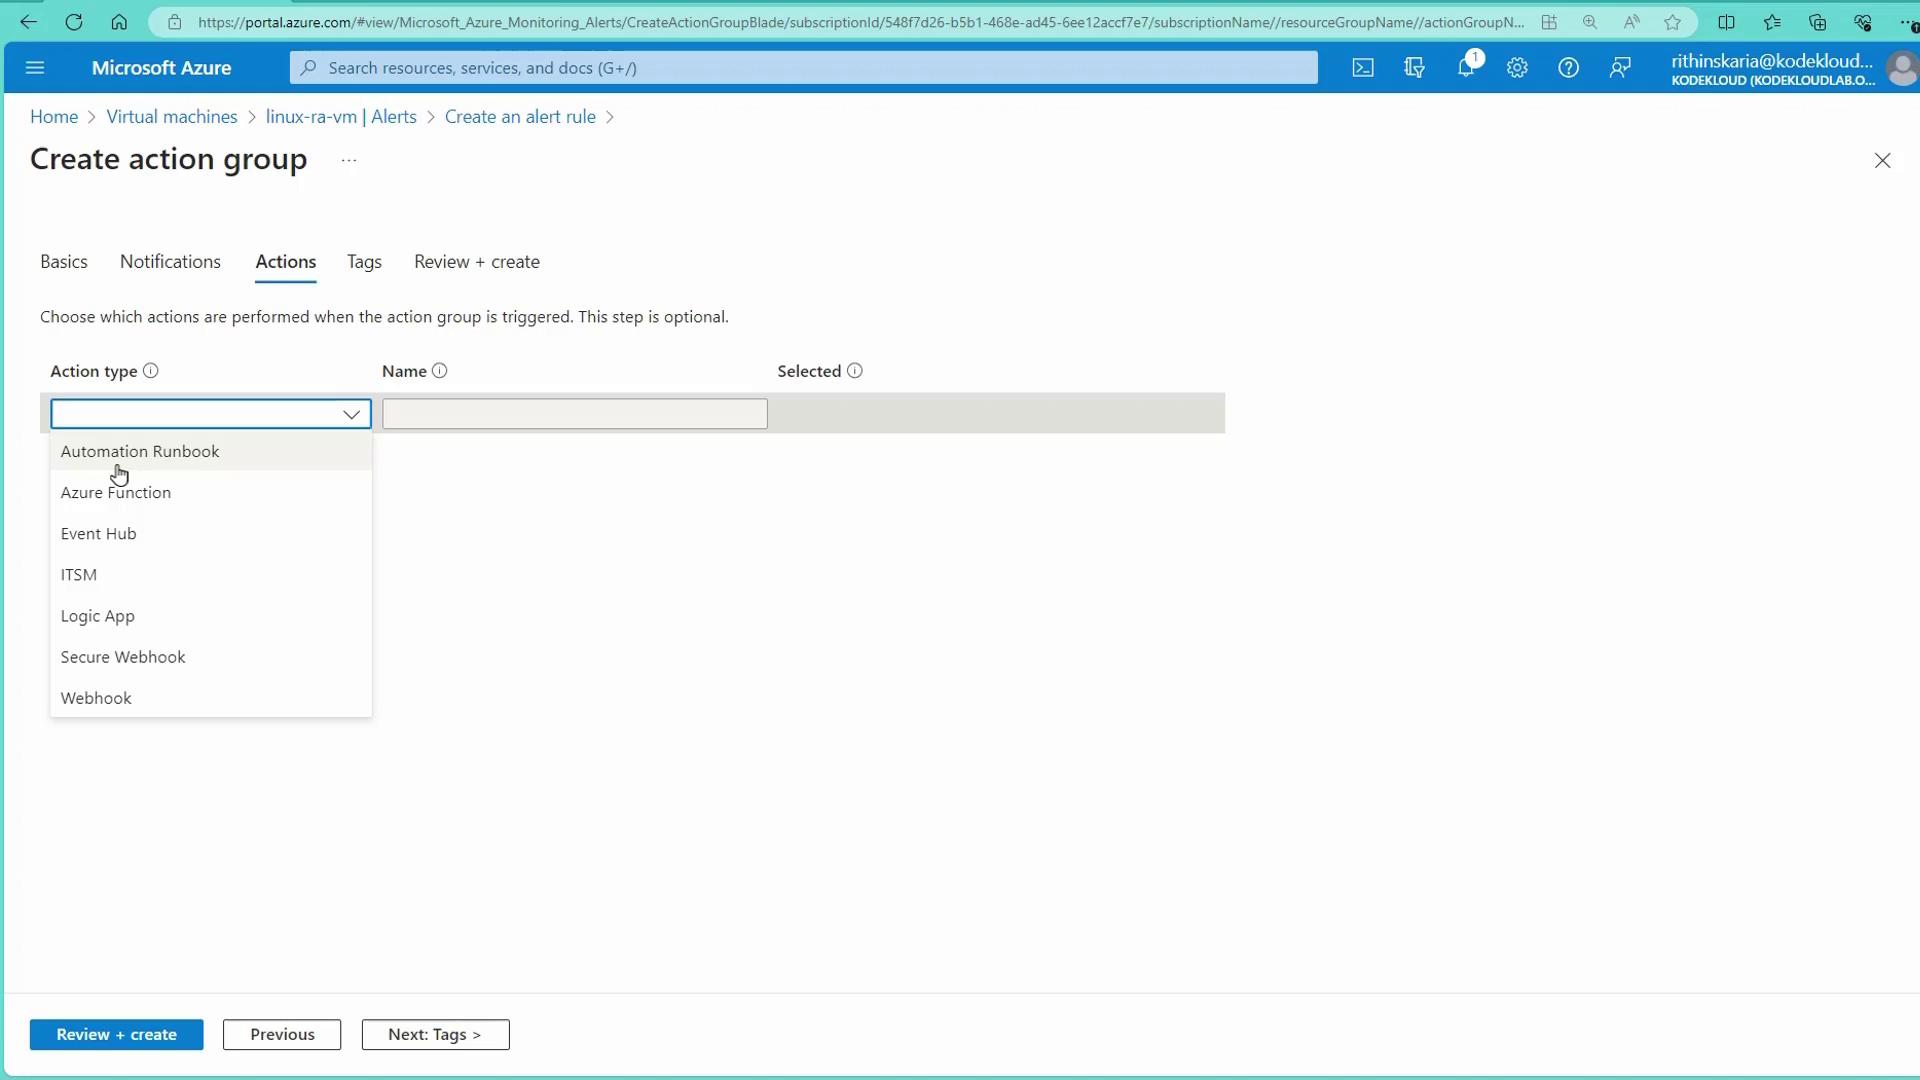
The image shows a setup screen for creating an Azure Monitor alert rule, focusing on configuring conditions like signal name and alert logic. Below, there are labeled icons for "Scope," "Condition," and other steps in the alert creation process.

3. Action

The Action stage involves selecting the action group that determines what happens when an alert fires. Action groups let you configure various notification options (such as email, SMS, push notifications, or voice calls) and automation options (including Automation Runbook, Azure Function, ITSM connectors, etc.). You can even set up multiple action groups for a single alert rule.
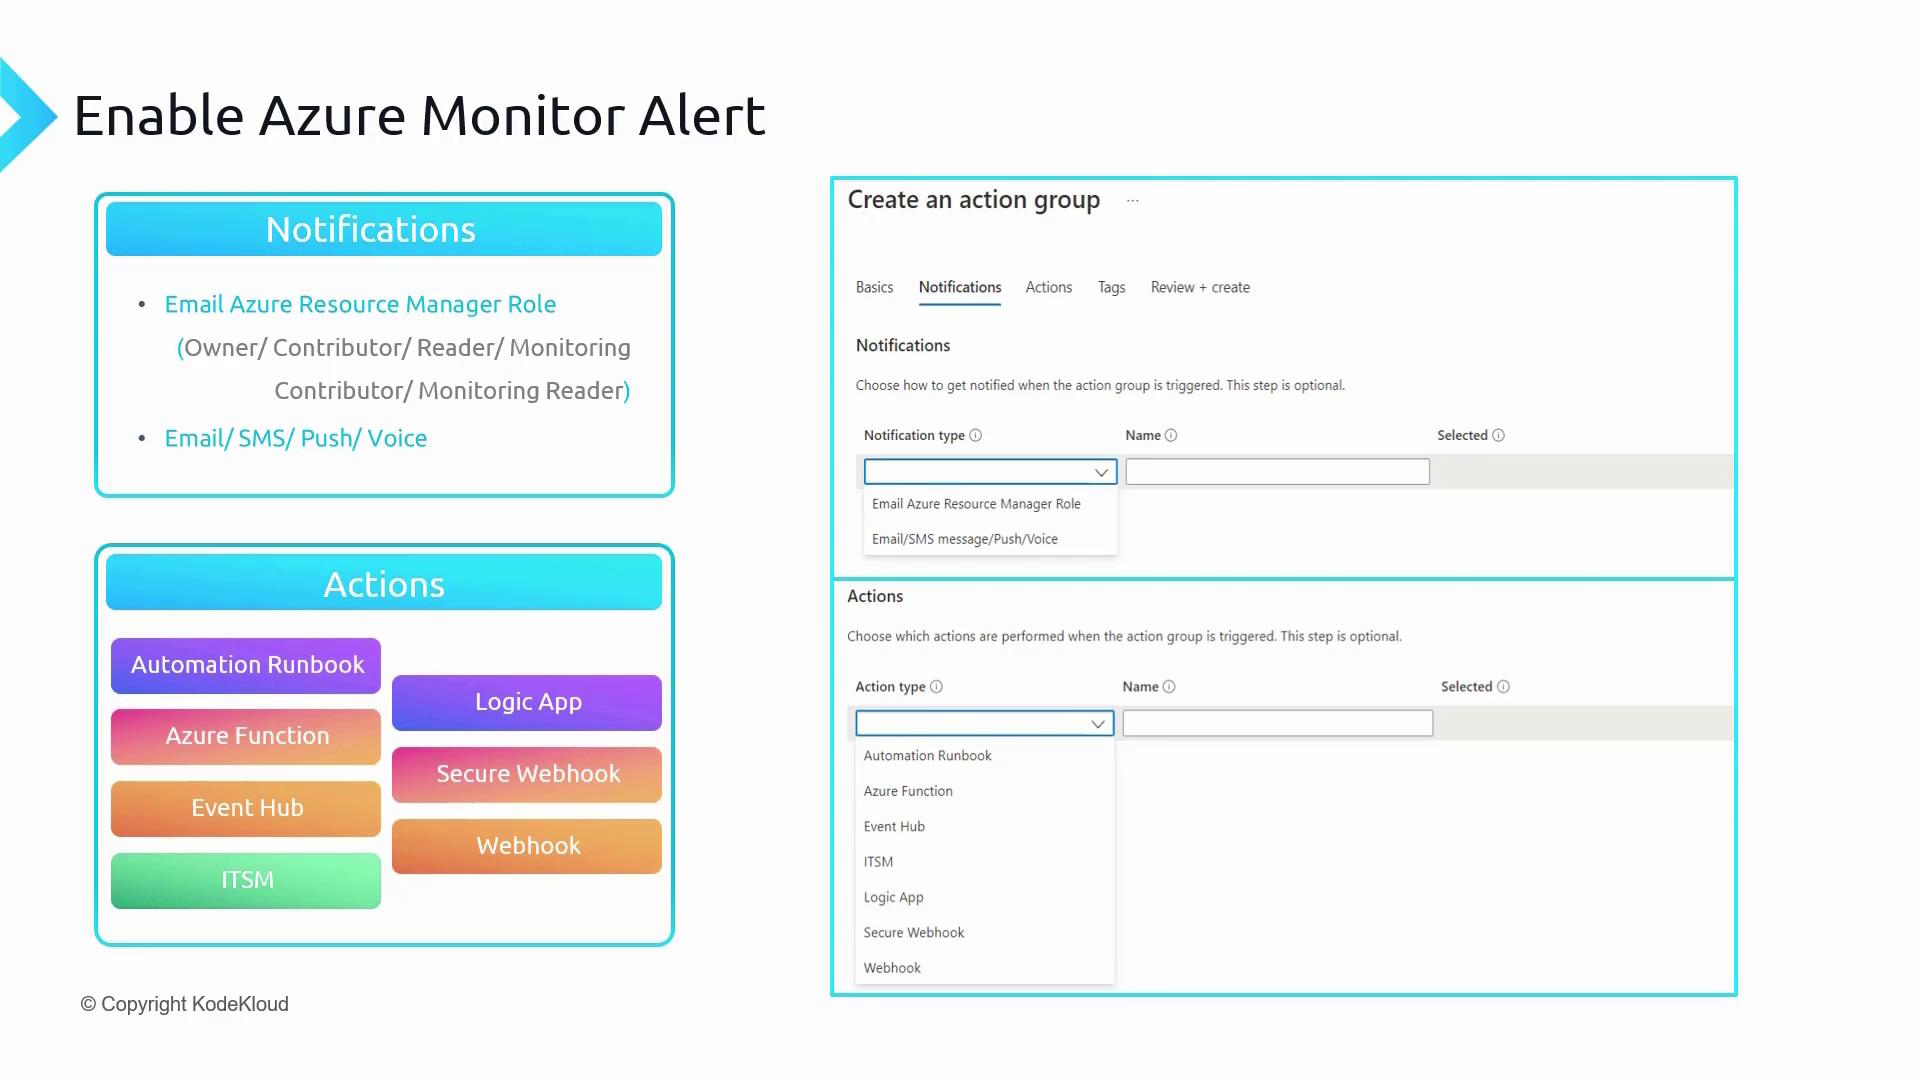
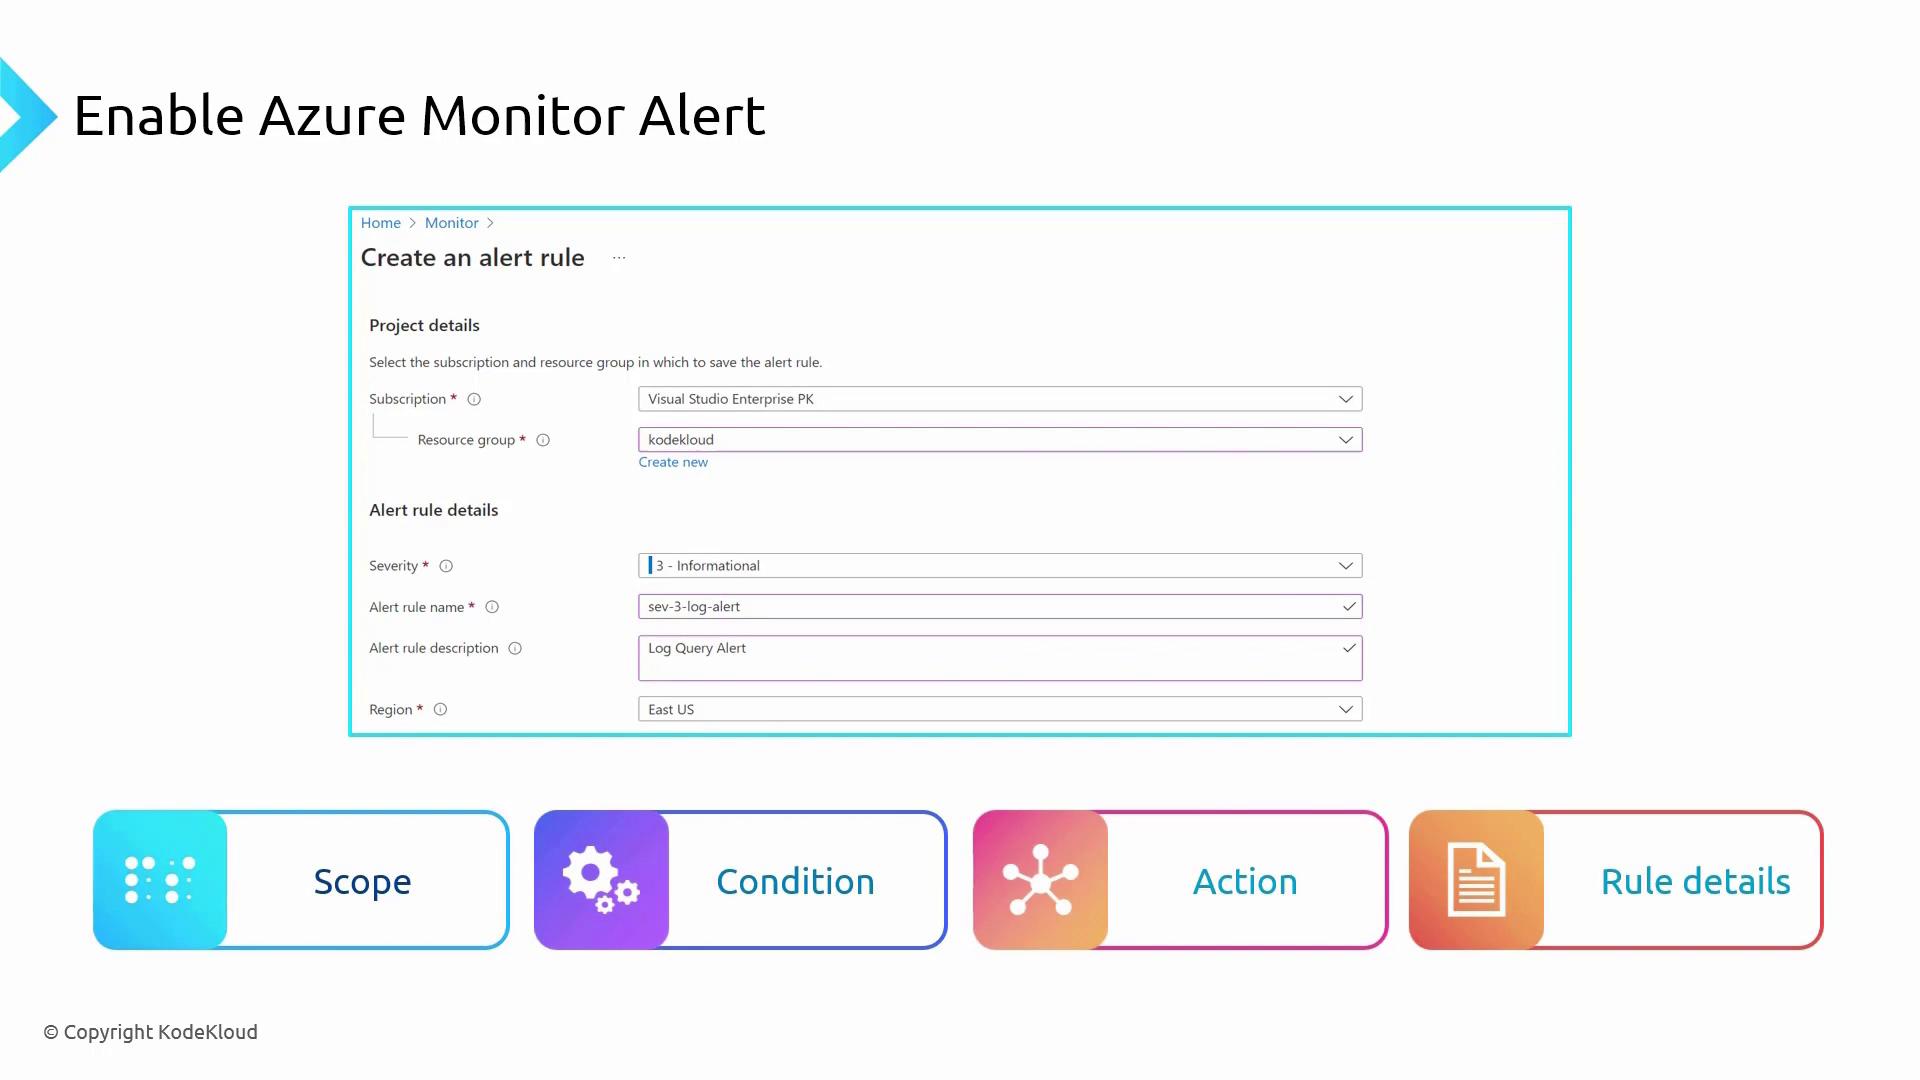
The image is a guide on enabling Azure Monitor Alerts, showing options for setting up notifications and actions, including email, SMS, and various Azure services like Automation Runbook and Logic App.

4. Rule Details

In the Rule Details step, you provide essential information such as the alert rule’s name, description, and severity. This metadata is used in notifications to help you prioritize and manage alerts effectively.

Once configured, Azure Alerts integrates tightly with action groups, offering flexibility in notifying Azure Resource Manager roles (such as owner, contributor, or reader) or directing alerts to specific email addresses. You can also automate responses by invoking an Automation Runbook, calling a webhook, or integrating with ITSM systems.


Creating an Alert Rule in the Azure Portal

Follow these steps to create an alert for a Log Analytics workspace:

  1. Open the Log Analytics Workspace:
    Navigate to your Log Analytics workspace and select the Logs section.

  2. Run a Query:
    Execute a query, like the one below, to check App Service HTTP logs for the last 25 minutes:

    AppServiceHTTPLogs
    | where TimeGenerated > ago(25m)
    | count
    

    In this scenario, the scope (the Log Analytics workspace) is predefined. If your query returns a result (e.g., 51 requests), you can set a threshold (such as 100 requests in 25 minutes) to trigger the alert.

    The image shows a Microsoft Azure interface for creating an alert rule, where users can set parameters like dimensions, alert logic, and evaluation frequency.

For activity log alerts, you can apply filters for events such as the creation of a web app. Simply click the available action to create a new alert rule, and Azure will preconfigure the alert settings based on your selection.


Creating Alerts for Virtual Machines

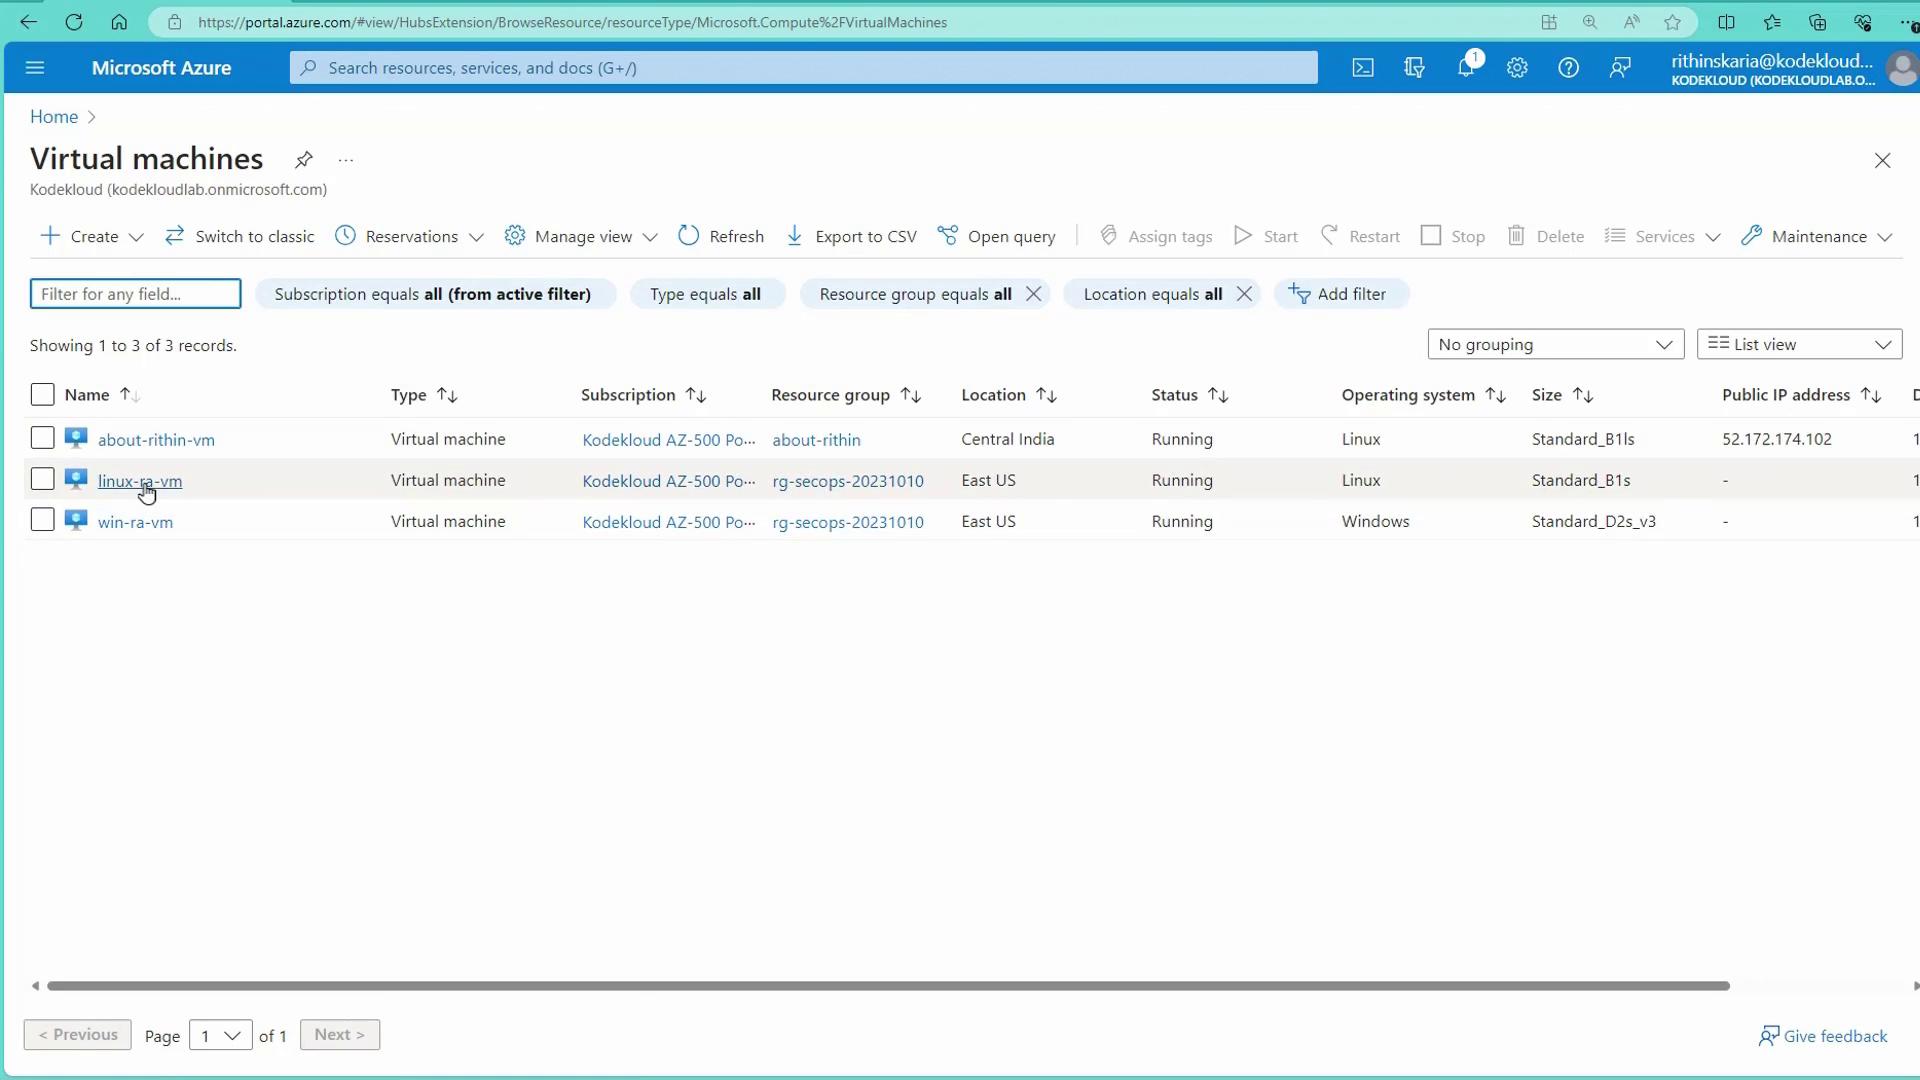
Setting up alerts for virtual machines is essential for monitoring production servers. The following instructions use CPU usage as an example metric:

  1. Navigate to Virtual Machines:
    In the Azure Portal, go to Virtual Machines and select a Linux machine.

    The image shows a Microsoft Azure portal interface displaying a list of virtual machines, including details like name, type, subscription, location, status, operating system, and public IP address.

  2. Create the Alert Rule:
    Click on the Alerts blade or select Create a custom alert rule. The system automatically selects the current resource; you can add resources, such as Windows machines if needed.

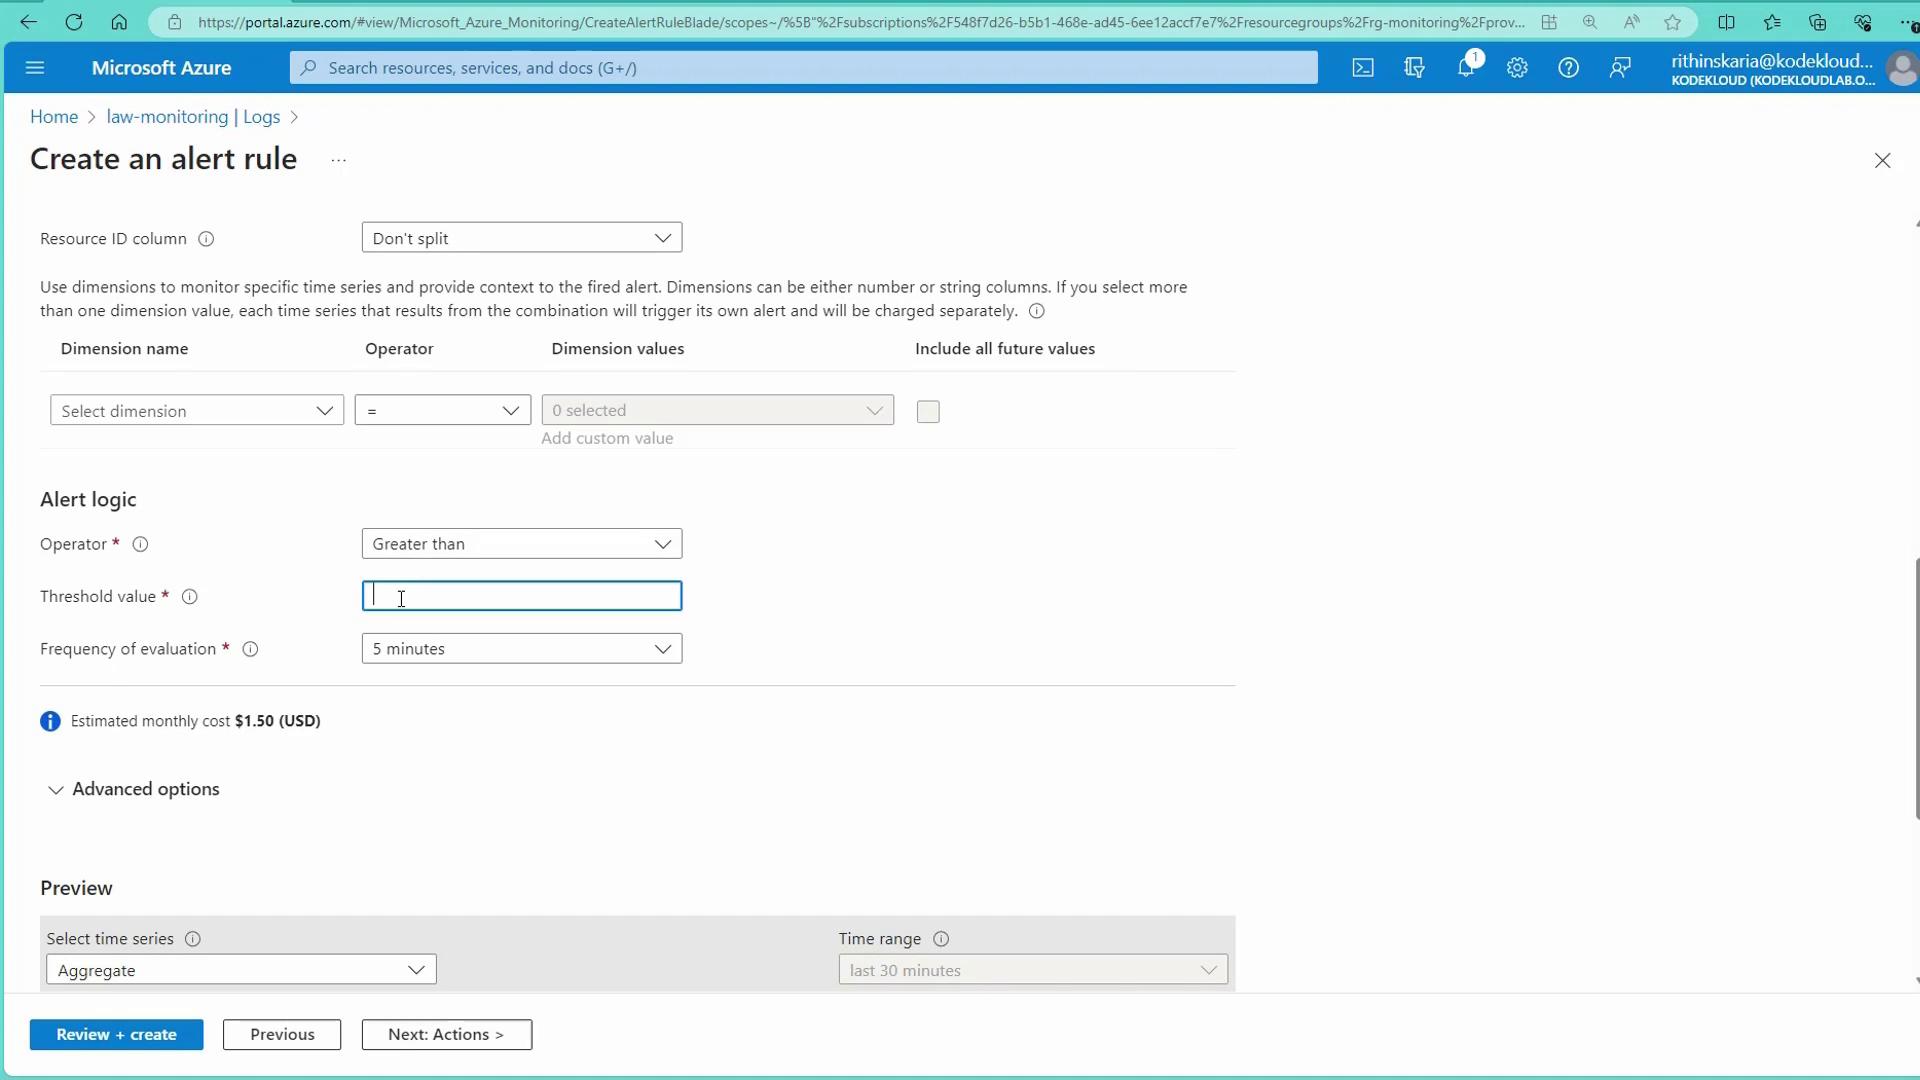
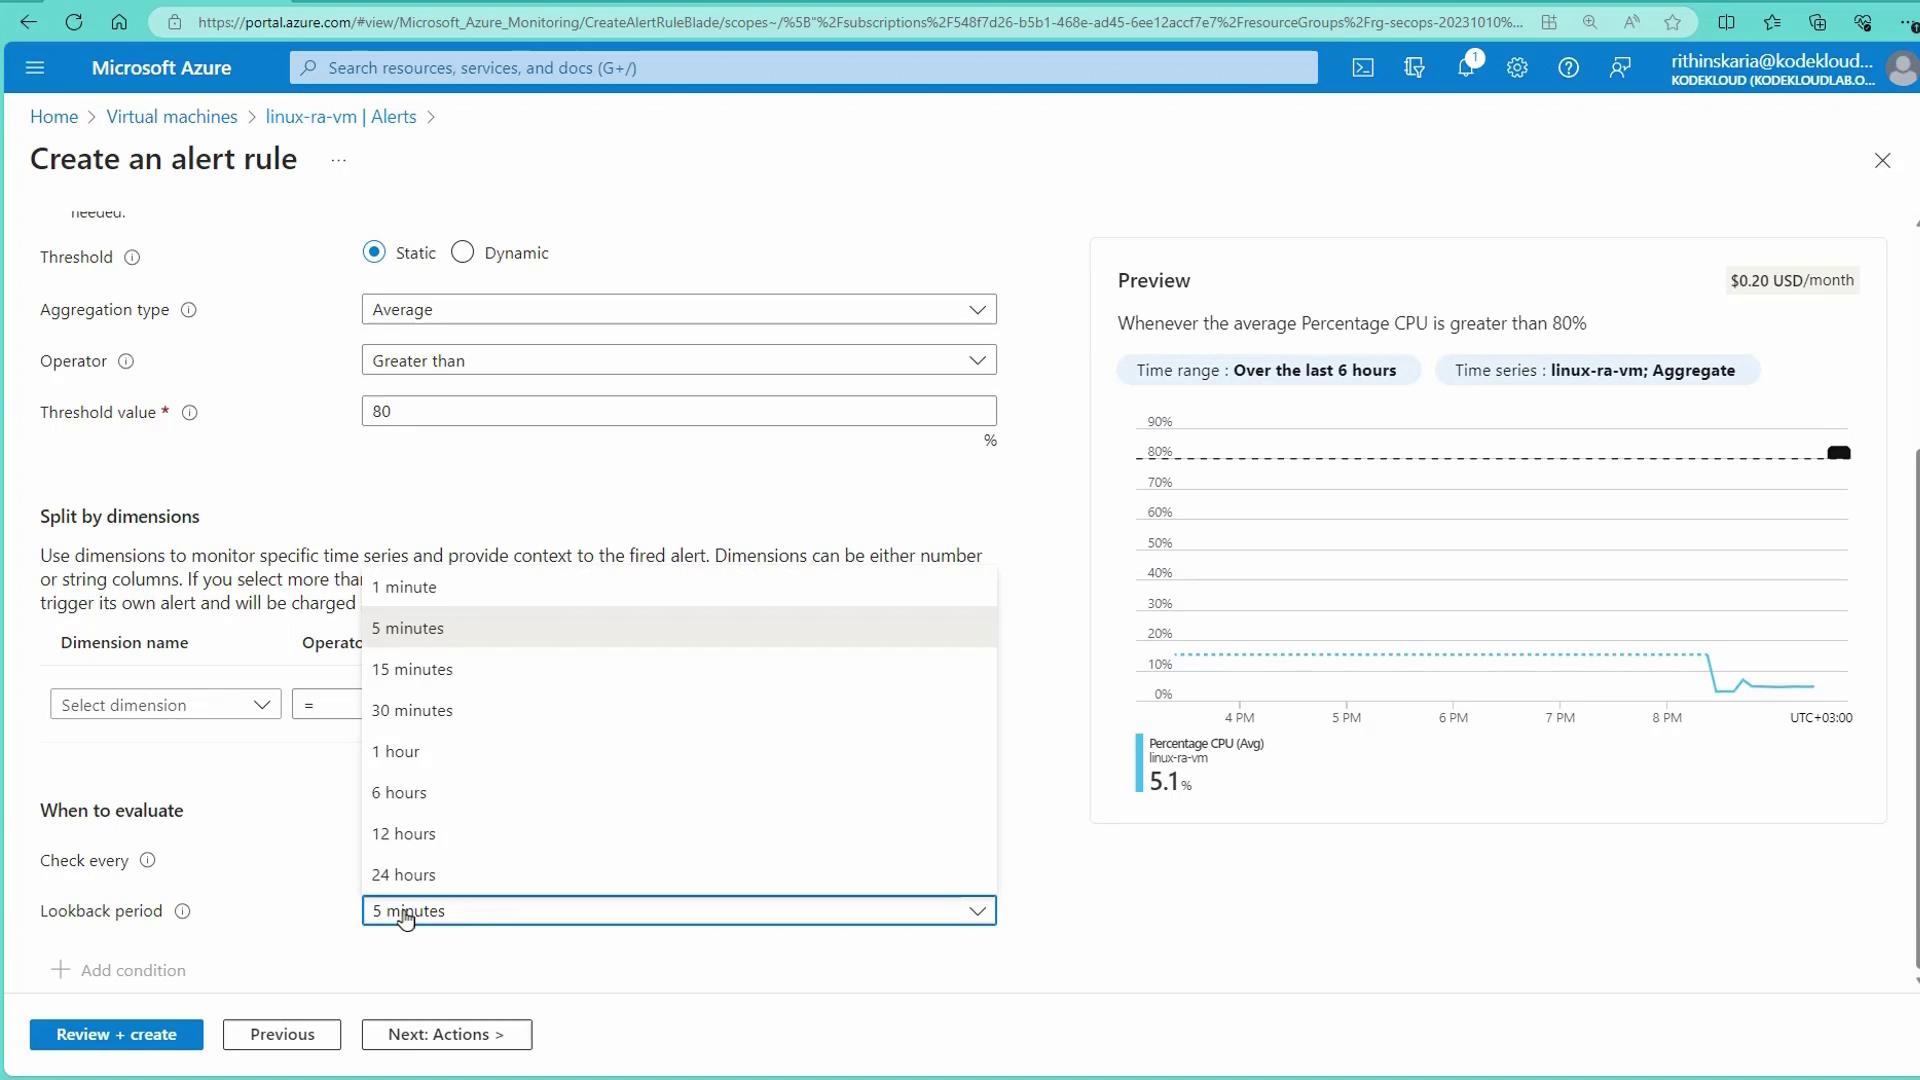
  3. Define the Condition:
    Under Condition, choose the appropriate metric, for instance, Percentage CPU. You can opt for static thresholds or dynamic ones—the latter adjusts to usage patterns to minimize false positives. For demonstration purposes, set a static threshold where the average CPU utilization over five minutes exceeds 80%.

    The image shows a Microsoft Azure interface for creating an alert rule, with settings for threshold, aggregation type, and time range. A preview graph displays CPU usage over time, with a threshold set at 80%.

  4. Configure the Action:
    Under Action, either select an existing action group or create a new one (e.g., "VM notification"). This group should define how you want to be notified (email, SMS, push, voice) and any associated automation actions.
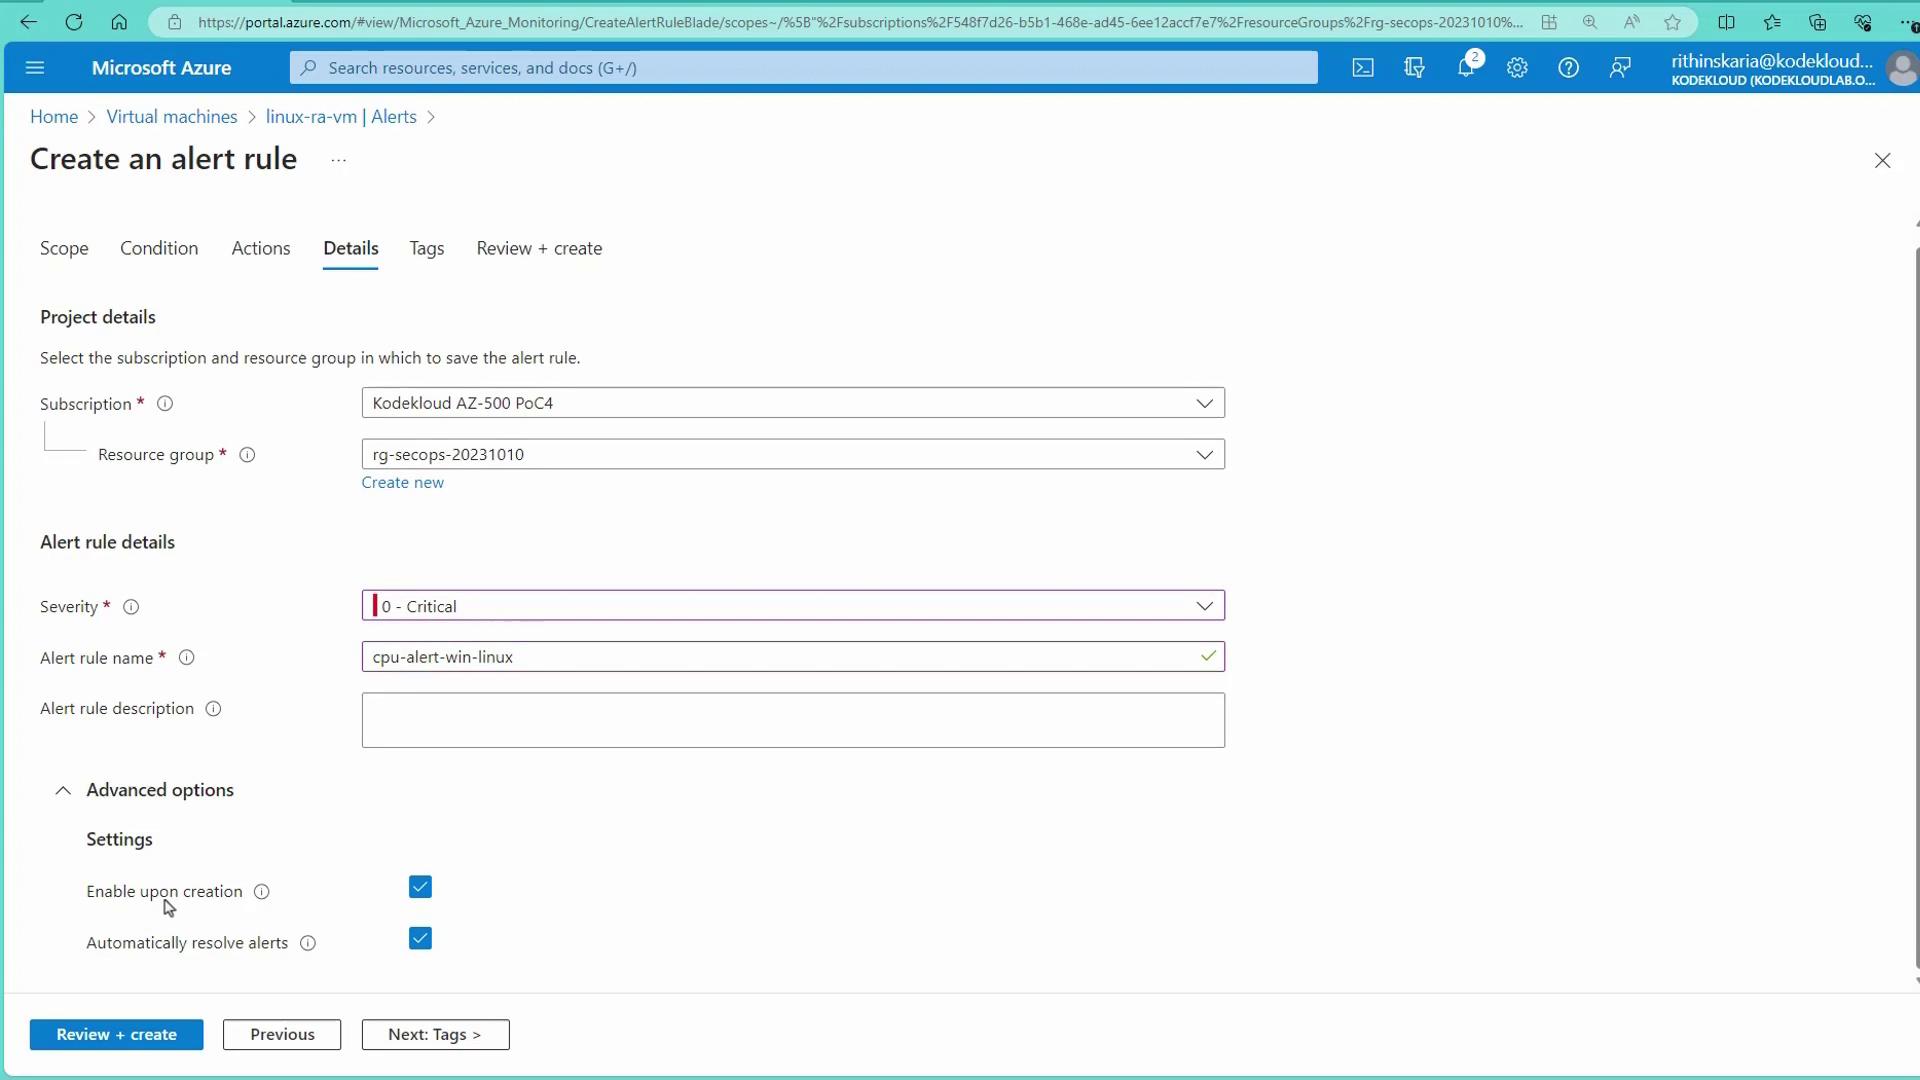
    The image shows a Microsoft Azure portal interface for creating an action group, with a dropdown menu for selecting an action type such as Automation Runbook, Azure Function, and others.

  5. Set Rule Details:
    In the Rule Details section, provide a relevant name (for example, "CPU Alert Metrics - Linux"), choose the severity level (e.g., Critical), and configure any advanced settings like immediate rule enabling.
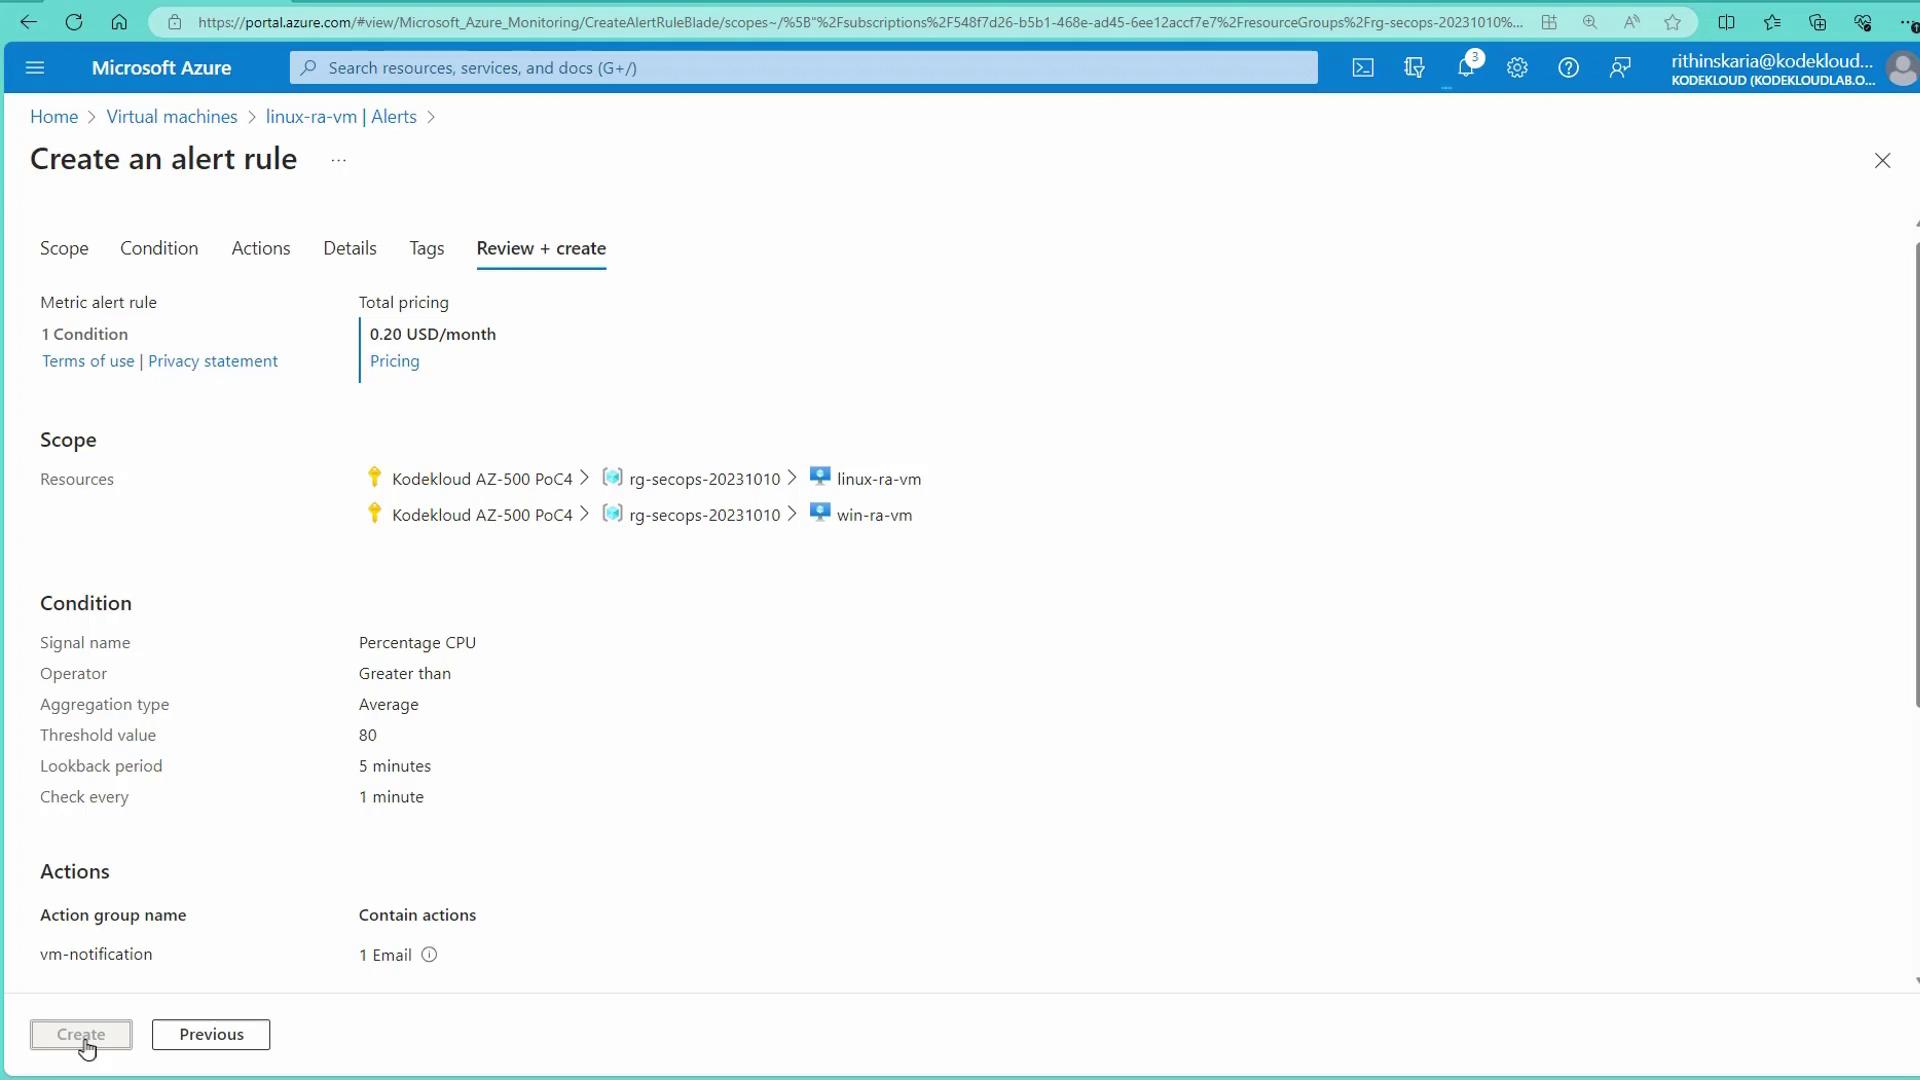
    The image shows a Microsoft Azure interface for creating an alert rule, specifically on the "Actions" tab, where an action group named "vm-notification" containing one email action is listed. There is also a section for adding custom properties to the alert rule.

  6. Review and Create:
    Click Review and Create to finalize your alert rule.

Testing in Production

Before testing alerts in a production environment, ensure you understand the potential impact on system performance when applying stress tests.

During testing, you can simulate high CPU load on your Linux VM using a stress program.


Testing the Alert Using a Stress Program

To verify that your alert fires correctly, follow these steps:

  1. Connect to the Linux VM via SSH:

    ED25519 key fingerprint is SHA256:5wQadLwZ9EGH97C4SMttl7t6T6GFEnsl20qwhVXz6wQ.
    Are you sure you want to continue connecting (yes/no/[fingerprint])? yes
    Warning: Permanently added '20.242.246.105' (ED25519) to the list of known hosts.
    Welcome to Ubuntu 22.04.3 LTS (GNU/Linux 6.2.0-1014-azure x86_64)
    ...
    kodekloud@linux-ra-vm:~$
    
  2. Update and Install the Stress Program:
    Ensure your system is up-to-date and install the stress tool if it isn’t already installed.

  3. Run the Stress Test:
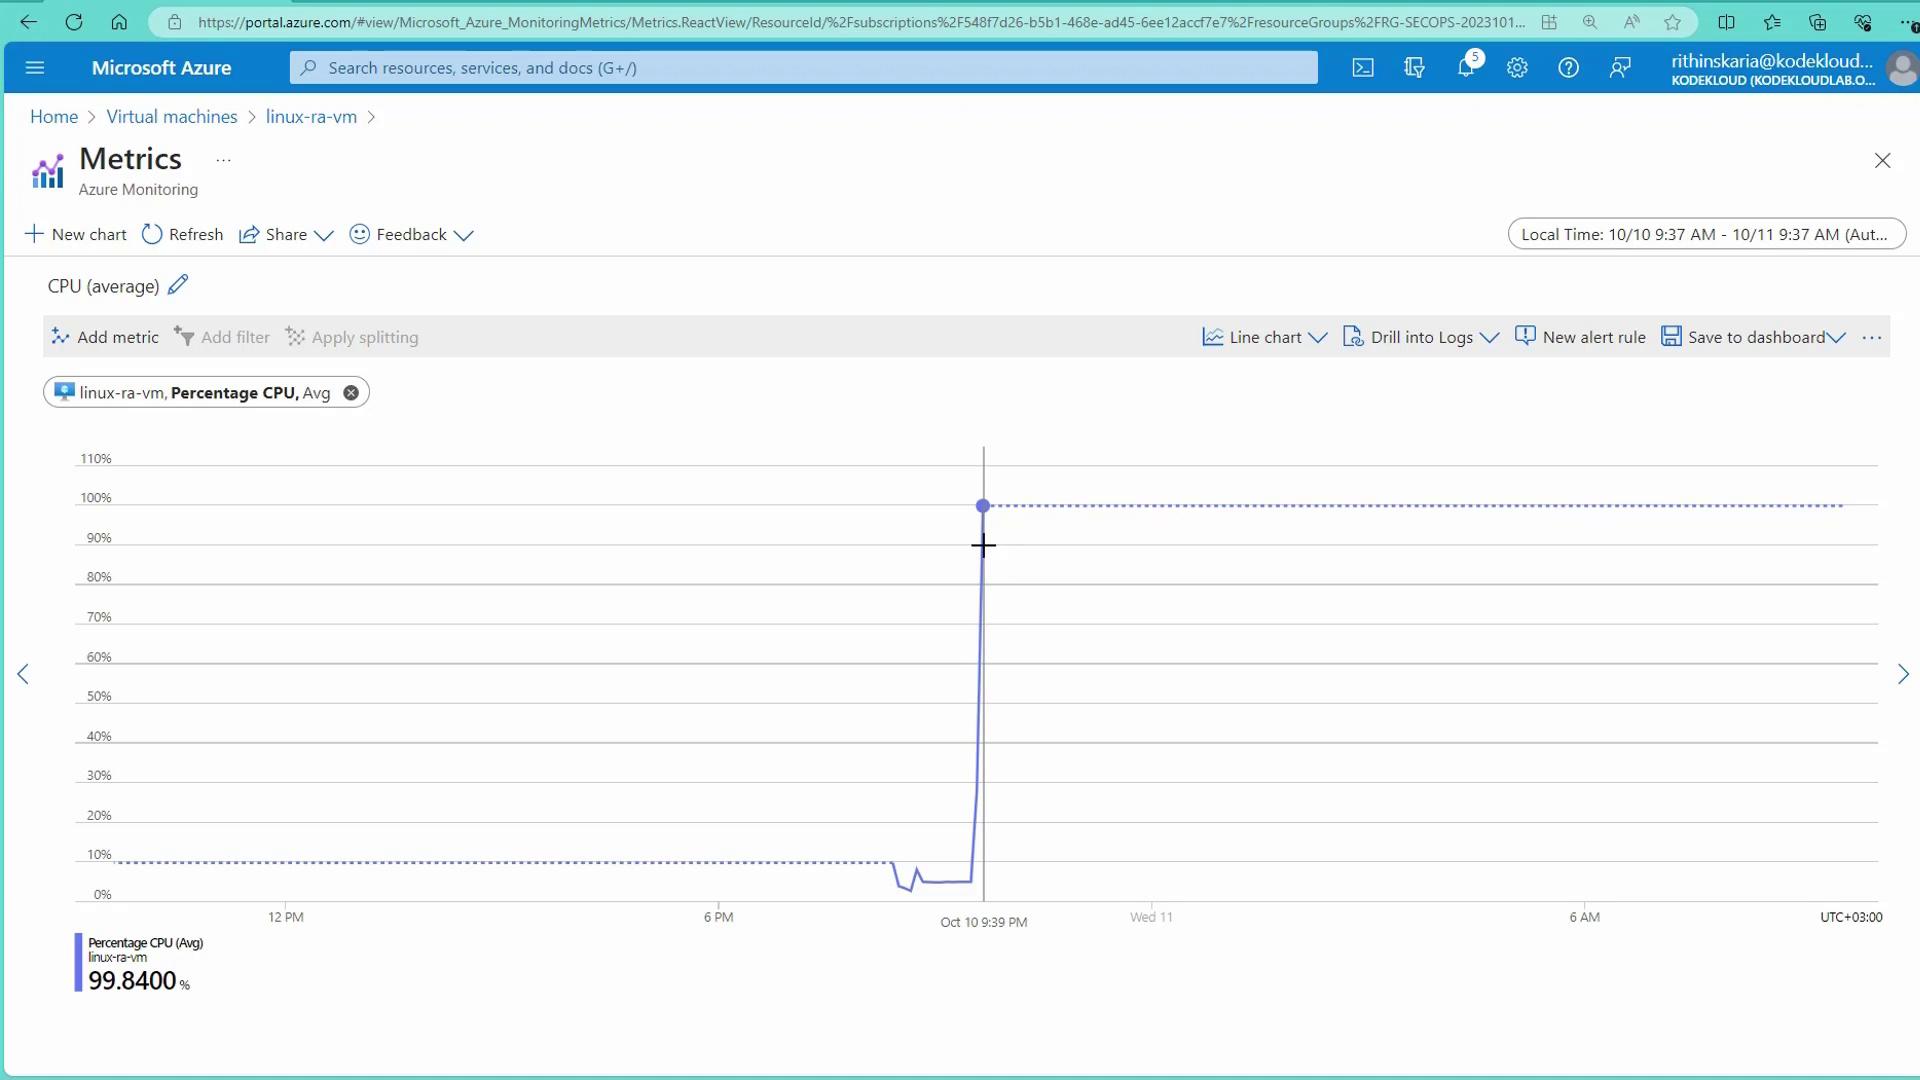
    Open another terminal session and SSH into the same VM to run the stress command. For example, to stress 4 CPU cores for 1000 seconds, use:

    stress -c 4 -t 1000
    

    This command forces CPU usage to reach 100%. Monitor the CPU utilization dashboard in the Azure Portal to observe the increase.

    The image shows a Microsoft Azure portal screen for creating an alert rule, detailing the scope, condition, and actions for monitoring virtual machines. The alert is set to trigger when the CPU percentage exceeds a certain threshold.

  4. Alert Trigger:
    As the CPU utilization surpasses the set threshold (e.g., the average over the last five minutes exceeds 80%), Azure Monitor will trigger the alert and send an email notification.

    The image shows a Microsoft Azure monitoring dashboard displaying a line chart of CPU usage for a virtual machine, with a significant spike reaching 99.84% at a specific time.


Verifying and Managing Alerts

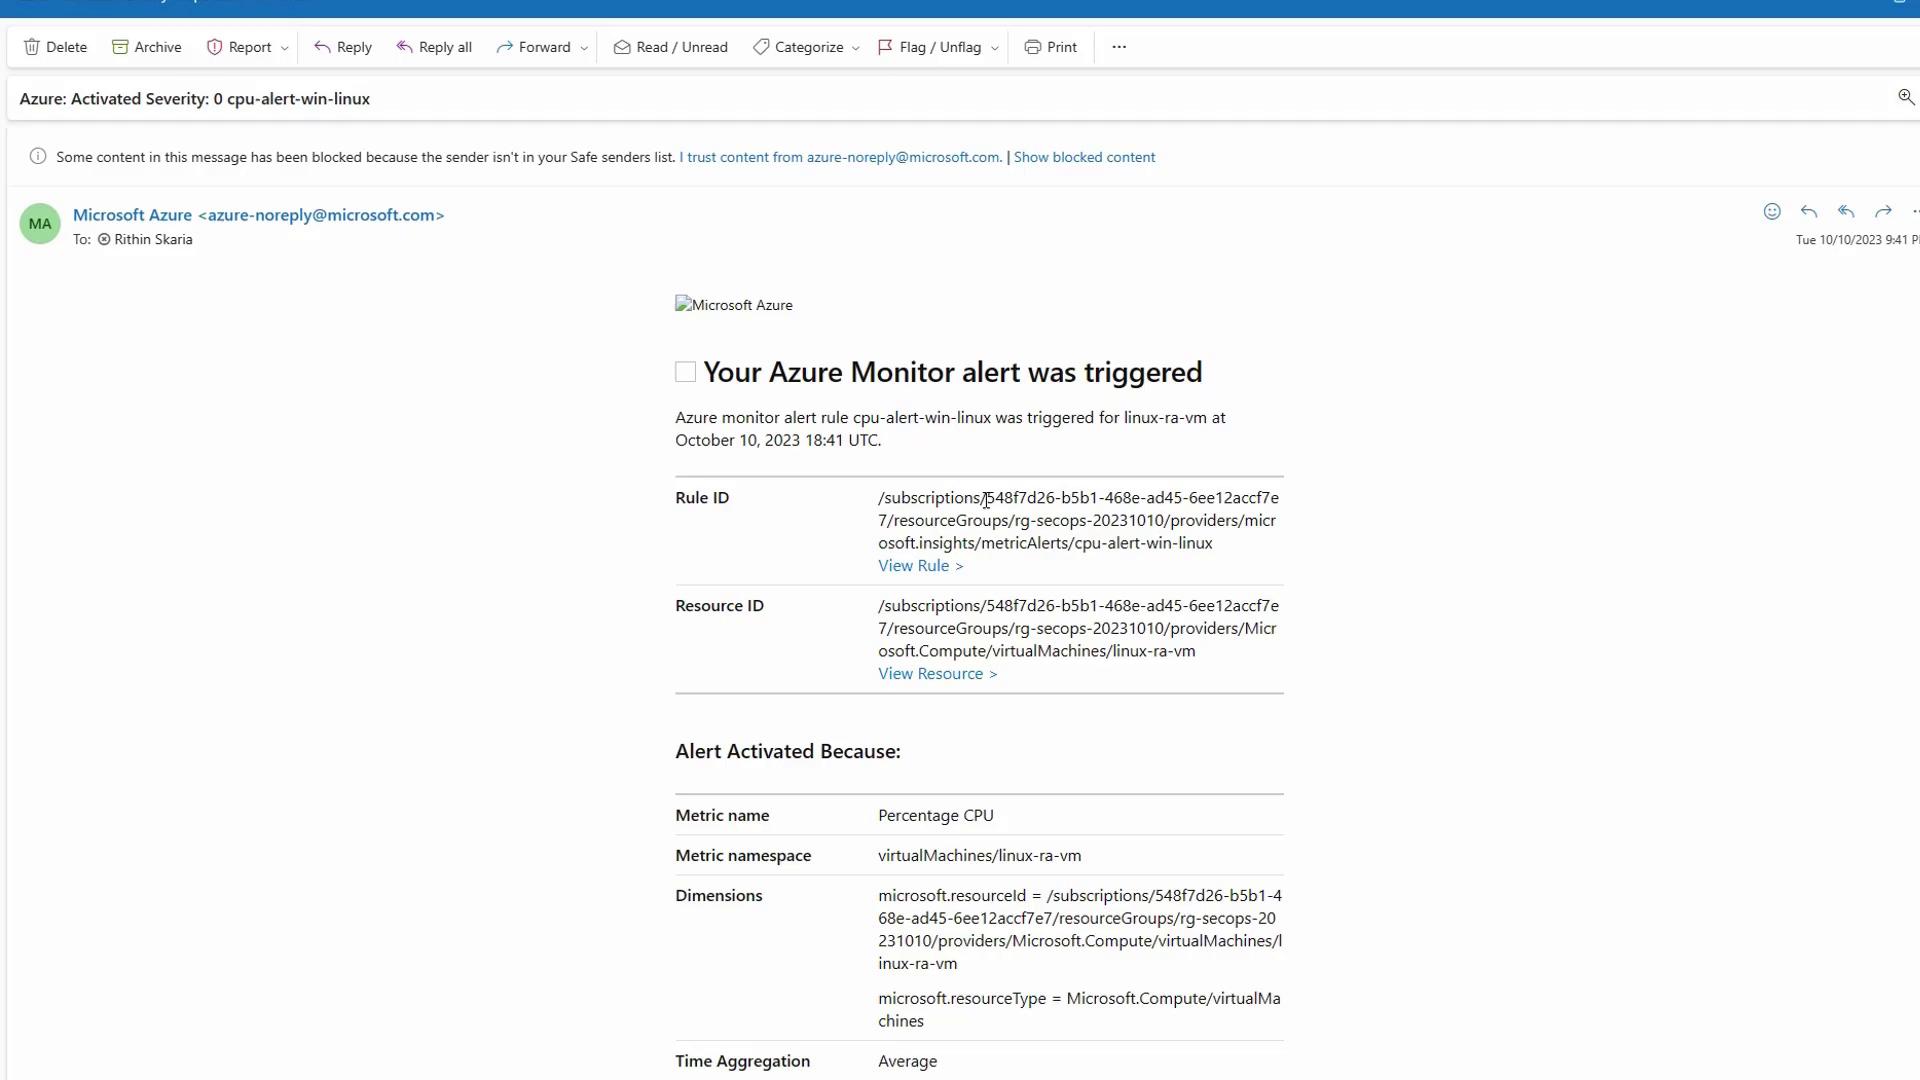
After an alert is triggered, you can take the following actions:

  • Check Email Notifications:
    The email will include information such as the rule ID, resource ID, and metric details.

    The image shows an email notification from Microsoft Azure indicating that an Azure Monitor alert was triggered due to a CPU alert for a virtual machine. It includes details such as the rule ID, resource ID, and metric information.

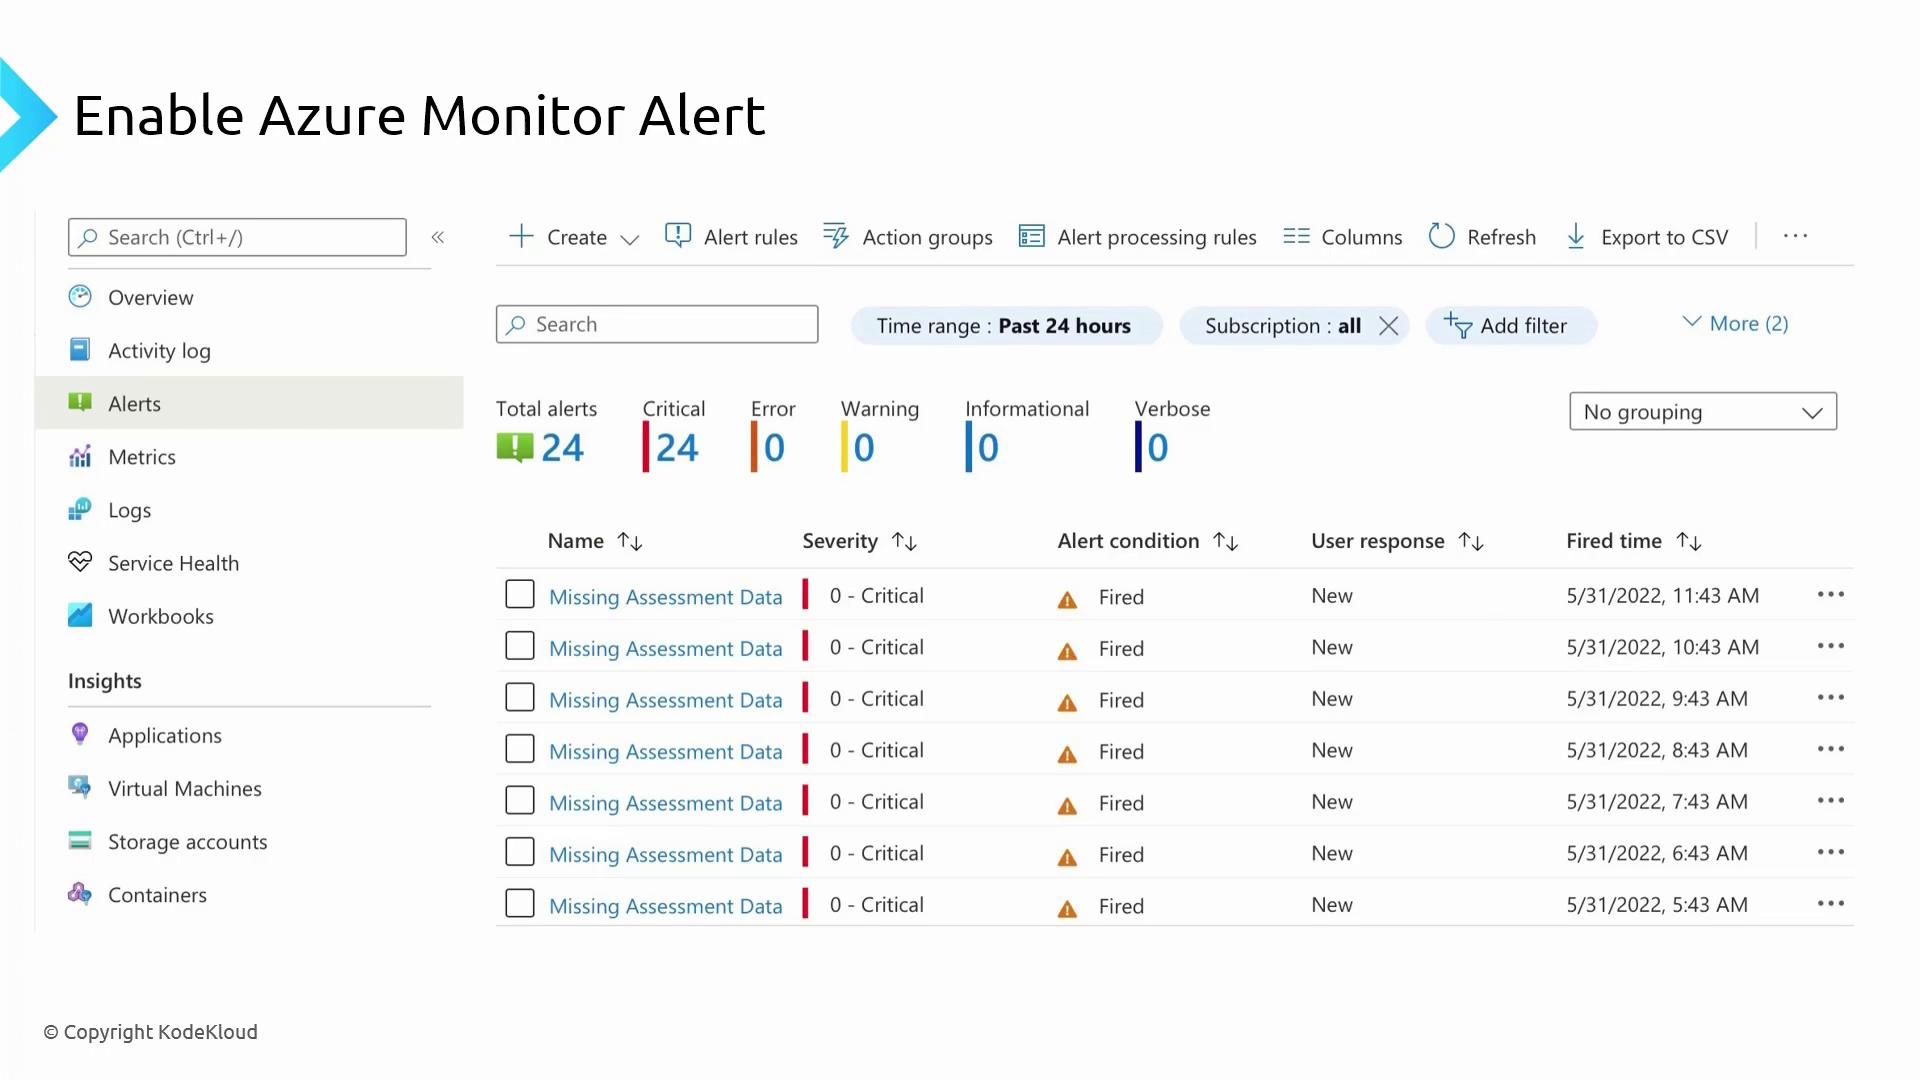
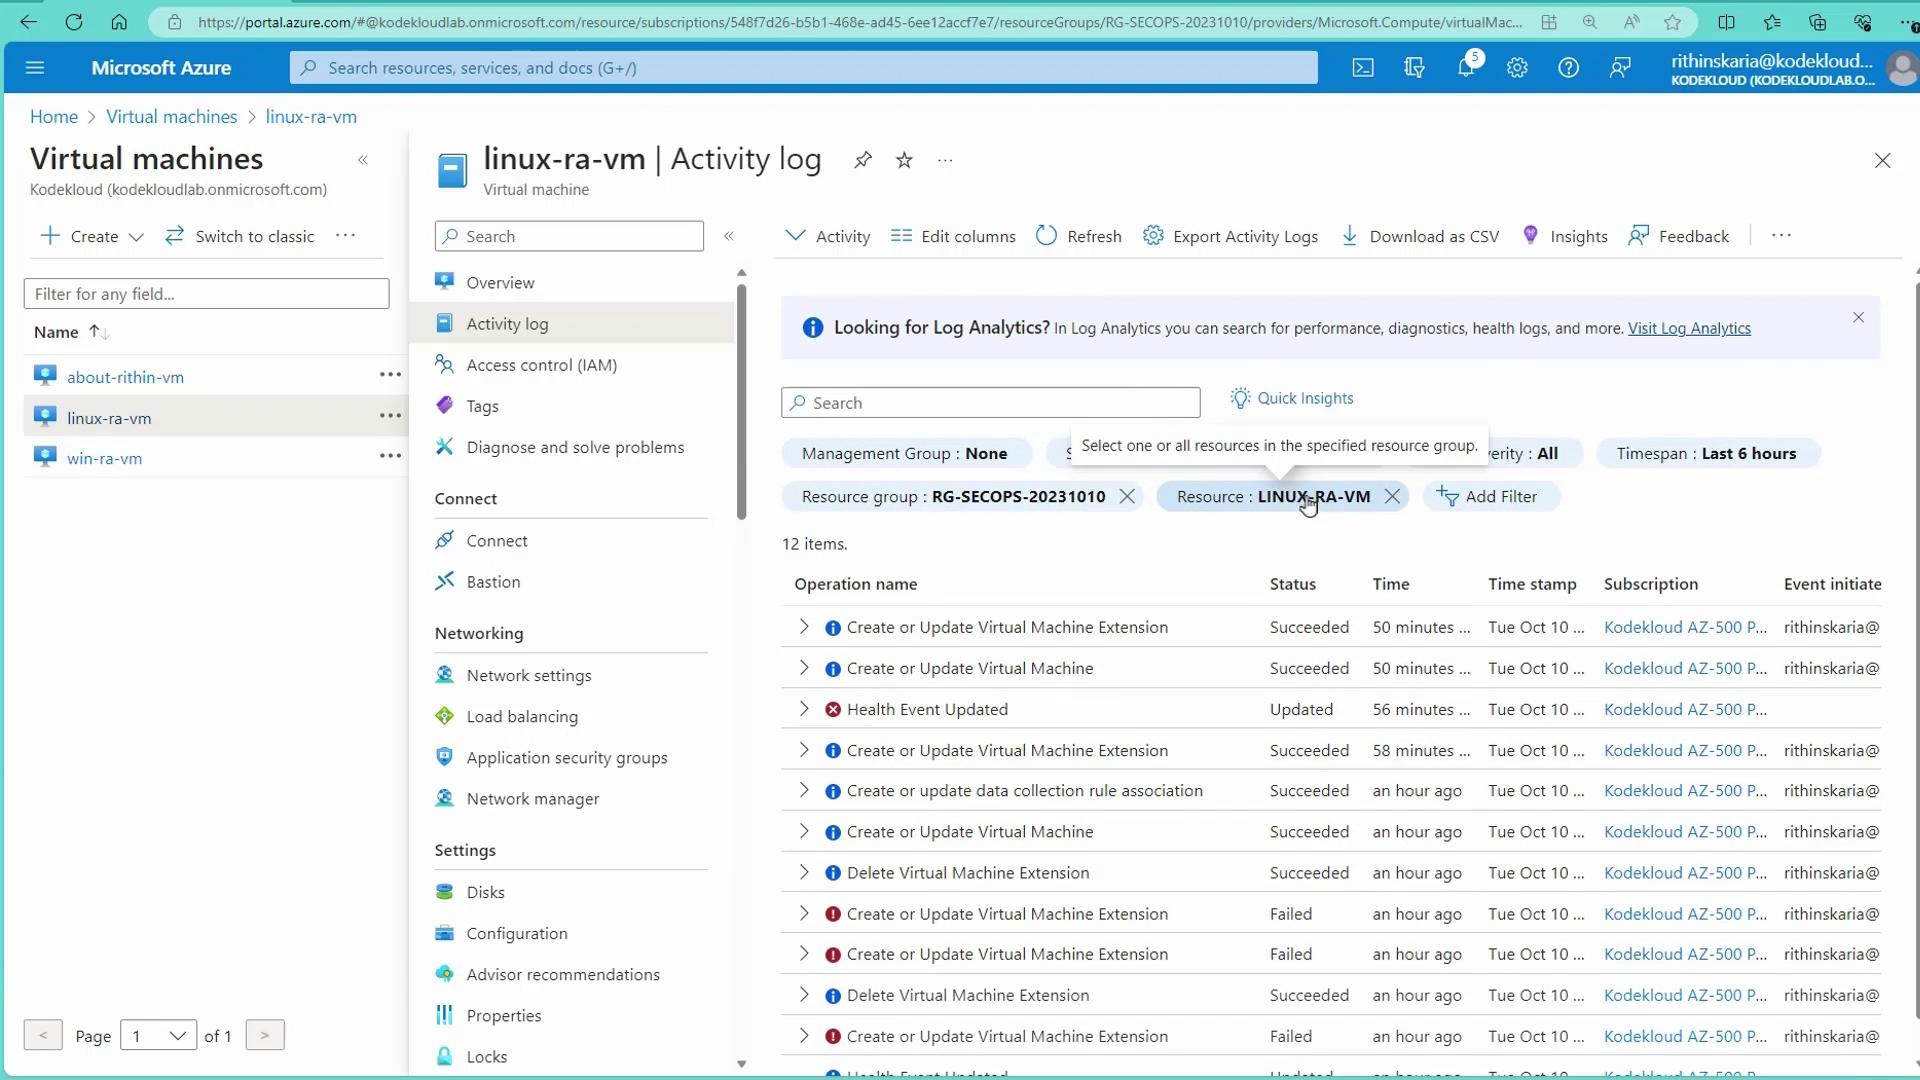
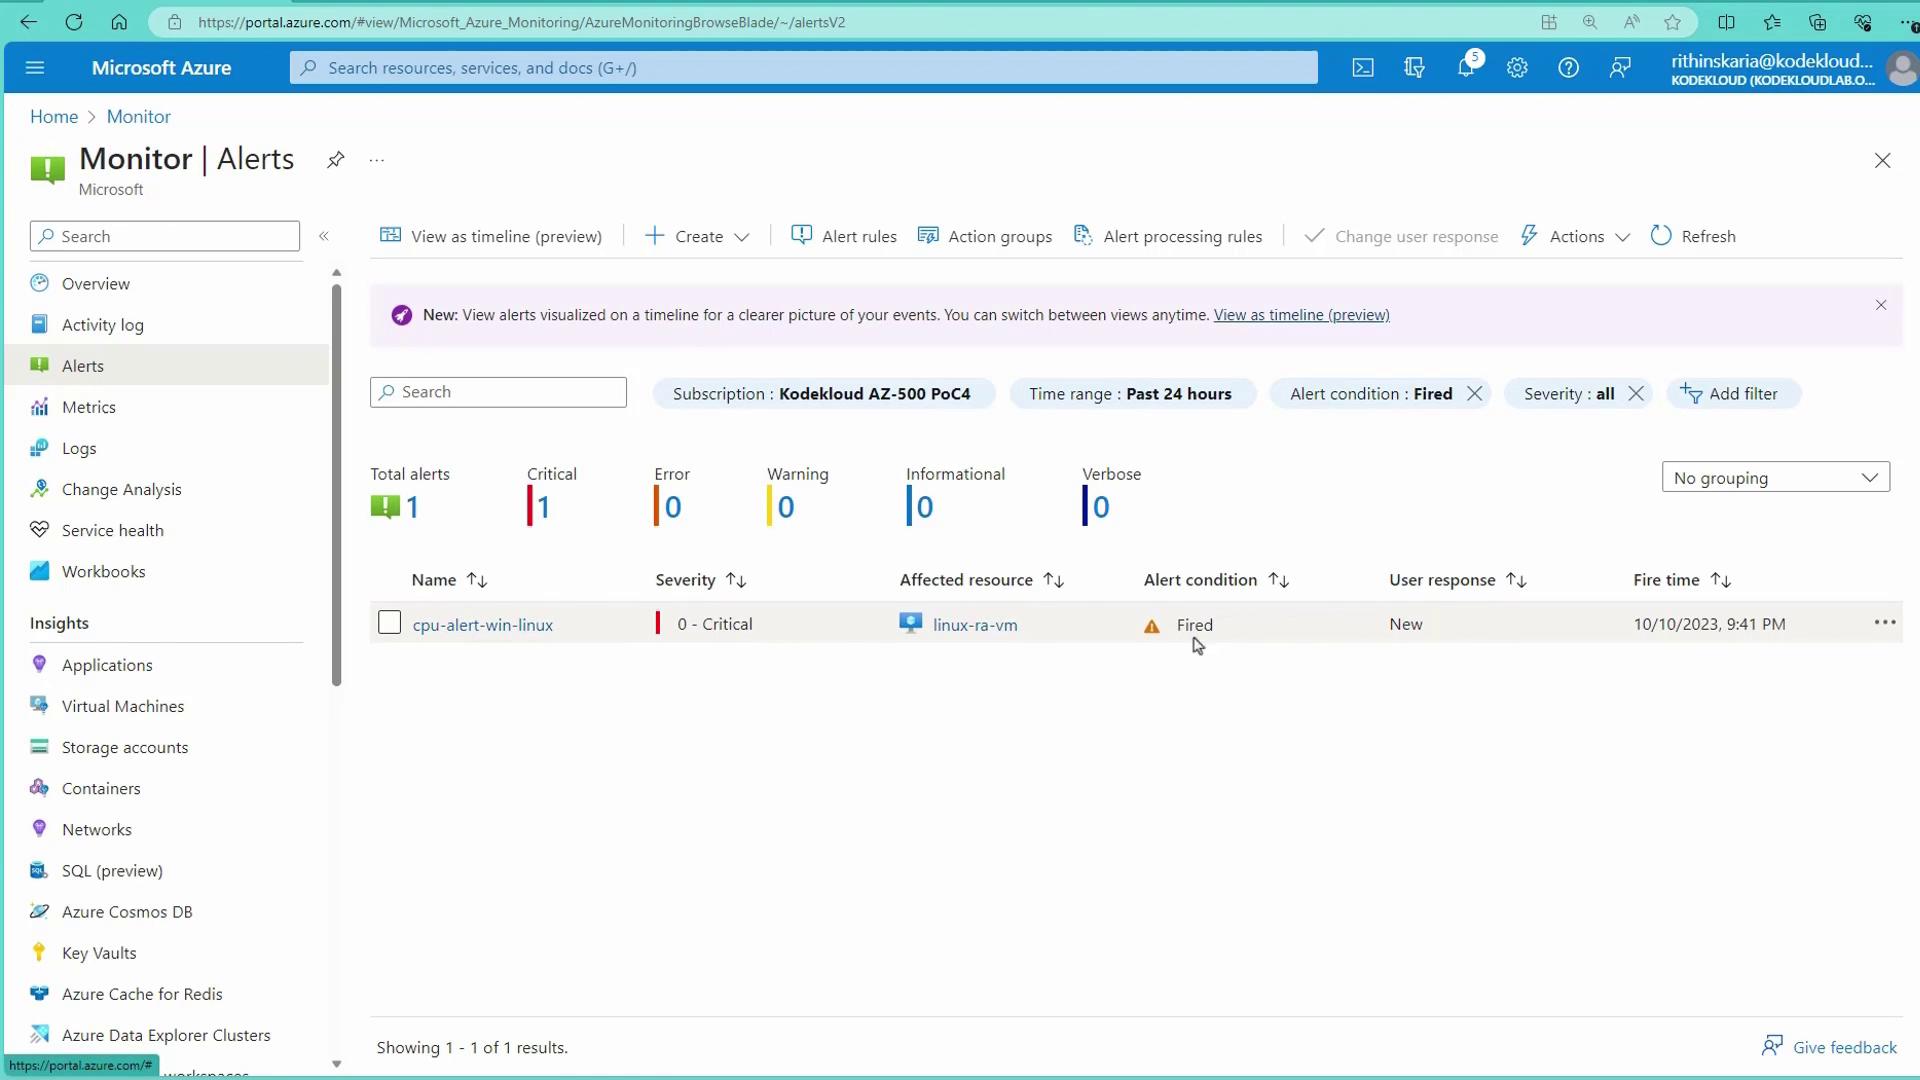
  • Review Alerts in Azure Portal:
    Examine the alert in the Azure Portal under the Alerts blade or check the activity logs for the specific resource.

    The image shows the Microsoft Azure portal displaying the activity log for a virtual machine named "linux-ra-vm." It lists various operations, their status, and timestamps.

  • Manage Alert Status:
    Change the alert status from "Fired" to "Acknowledged" or "Closed" to track incident resolution.

    The image shows the Microsoft Azure Monitor Alerts dashboard, displaying a critical alert for a resource named "linux-ra-vm" with the alert condition marked as "Fired."

You can always review all your alert rules and their current statuses within the portal to ensure your monitoring setup remains effective.


With this lesson, you have learned how to configure and test Azure Monitor Alerts using the Azure Portal along with a practical stress test on a Linux VM. This approach ensures you are promptly notified and can take swift action when your critical resources experience high CPU usage.

The image shows a setup screen for creating an alert rule in Azure Monitor, with sections for project and alert rule details. Below, there are colorful icons labeled "Scope," "Condition," "Action," and "Rule details."

For more detailed information, consider reviewing the Azure Monitor documentation.

Good luck, and happy monitoring!

Watch Video

Watch video content

Previous
Querying Log Analytics Workspace