Onboarding Machines and Agents
Traditionally, onboarding non-Azure machines involved installing the Log Analytics Agent and providing the appropriate workspace key. With the deprecation of MMA, the onboarding process now leverages Azure Arc to manage non-Azure machines. Once onboarded to Azure Arc, you can easily deploy the necessary extensions using Azure Resource Manager (ARM), much like managing an Azure Virtual Machine. The diagram below illustrates the process flow for managing connected log sources in Log Analytics: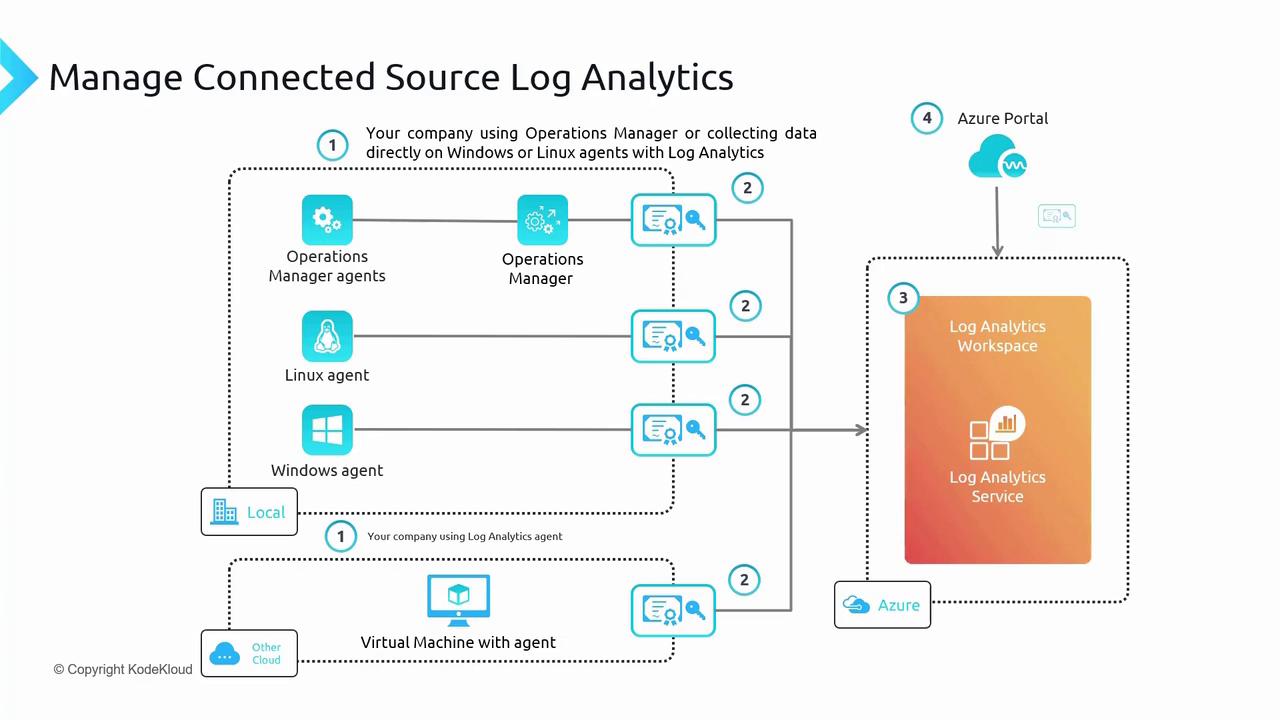
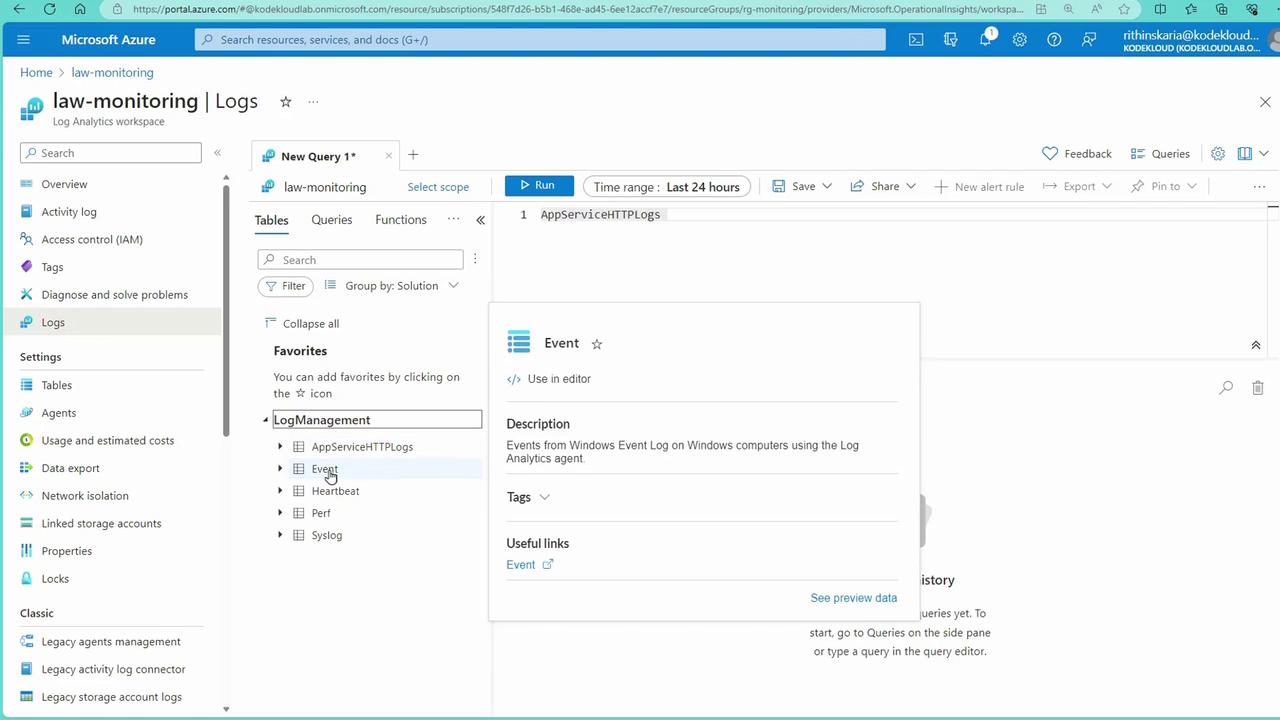
- Windows Event Logs populate the “Event” table.
- Syslog data is stored in the “Syslog” table.
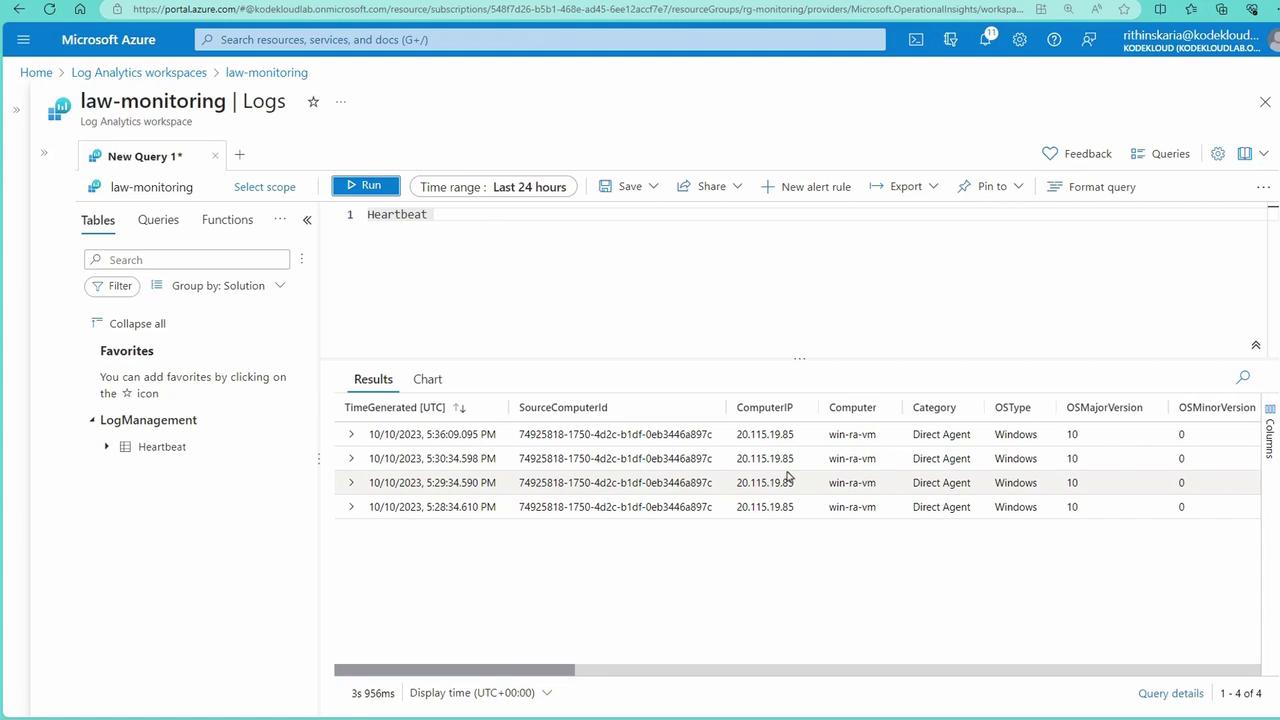
- Heartbeat data, which monitors agent connectivity, appears in the “Heartbeat” table.
- Performance metrics are stored in the “perf” table.
- Custom logs can also be defined.
Configuring Monitoring for Virtual Machines
For demonstration purposes, we deploy a Windows machine, a Linux machine, and an App Service. These resources can be provisioned using a PowerShell script from the GitHub repository (namedmonitoring-prep-infra-powershell), which creates a resource group called rgsecops containing two virtual machines and a web app.
Using the Legacy Agent (MMA)
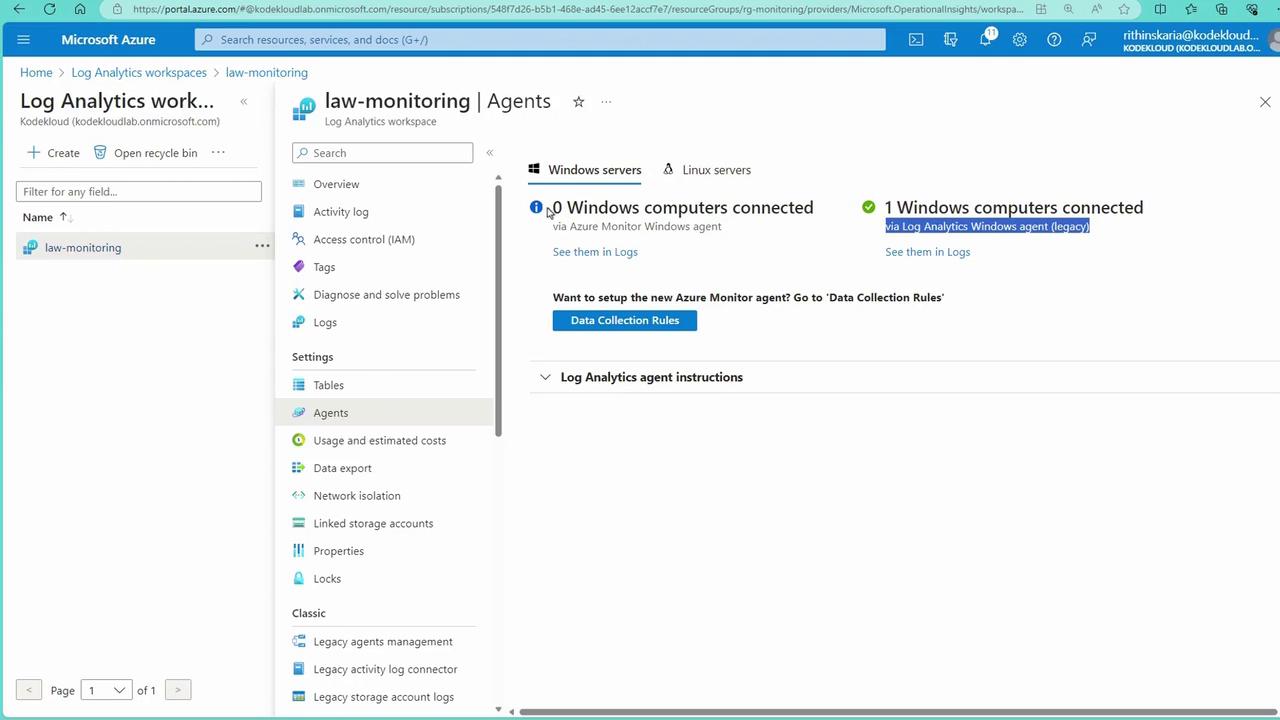
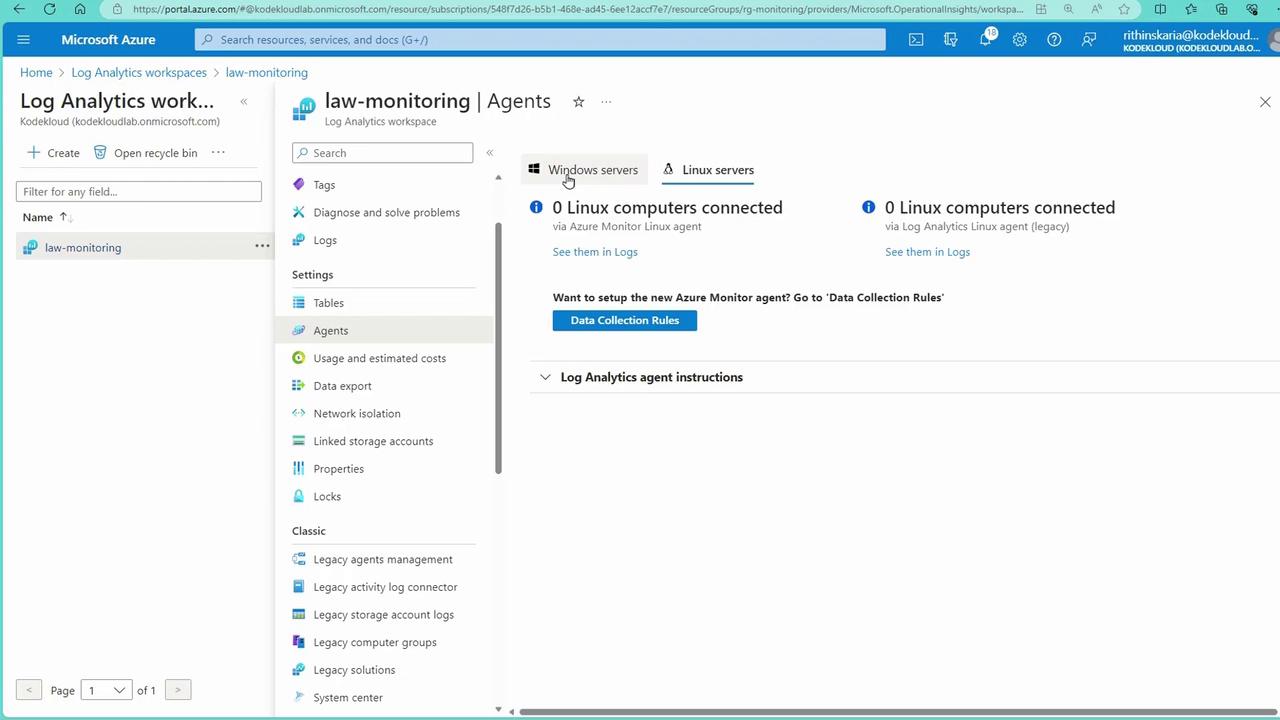
Initially, the legacy MMA (Microsoft Monitoring Agent) is used for onboarding, even though it is scheduled for deprecation in August 2024. In the Log Analytics workspace within the Azure Portal, navigate to “Resources” and then “Virtual Machine” to view the onboarded machines: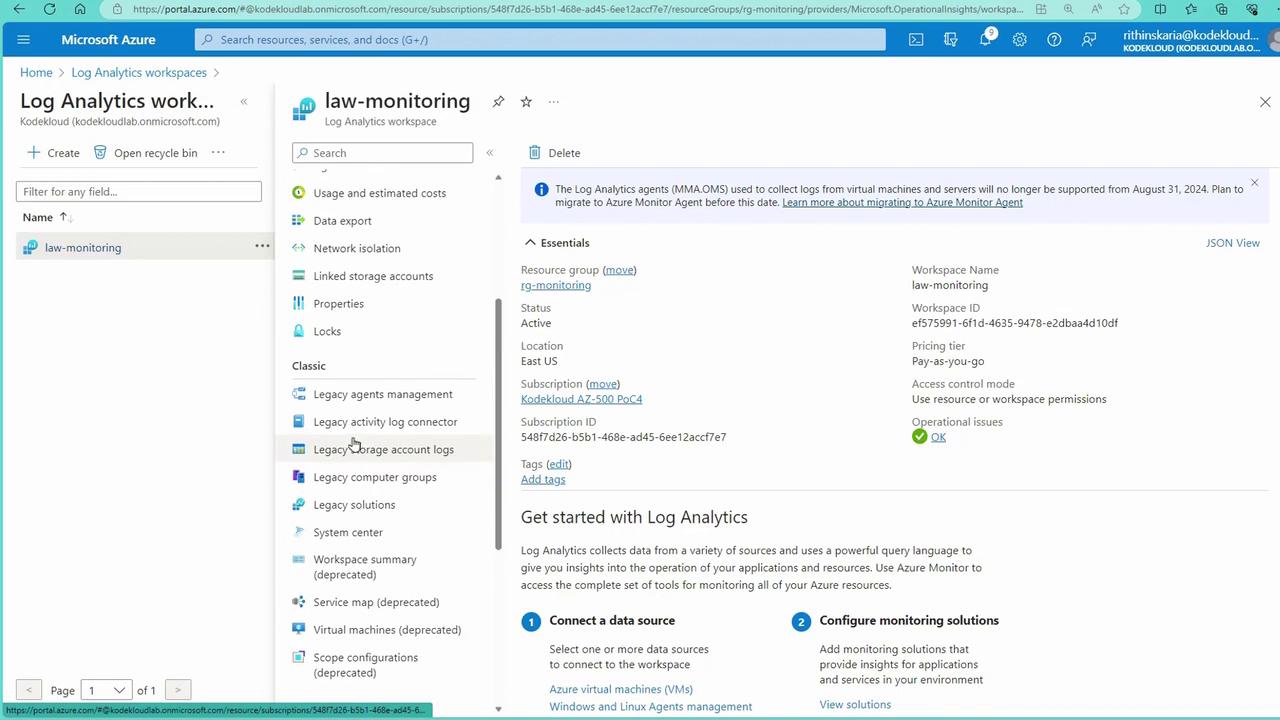
- Navigate to Virtual Machines.
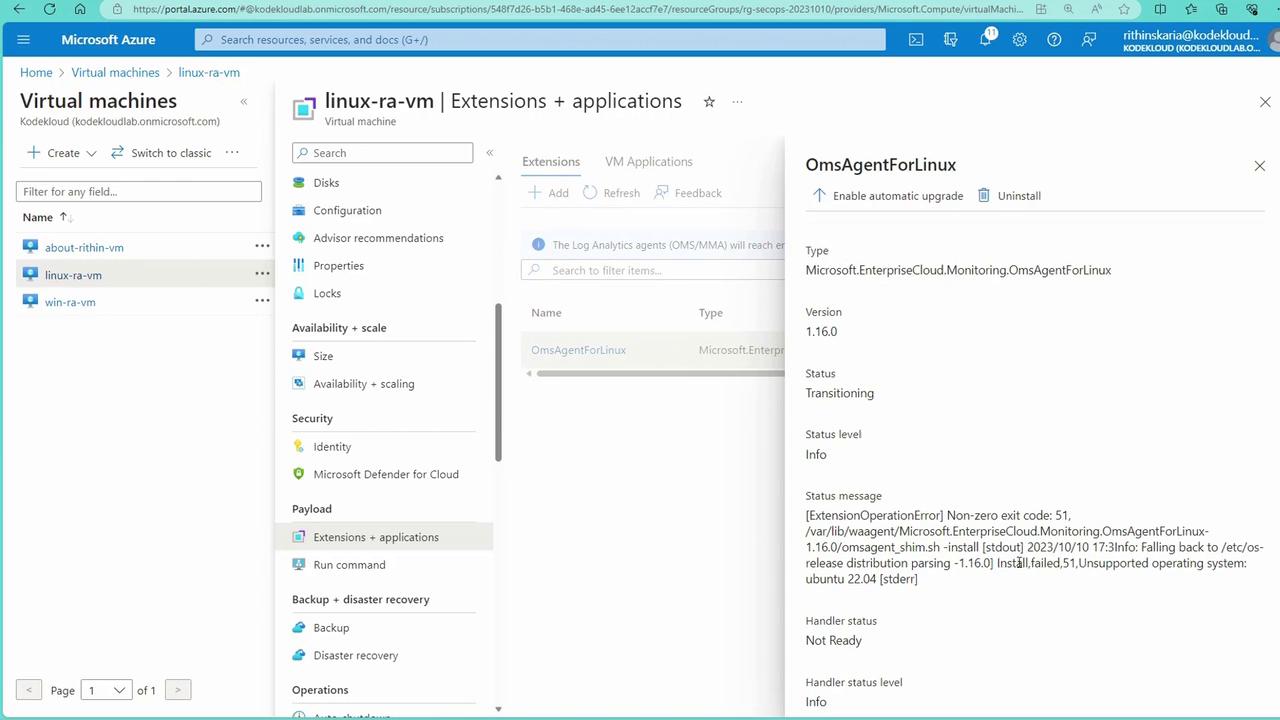
- Select the Linux machine.
- Click on “Extensions” to review the installation status.
Transitioning to the Azure Monitor Agent (AMA) with Data Collection Rules
To adopt the modern agent (AMA), configure Data Collection Rules (DCRs) to define what data to collect and to specify the target Log Analytics workspace. AMA and MMA can coexist; however, be aware that sending data from both agents to the same workspace may result in duplicate billing. Follow these steps to create a Data Collection Rule:- In the Azure Portal, go to the Monitor section and select “Data Collection Rules.”
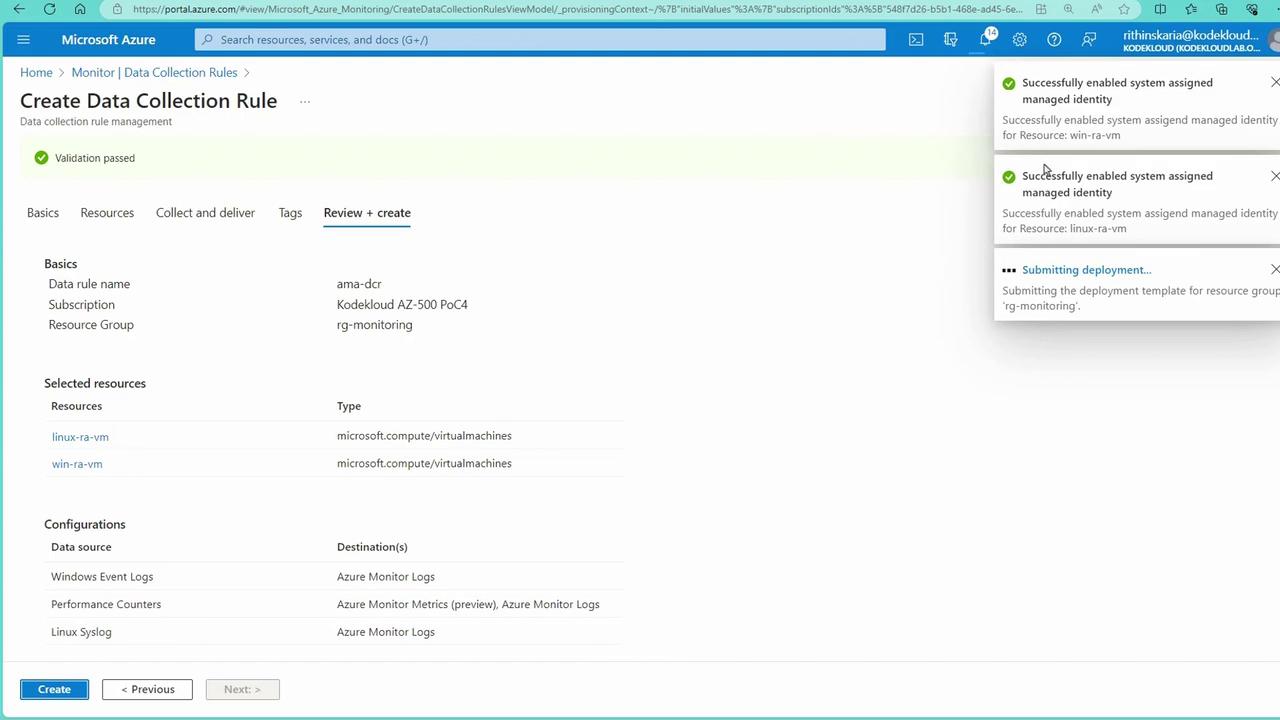
- Create a new rule (e.g., named “AMADCR”) in your monitoring resource group.
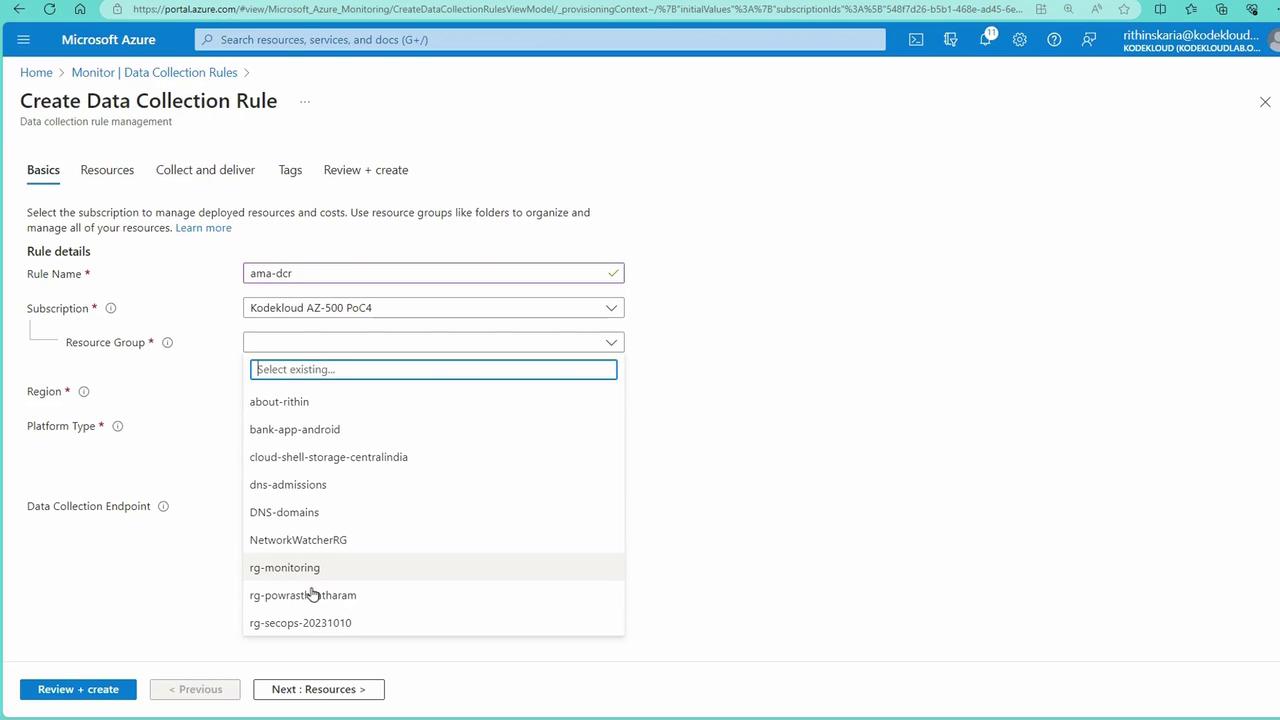
- Select “All” for the platform type to cover both Windows and Linux.
-
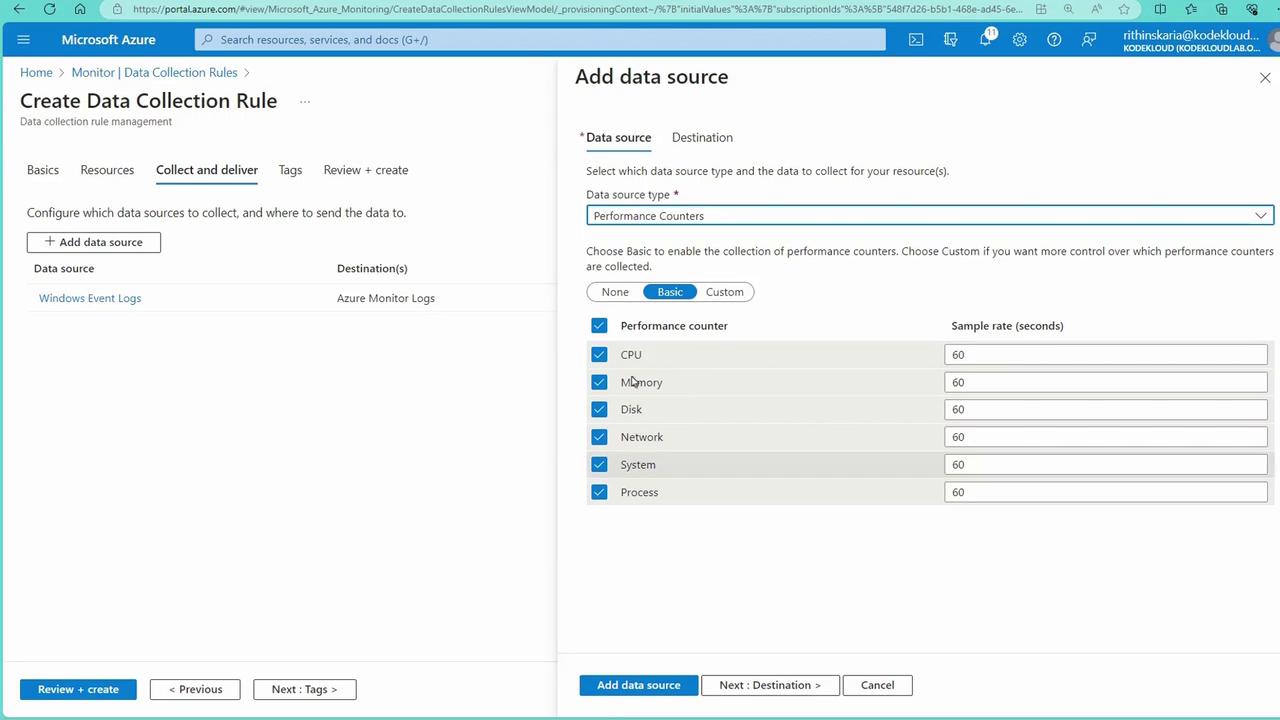
Under “Collect & Deliver,” add the required data sources:
- Windows Event Logs: Configure the desired logging levels (e.g., only critical events from Application or Security).
- Performance Counters: Choose metrics such as CPU, memory, disk, network, system, and process counters.
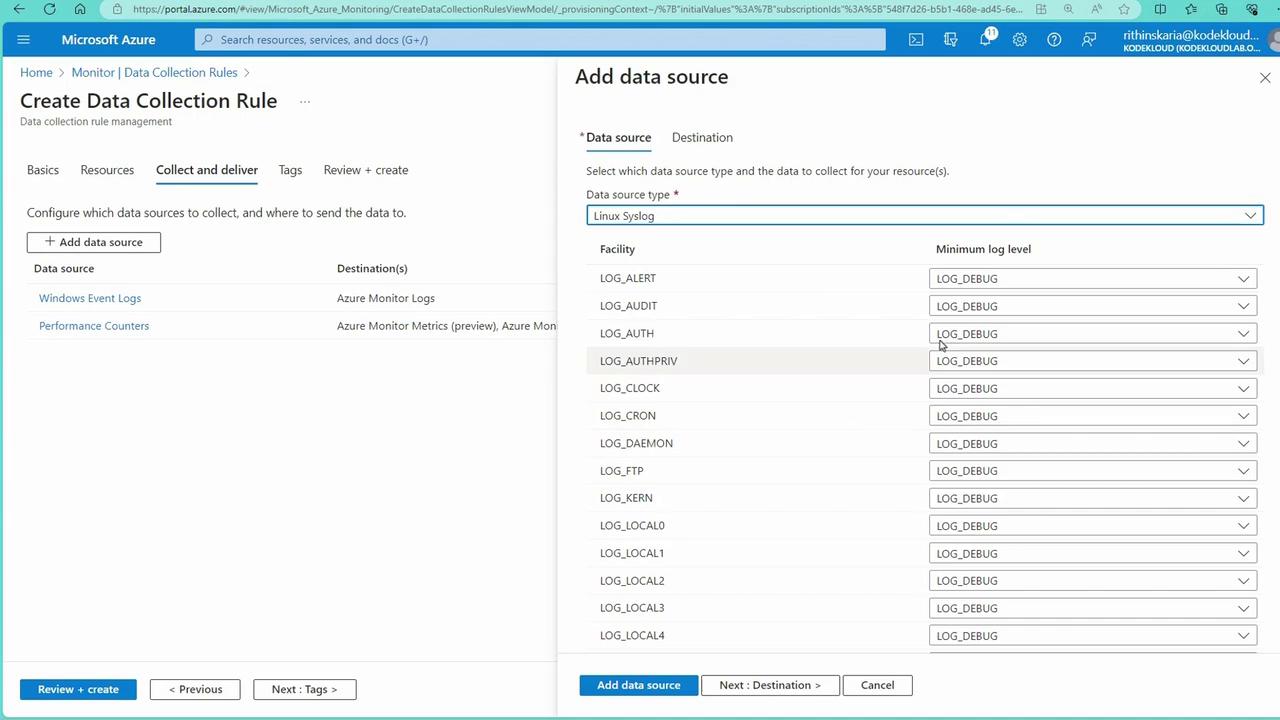
- Linux Syslog: Specify the desired logging levels (e.g., Debug, Info, Notice, Warning).
- Review and create the Data Collection Rule. During this process, a system-assigned managed identity is enabled, and the extension installation for the Azure Monitor Agent is automatically initiated.
Monitoring App Services
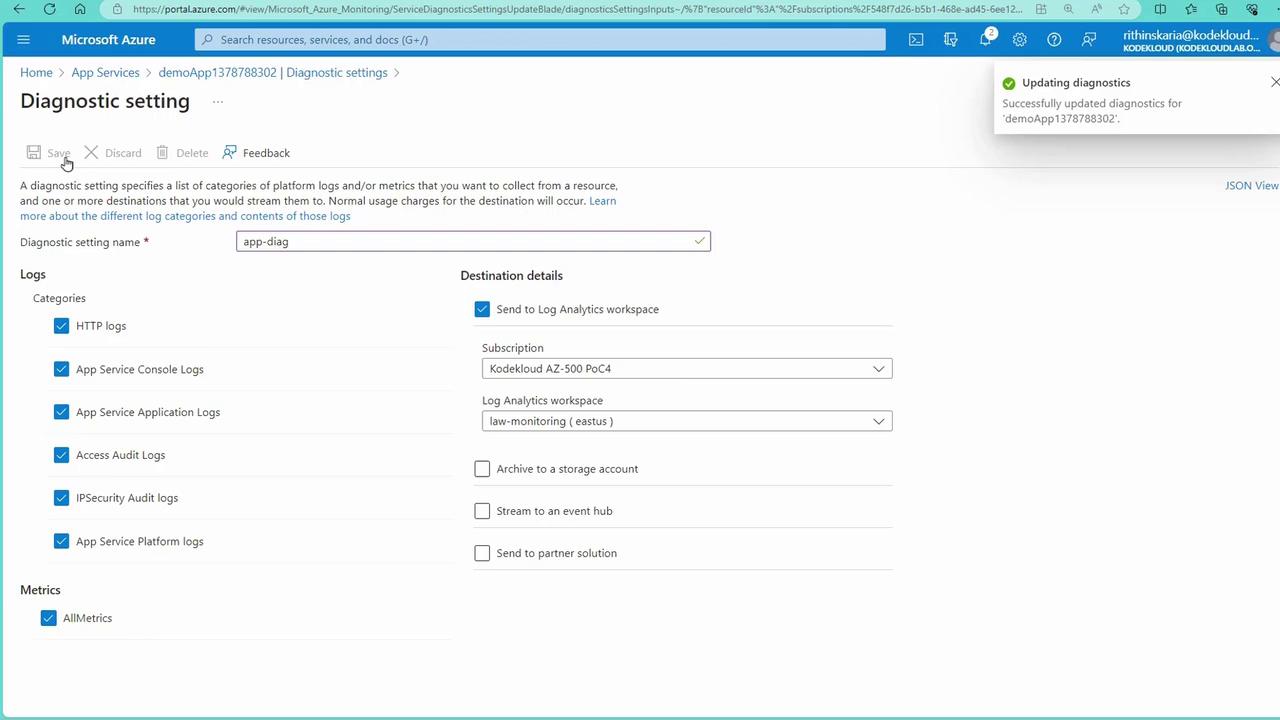
For Platform-as-a-Service (PaaS) resources such as App Services, an agent is not required because Microsoft manages the underlying infrastructure. Instead, configure Diagnostic Settings to capture logs and metrics. Follow these steps:- In the Azure Portal, navigate to your Web App and go to the “Diagnostic Settings” section.
- Create a new diagnostic setting (e.g., “App DAG”) and select the log and metric categories you want to capture.
- Choose your Log Analytics workspace as the destination.
Conclusion
In this lesson, we demonstrated how to onboard machines to a Log Analytics workspace using both the legacy MMA and the modern AMA approaches. While current exams may reference MMA, it is advisable to adopt AMA for new deployments due to its enhanced capabilities and support for modern operating systems. We also covered how to capture logs from App Services using Diagnostic Settings.Stay tuned for our upcoming guide on Azure Monitor Alerts to further enhance your monitoring strategy.