AWS Certified SysOps Administrator - Associate
Domain 1 Monitoring Logging and Remediation
Demo Creating CloudWatch Alarms
Welcome to this detailed guide on CloudWatch metrics, filters, and alarm creation. In this tutorial, you will learn how to navigate the CloudWatch console, review instance metrics, and configure an alarm to monitor performance issues. I'm Michael Forrester, and I will walk you through each step for a smooth setup.
Navigating to CloudWatch
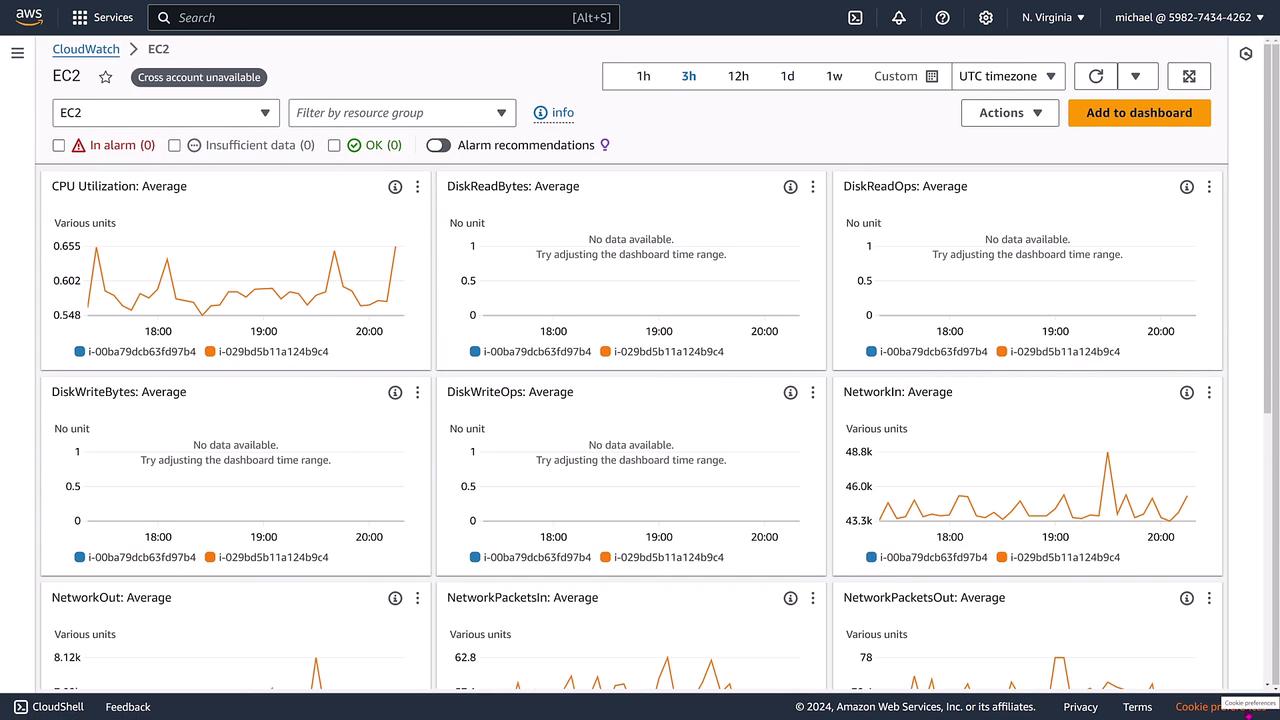
Start by accessing the AWS Console home. In your browser, type "CloudWatch" to navigate directly to the CloudWatch console. Upon arriving, you'll see the default dashboard displaying various metrics.
Before setting up any alarms, it is essential to review all available metrics. Click on All Metrics to explore the automatic dashboard and gain insights into the various performance indicators available. In our account, there will be at least two instances listed.
Focusing on a Specific Instance
If you need to monitor a particular instance, for example, one whose ID ends with B9C4, you can start by verifying its performance in the EC2 dashboard.
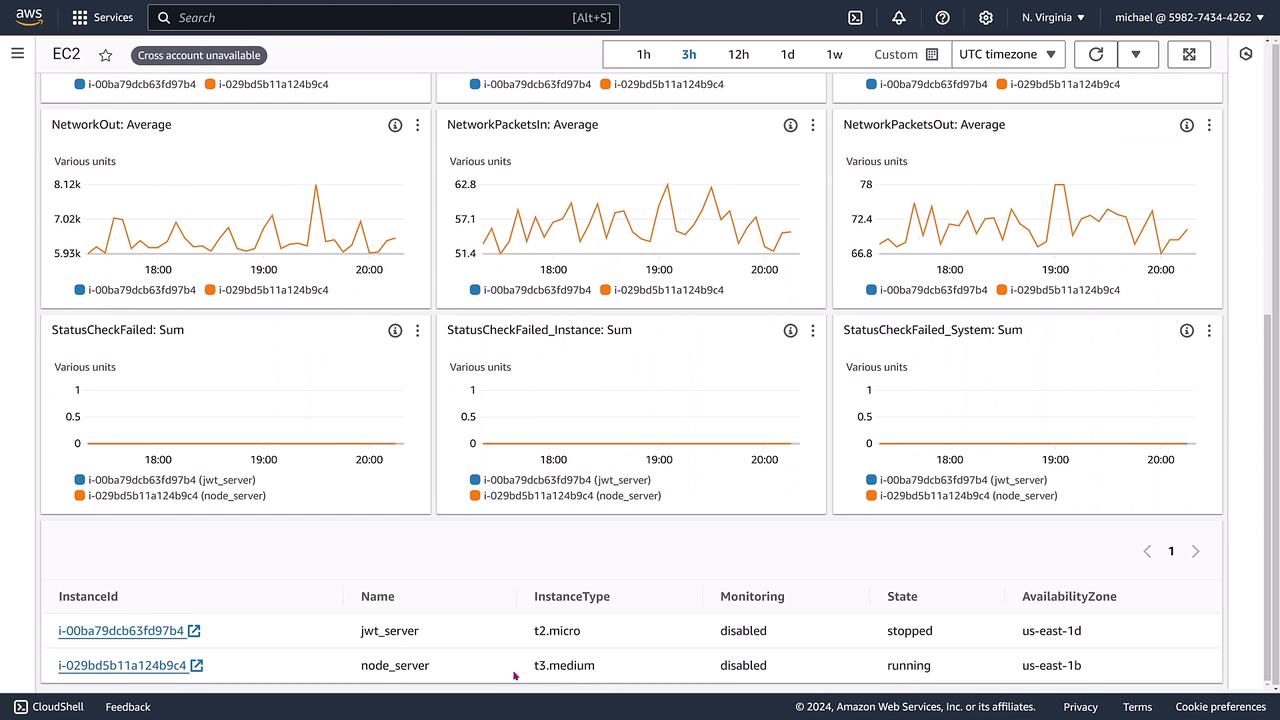
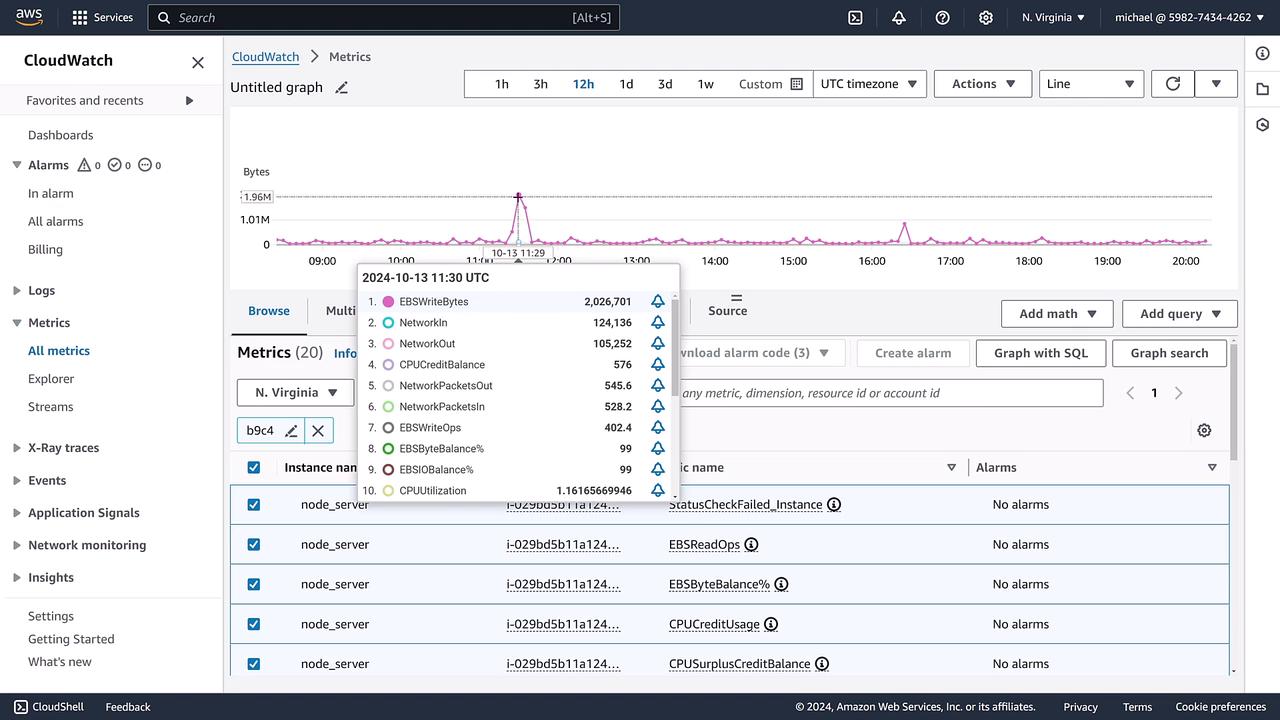
After reviewing the EC2 performance, return to the CloudWatch console and click All Metrics again. Then, select EC2 and navigate to the per-instance metrics. In the search field, type B9C4 to filter the metrics associated with your node server. Here, you'll find various statistics like CPU credit balances, network packets, and EBS read/write operations.
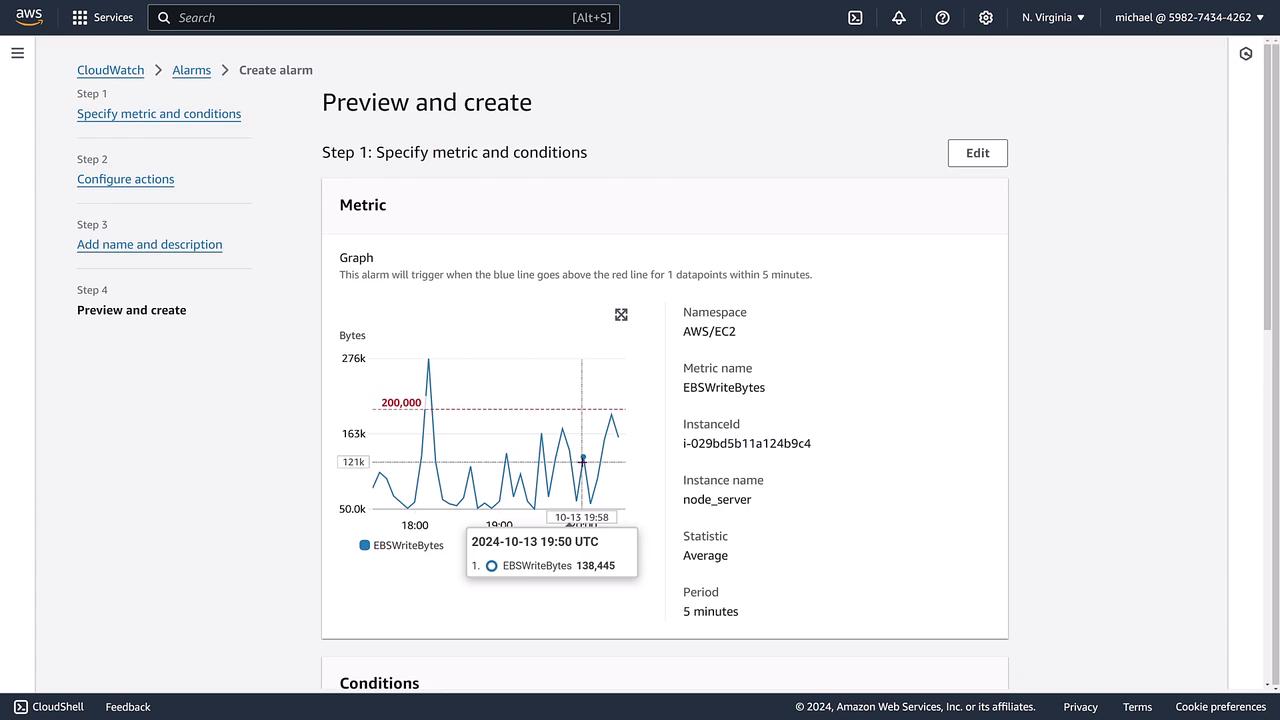
Examine the data carefully. For instance, you may observe that while CPU credits were robust over a 12-hour window, a closer look reveals that EBS write bytes became problematic. The extended timeframe provided by CloudWatch helps pinpoint that the issue likely occurred between 11 and 12 o’clock.
Creating an Alarm
Now that you understand the metrics, it’s time to set up an alarm to notify you if the performance issues arise.
Creating an Alarm
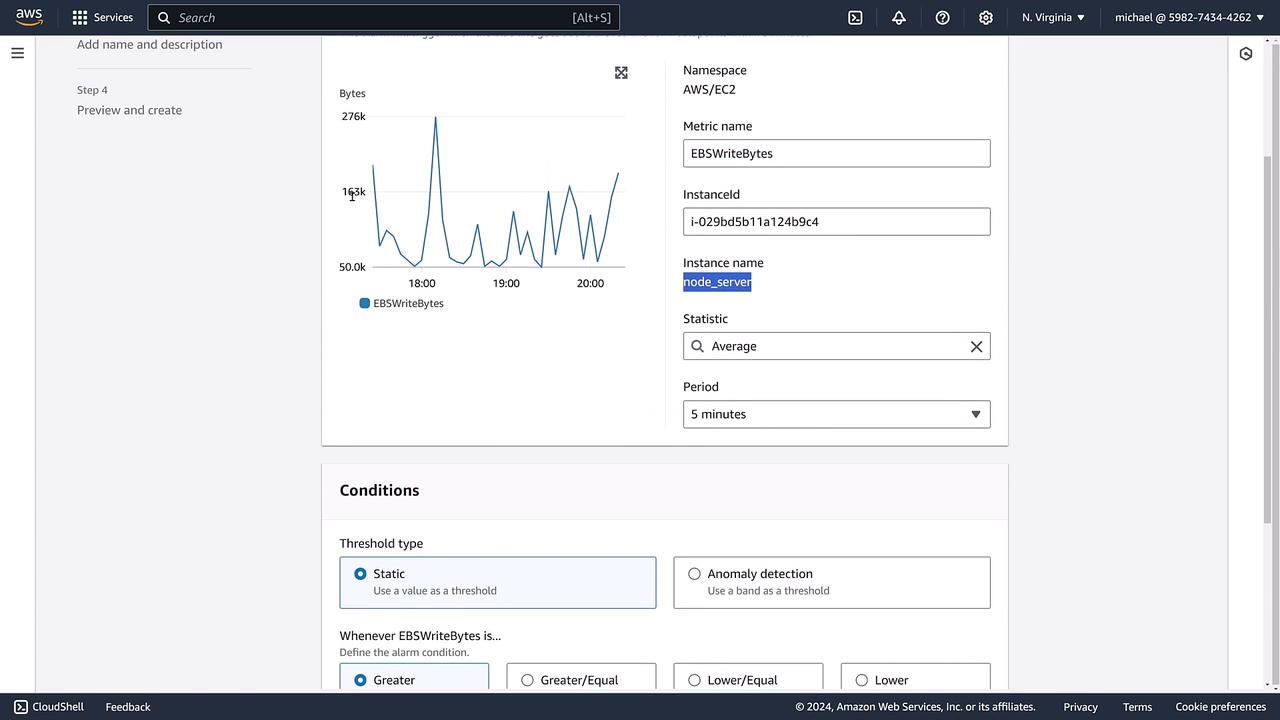
Before proceeding, ensure that you have identified the correct metric (in our case, EBSWriteBytes) and verified the time period relevant to your monitoring needs.
Step 1: Select a Metric
- In the CloudWatch console, click on Alarms. Initially, no alarms will be configured.
- Click Create Alarm and search for the metrics by typing B9C4. For this demo, select the EBSWriteBytes metric, which previously indicated increased activity.
Step 2: Configure the Alarm Conditions
Configure the alarm by setting the following:
- Evaluation Period: Set it to 5 minutes.
- Threshold: For example, if the average value over a 5-minute period exceeds 200,000 bytes, the alarm will trigger.
- Consecutive Periods: Decide how many consecutive periods (e.g., 3 out of 3) must breach the threshold before the alarm state changes.
- Missing Data: Optionally, set how to handle missing data if that is acceptable for your monitoring needs.
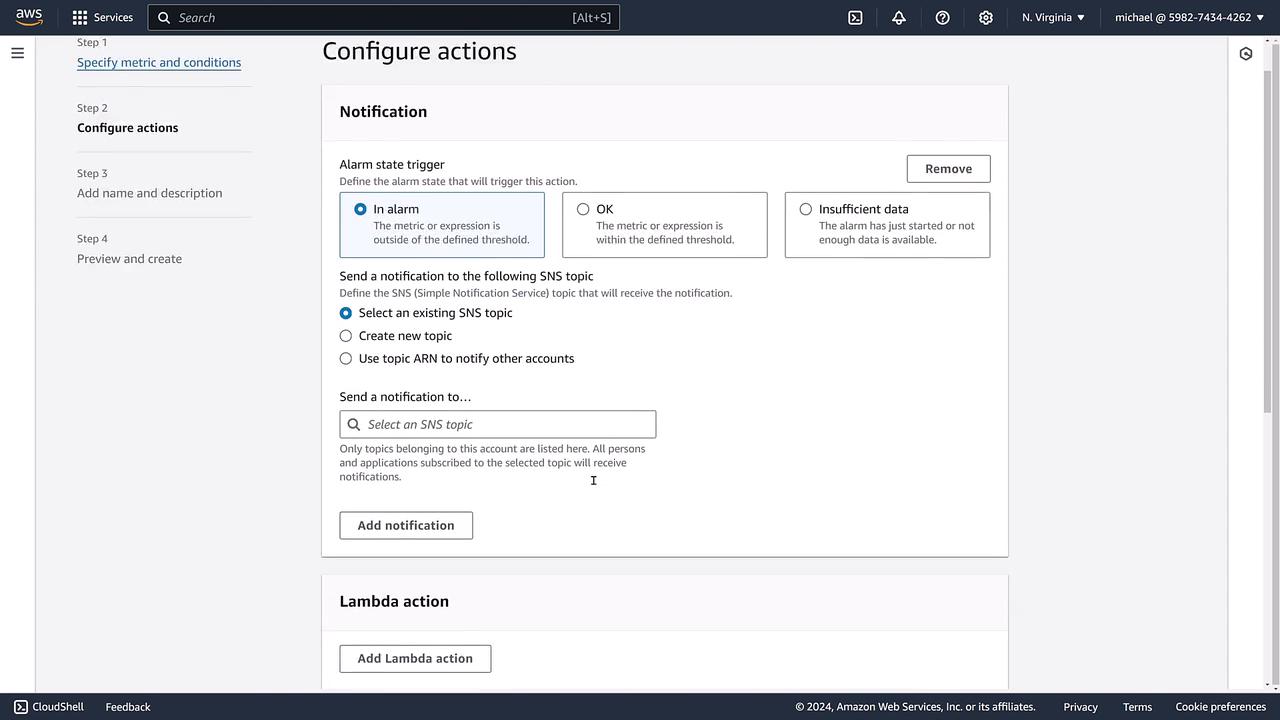
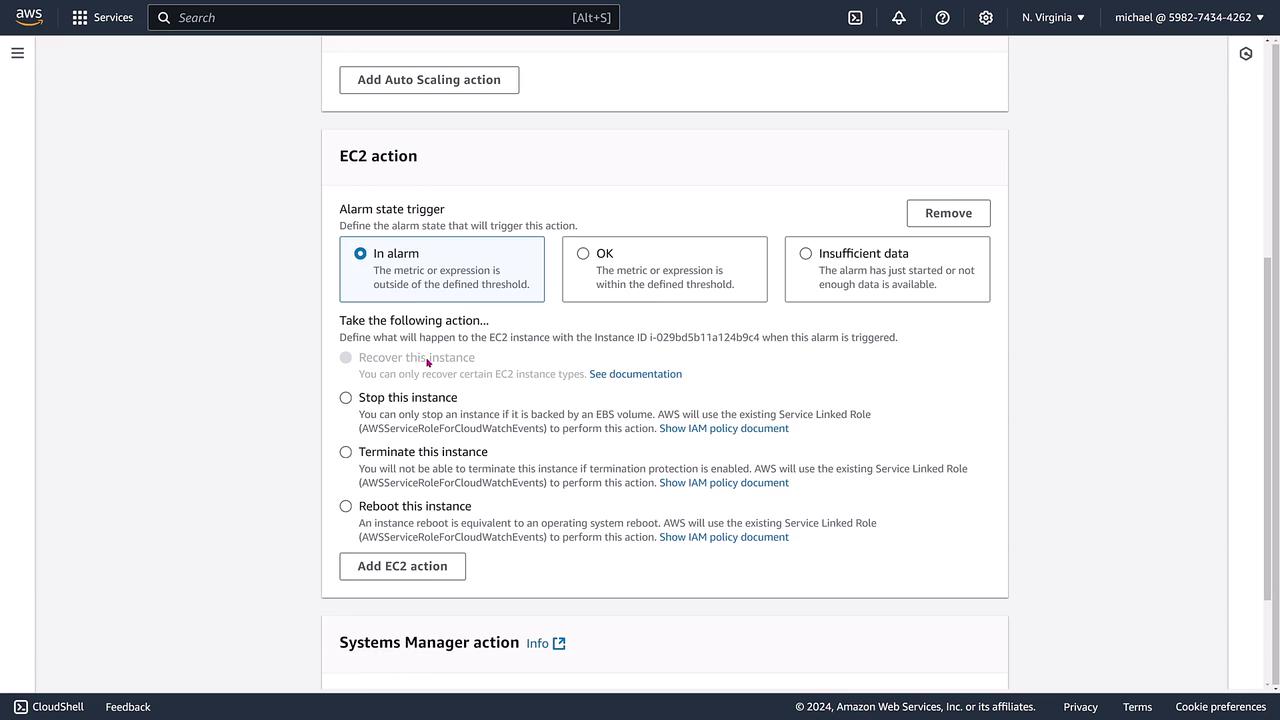
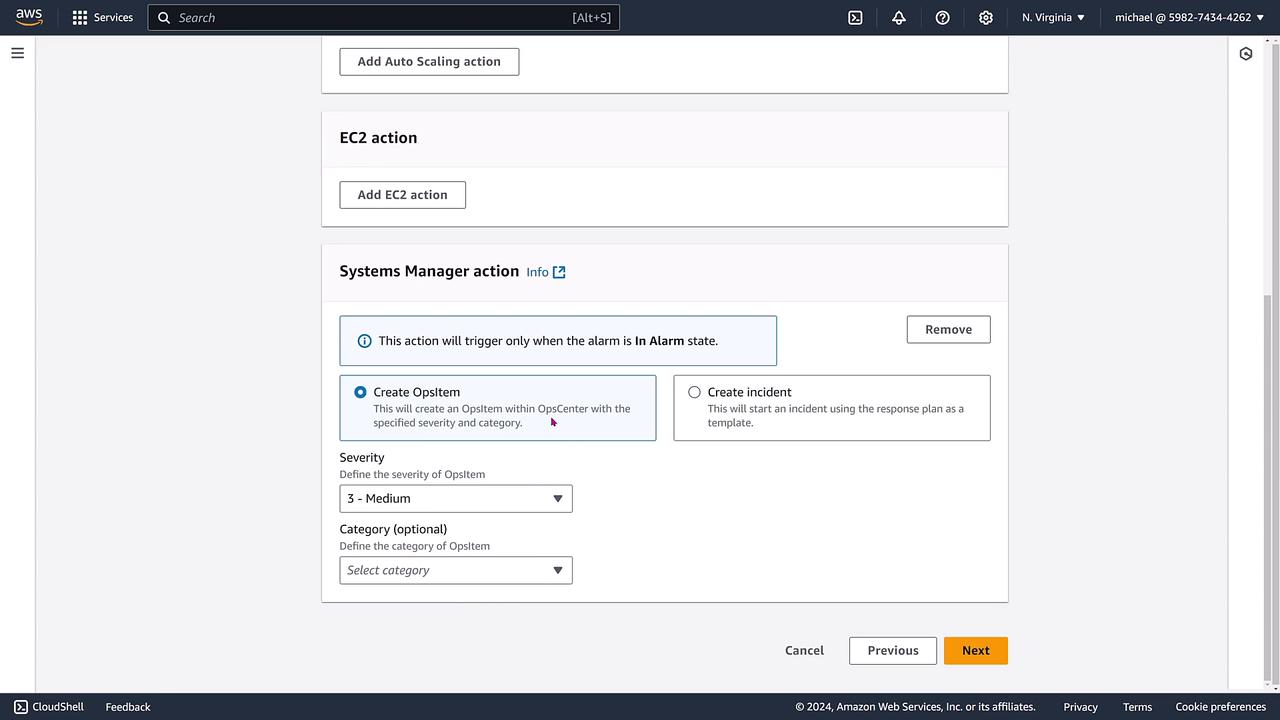
Step 3: Set Notification Options (Optional)
You can enhance your alarm by configuring notifications or additional actions. Some options include:
- SNS Topic: Send notifications via Amazon SNS.
- Lambda Function: Trigger a Lambda function for automated responses.
- EC2 Actions: Execute actions such as stopping, terminating, or rebooting the instance.
- Systems Manager Actions: Initiate Systems Manager operations like creating an OpsItem.
Step 4: Review and Finalize the Alarm
Before finalizing, ensure that you review all settings:
- Name the Alarm: Consider naming it something intuitive like "Node Server EBS Writes."
- Description: Optionally include a description that outlines the purpose of the alarm and provides contact information for response.
- Threshold Verification: Confirm that the threshold is set correctly to 200,000 bytes and not a lower, unintended value.
Step 5: Finalize the Alarm Setup
After reviewing and confirming your configuration:
- Click Create Alarm to save your settings.
- Note that the alarm might initially display "Insufficient Data" until enough metrics are collected. Once the threshold is surpassed, the alarm will activate accordingly.
Conclusion
In this guide, you learned how to navigate the AWS CloudWatch console, explore EC2 instance metrics, and set up a CloudWatch alarm to monitor crucial performance indicators. Although this specific alarm does not trigger automated actions by default, you now have the option to integrate additional notifications or automated responses using SNS, Lambda, EC2, or Systems Manager actions.
Thank you for following along. For more detailed AWS monitoring techniques and cloud management tutorials, stay tuned to our upcoming demos.
Further Learning
For additional insights into AWS monitoring and automation, be sure to visit the AWS Documentation and explore related tutorials on our website.
Watch Video
Watch video content
Practice Lab
Practice lab