This article explores CloudWatch Log Insights, a tool for querying and visualizing log data to enhance troubleshooting and monitoring in AWS environments.
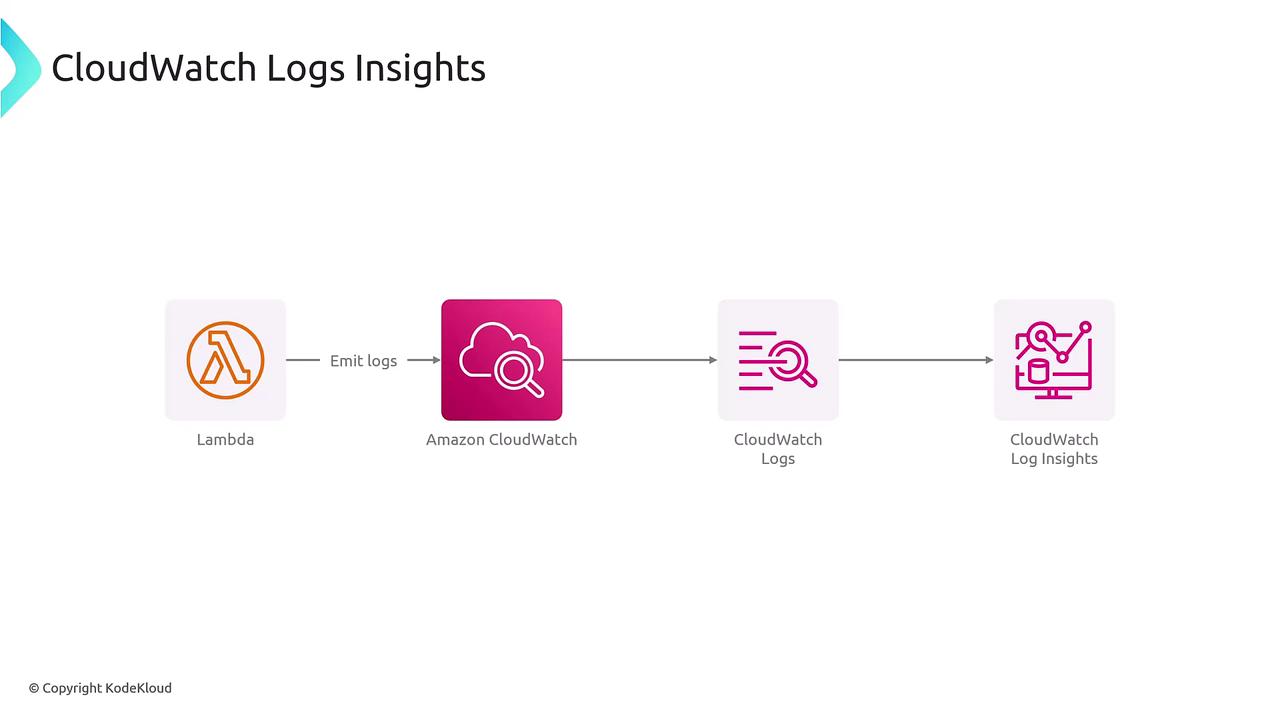
Welcome students. In this article, we explore CloudWatch Log Insights, a powerful feature of Amazon CloudWatch designed to help you gain detailed insights from your log data. Building on our earlier discussions on CloudWatch metrics and logs, this guide focuses on leveraging Log Insights to perform robust queries on your log events, enabling efficient troubleshooting and monitoring.CloudWatch Log Insights is an analytics tool that allows you to query and visualize log data effortlessly. For instance, if your AWS Lambda functions emit logs to CloudWatch, you can quickly extract trends, identify application errors, detect security breaches, or diagnose performance bottlenecks using Log Insights. Its SQL-like query language supports filtering, aggregation, and immediate visualization, making it a vital tool for operational insights.
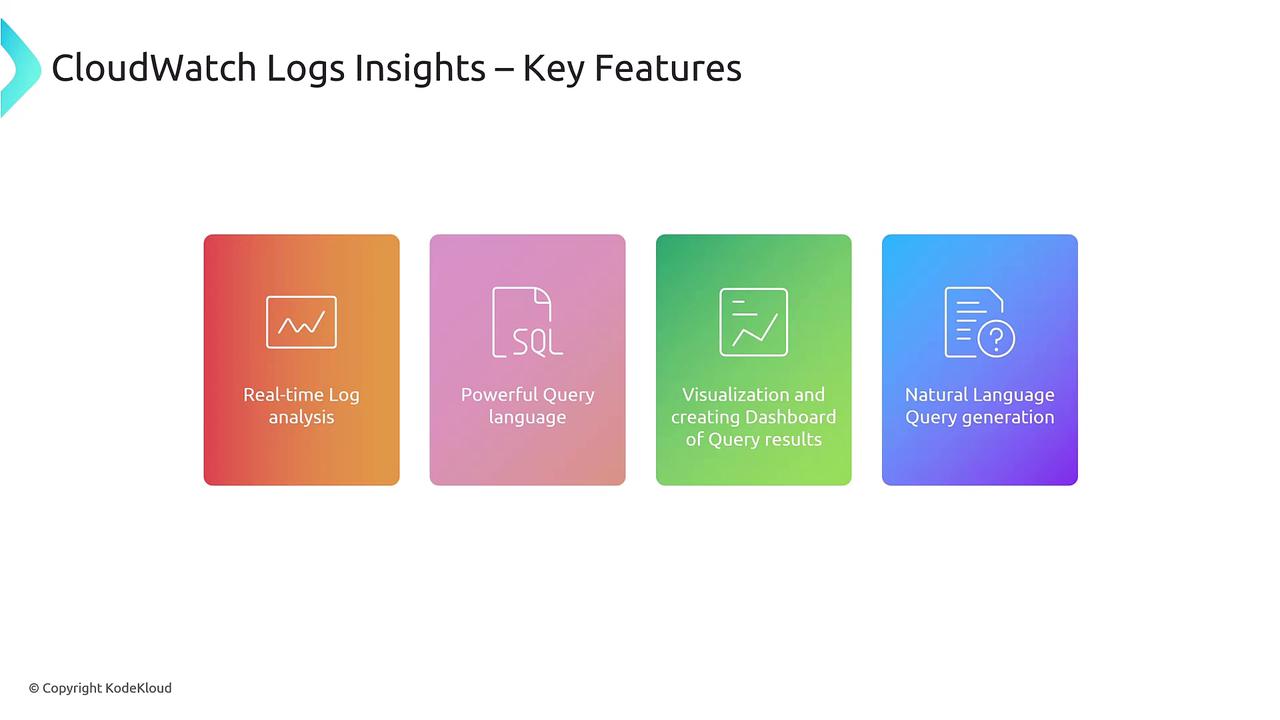
Key features of CloudWatch Log Insights include:
Real-time log analysis
A powerful query language for filtering and aggregating log data
Instant visualization and dashboard integrations
Natural language query generation that converts simple textual requests into complex queries
Let’s consider a scenario where you need to filter log events for AWS S3 operations. The following query retrieves logs related to S3 events by filtering events where the source is identified as S3:
Copy
fields @timestamp, @message| filter @message like /"eventSource":"s3.amazonaws.com"/
In CloudWatch logs, each event includes a timestamp and a message field. The message can contain various details, such as user identity or event source. This query extracts the necessary fields and filters log events to display only those associated with S3.
You can save your queries using the “Save” option in the upper-right area of the CloudWatch Logs Insights console. This makes it easier to reuse and organize your frequently used queries.
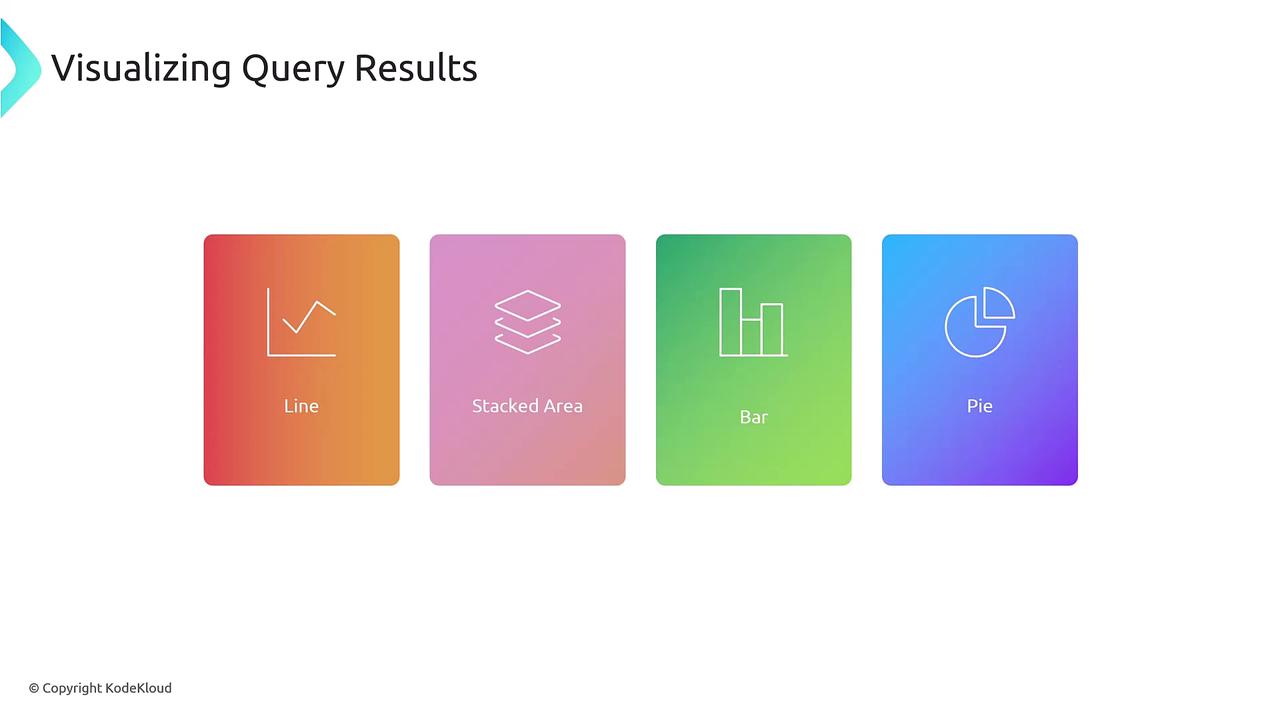
Once the logs are filtered, visualizing the query results is straightforward. CloudWatch Log Insights supports multiple graph types, including line, stacked area, bar, and pie charts. These visualization widgets can be incorporated into CloudWatch Dashboards to build comprehensive monitoring views.
Another powerful capability of CloudWatch Log Insights is its natural language query generation. For example, if you want to fetch logs where a user is uploading objects to an S3 bucket, you might start with a natural language request. The system then converts this request into a query similar to the one below:
Copy
fields @timestamp, @message, userIdentity.userName, requestParameters.bucketName| filter strcontains(@message, "PUT") and strcontains(@message, "s3") and strcontains(@message, "upload")
This query retrieves the timestamp, message, user name, and bucket name from your log events, filtering for entries that contain the terms “PUT”, “s3”, and “upload”. Keep in mind that the query works within the context of the selected log group, which aggregates the relevant log streams containing multiple events.
CloudWatch Log Insights empowers you to analyze log data efficiently with its robust query capabilities and integrated visualization options. Whether it’s real-time log analysis or creating detailed dashboards, the tool is an essential component for monitoring applications and troubleshooting issues in your AWS environment.We’ll see you in the next article!