AWS Certified SysOps Administrator - Associate
Domain 1 Monitoring Logging and Remediation
Demo Finding Logs with CloudWatch Logs
Welcome to this guide on effectively locating logs within AWS CloudWatch Logs. In this walkthrough, you will learn how to navigate the AWS Management Console and use CloudWatch Logs to monitor, query, and analyze log data.
Navigating to CloudWatch Logs
Once you have logged into the AWS Management Console, navigate to the CloudWatch service. CloudWatch is comprised of multiple subservices—including logs, metrics, and X-Ray traces—making it a central tool for monitoring your AWS resources. To specifically access log data:
- Click on Logs in the sidebar.
- Note that logs are organized by log groups, which you either specify when writing logs or are automatically assigned by the system.
Important
Before using live tailing, Log Insights, or similar features, ensure you are accessing the appropriate log group that holds the desired logs.
Below is an image illustrating the list of log groups available in your account:
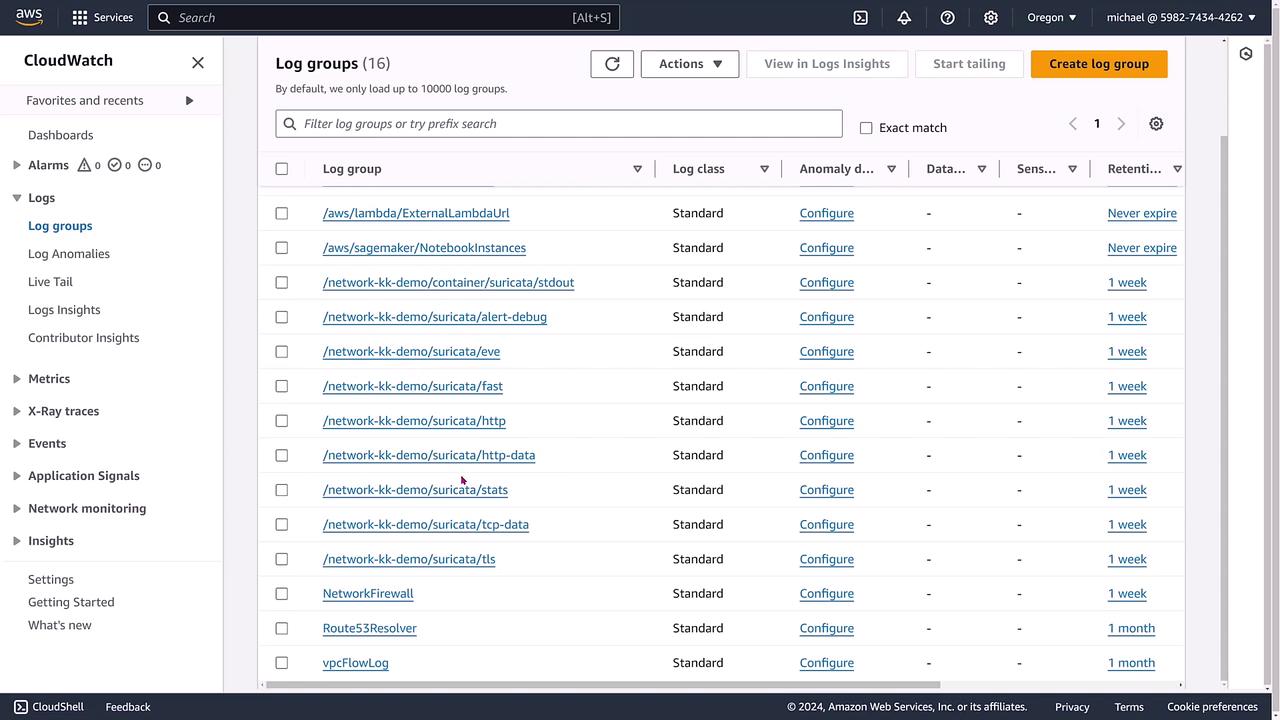
Understanding Log Groups and Streams
In the log groups view, you will see all active log groups associated with your AWS account. This includes log groups for services such as Lambda, SageMaker, Network Firewall, and Route 53 Resolver. In this demonstration, we focus on VPC flow logs—a premier resource for analyzing network traffic.
When you click on the VPC flow logs group, you are presented with a detailed view where you can:
- Start tailing logs live.
- View logs using Log Insights.
- Run custom queries.
- Create metric filters.
The interface also displays several sub-sections like filters, subscription filters, metric filters, anomaly detection, data protection, and contributor insights. The primary area for reviewing the log data is the Log Streams panel.
Below is an image showing the detailed view of a VPC flow log group, including the log streams and available actions:

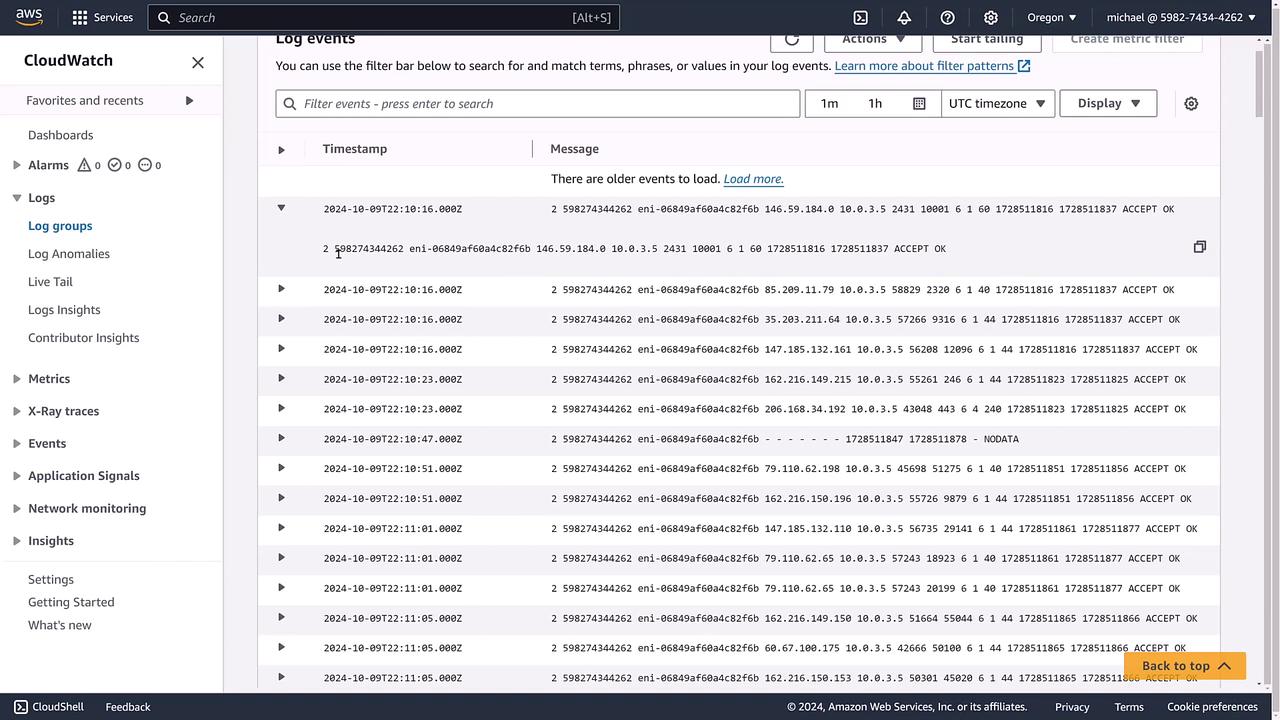
Exploring Log Streams
Each log stream name typically represents an Elastic Network Interface (ENI), which serves as a virtual network card linked to your AWS resources. By clicking the caret next to a log stream, you can expand it to view:
- Timestamps.
- Specific ENI details.
- Network packet flow information.
For instance, if you find a log stream recording accepted traffic, it indicates successful transmissions as opposed to denied traffic, and includes source and destination IP addresses.
Below is an image that displays detailed log events within the CloudWatch interface, including timestamps and status codes:
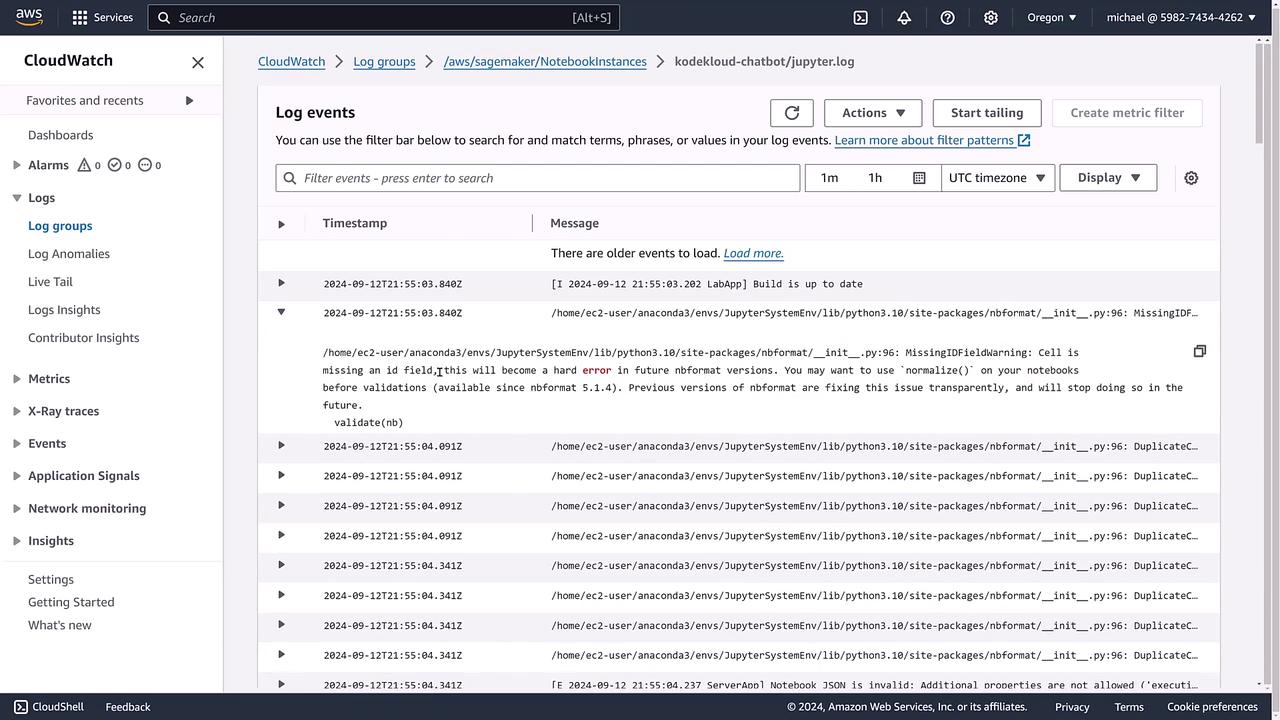
Example: Log Events from a SageMaker Notebook
Next, consider an example using a SageMaker notebook instance. This log group may contain historical logs from sessions where Jupyter was active. The log stream in such cases contains system-generated logs indicating warnings and errors. For example, you might see an entry noting that a notebook cell is missing an ID field—information that is crucial for troubleshooting.
Below is an image showing the log events for a Jupyter notebook instance, complete with timestamps and messages:
Summary
CloudWatch Logs organizes log data into log groups and log streams. Whether you are analyzing VPC flow logs or SageMaker notebook logs, you have access to powerful tools including:
- Live tailing.
- Log Insights.
- Metric filters.
- Exporting logs to S3 (if needed).
This guide provides a comprehensive overview of how to find and manage logs within AWS CloudWatch Logs, empowering you to streamline troubleshooting and performance analysis in your AWS environment.
For additional information, check out the AWS CloudWatch Documentation.
Watch Video
Watch video content