AWS Certified SysOps Administrator - Associate
Domain 1 Monitoring Logging and Remediation
Logging With CloudWatch Logs
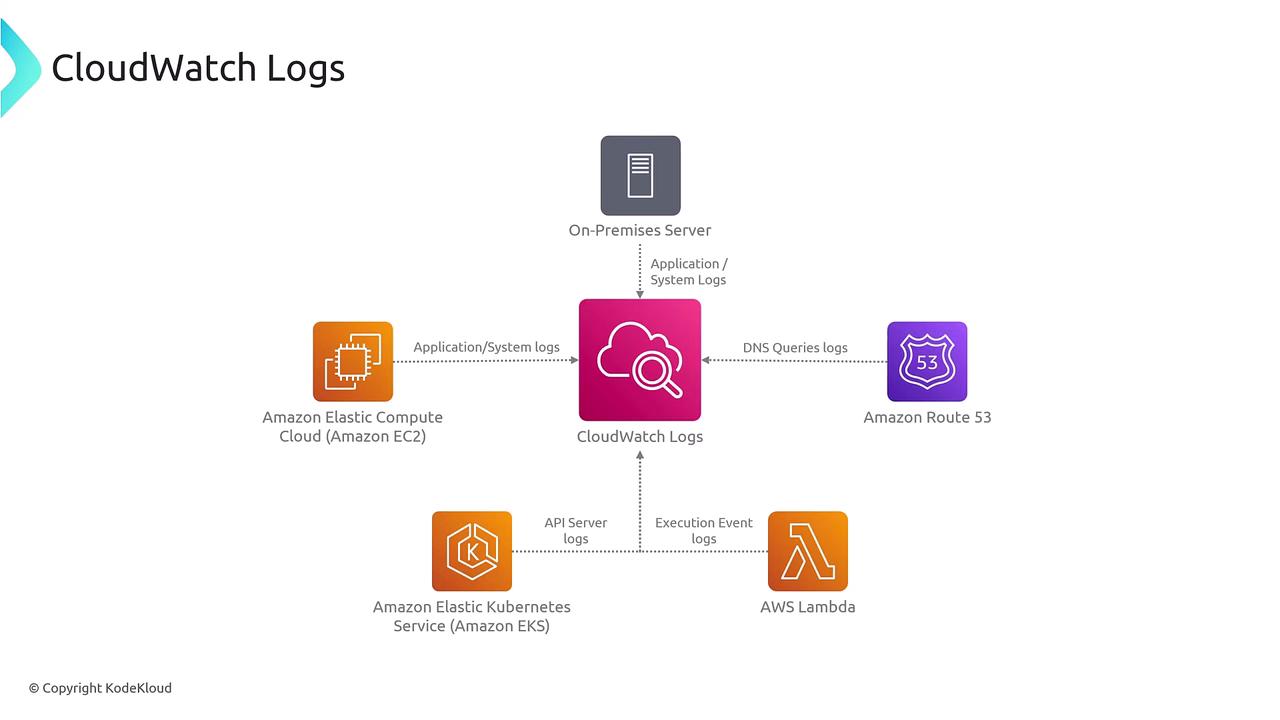
Welcome students! In this lesson, we explore how to harness the power of CloudWatch Logs—a critical service that centralizes log management from on-premises servers, in-cloud servers, or custom applications.
CloudWatch Logs enables you to integrate logs from various sources (such as Kubernetes, Lambda, and more) into one central repository. This makes it simple to view logs directly in the AWS Console, filter them based on specific criteria, and archive them for future troubleshooting and analysis.
CloudWatch Logs offers several powerful functionalities. For example, CloudWatch Logs Insights allows you to derive meaningful insights from services including EC2 instances and Lambda functions. Additionally, you can create alarms using metrics obtained from your log data—a feature that is equally applicable to on-premises servers, enabling you to archive logs or convert them into actionable metrics.
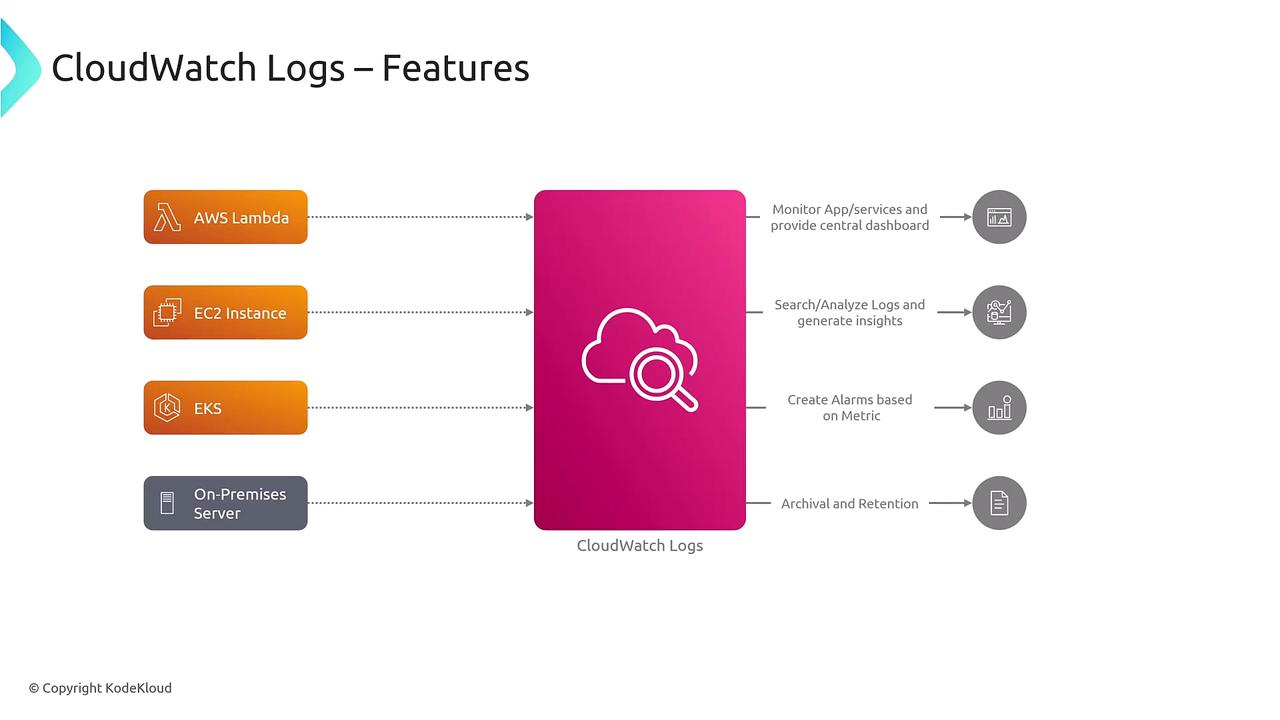
Within AWS environments, nearly every service can generate CloudWatch metrics and logs (provided the appropriate options are enabled). After ingesting the logs, you can:
- Perform interactive searches
- Visualize data through dashboards
- Integrate and forward logs to other AWS services for further processing
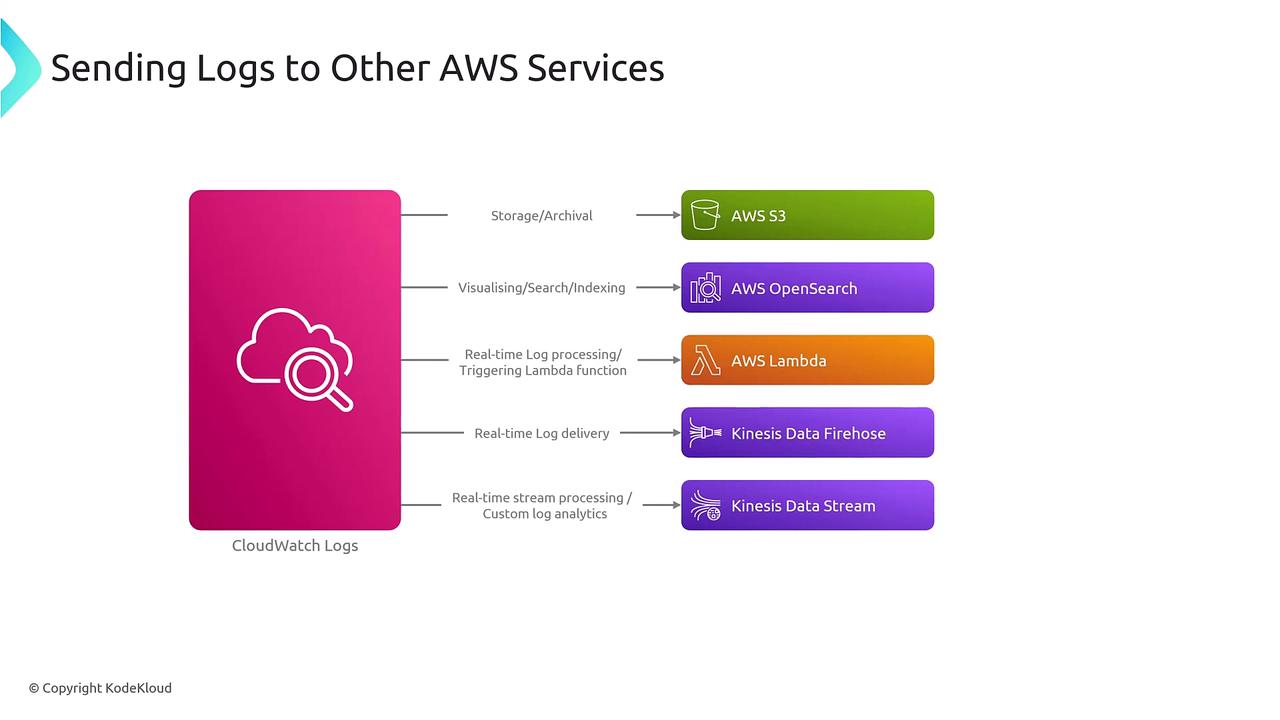
Consider these common integrations:
- Amazon S3: Export logs for long-term storage or regulatory archival.
- Amazon OpenSearch: Forward logs to a document-based search engine, and use tools like Kibana for enhanced visualization.
- AWS Lambda: Trigger Lambda functions based on specific log events for tasks such as log scrubbing or custom processing.
- Kinesis Data Firehose: Stream logs in near real-time to data warehouses such as Amazon Redshift and to traditional RDBMS systems.
- Kinesis Data Streams: Leverage AWS's native streaming service for real-time consumer-producer interactions and custom analytics.
Key Concepts of CloudWatch Logs
CloudWatch Logs is built on several fundamental components:
Log Events:
A log event captures an activity record from your application. It contains a timestamp and a raw UTF-8 encoded event message—both essential for troubleshooting. Consider the following example log events:{"eventVersion":"1.09","userIdentity":{"type":"IAMUser","principalId":"AIDAYZZGS33GRUWILAGDS","arn":"arn:aw..."} {"eventVersion":"1.09","userIdentity":{"type":"IAMUser","principalId":"AIDAYZZGS33GRUWILAGDS","arn":"arn:aw..."} {"eventVersion":"1.09","userIdentity":{"type":"AWSService","invokedBy":"cloudtrail.amazonaws.com"},"eventTi..."}Log Streams:
Log events are aggregated into log streams—a sequence of events from a specific application or service. For example, a single log stream might represent logs originating from CloudTrail.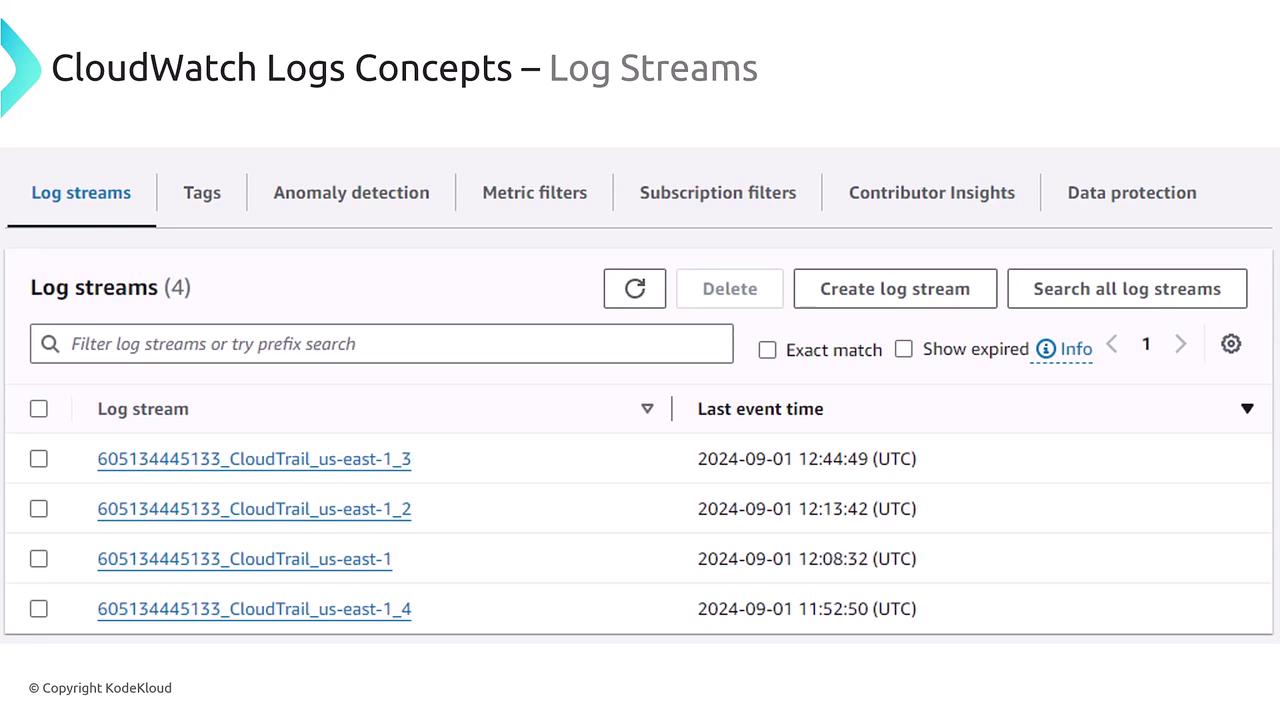
Log Groups:
Log streams are further organized within log groups. A log group can aggregate logs for a collective set of resources such as all Lambda functions for an application, logs from multiple EC2 instances, or API activity logs. Every log stream must belong to a log group—even if it’s a default group.
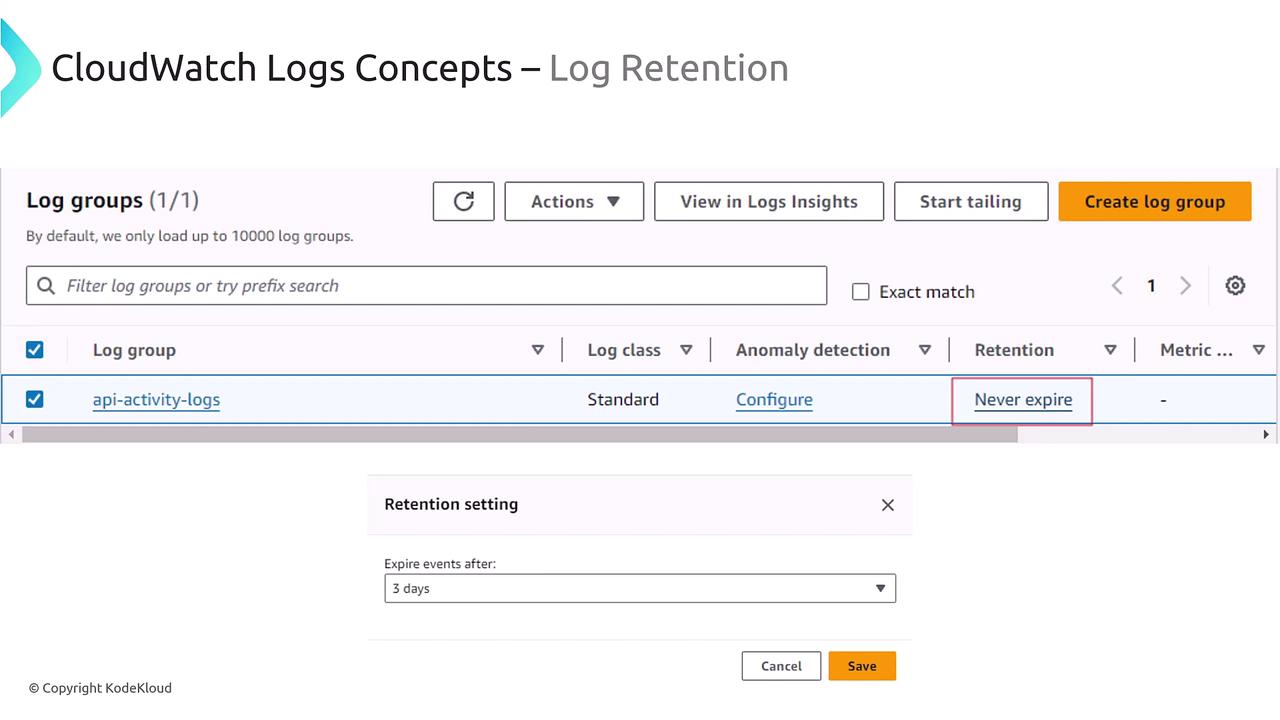
Log Retention and Archival
By default, CloudWatch Logs retains log data indefinitely (i.e., logs never expire) unless you specify a custom retention policy. Note that if you set a custom retention period, the deletion of logs might not occur immediately—it can take up to the specified retention period plus an additional 72 hours (or sometimes longer) for the system to fully process the deletion.
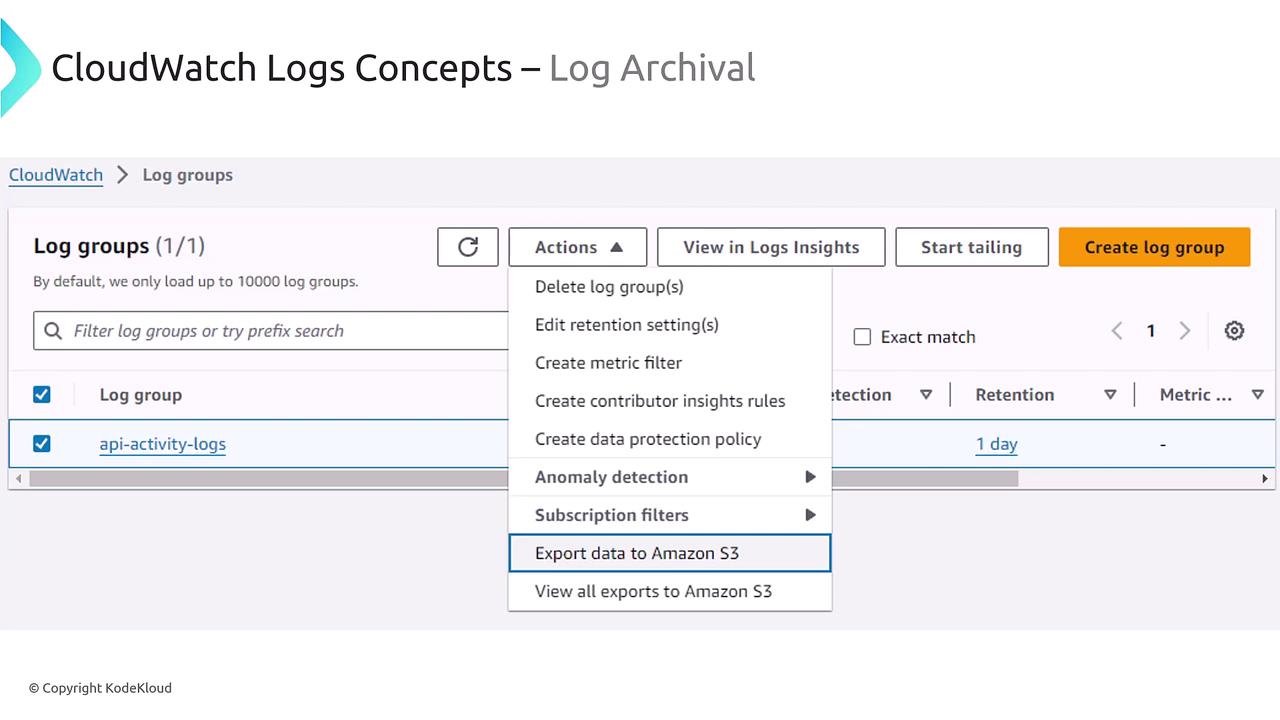
Archiving Log Data
You can export a log group to an Amazon S3 bucket for archiving. This strategy is effective in reducing costs by moving infrequently accessed log data into lower-cost, cold storage. Services such as Athena can then be used to query this archived data if needed.
Additional Features
CloudWatch Logs offers extra functionalities that enhance its utility for operations and troubleshooting:
- Setting up subscription filters
- Enabling anomaly detection for pattern recognition
- Creating metric filters to generate alarms based on log data
- Modifying log retention settings
- Investigating logs effortlessly using CloudWatch Logs Insights
- Tailing logs in real-time (similar to the Unix/Linux "tail" command) for live updates
Tip
Leveraging these features allows you to automate monitoring and respond quickly to unusual log patterns, ensuring prompt issue resolution.
This concludes our lesson on Logging with CloudWatch Logs. We hope you now have a clearer understanding of how to efficiently manage and analyze logs using this robust AWS service. Stay tuned for our next article.
Watch Video
Watch video content