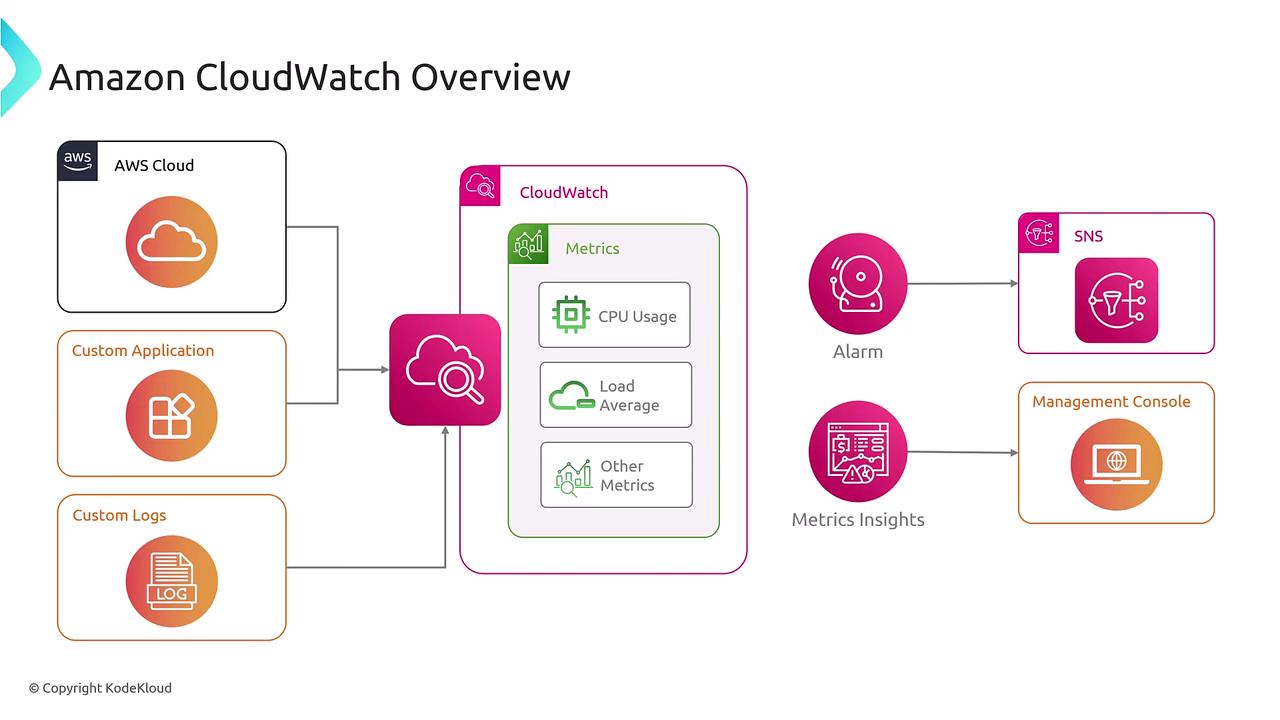
CloudWatch is designed to monitor AWS services as well as custom applications and infrastructure hosted on any operating system. It offers features for gathering metrics, triggering alarms, visualizing data, and generating detailed reports.
Comprehensive Monitoring Capabilities
CloudWatch extends monitoring across various domains such as applications, infrastructure, and networks. It includes about 17 subservices that collectively offer a comprehensive view of your environment. These subservices support functionalities such as:- Metric Collection: Collect metrics over time with options for high-resolution data.
- Alarm Notifications: Trigger notifications based on threshold limits.
- Detailed Reporting: Generate reports to monitor trends and performance.
- Dashboard Visualization: Visualize data and trends using intuitive dashboards.
Deep Dive: Applications, Infrastructure & Networking
CloudWatch is not limited to basic infrastructure monitoring. It provides advanced monitoring and diagnostic capabilities for your whole ecosystem. Imagine you have an EC2 instance that needs monitoring for CPU utilization, disk I/O, and network I/O. Basic metrics are available at one-minute intervals via the hypervisor. For detailed insights—like memory usage and application logs—you can install the CloudWatch agent on your instance. Additionally, you can generate high-resolution metrics at one-second intervals, which are instrumental for setting baselines and detecting anomalies.Application and Service Monitoring
For application monitoring, CloudWatch offers real-time user monitoring and canary synthetics to test user journeys. Using AWS X-Ray, you can perform end-to-end tracing and gain insights into service maps that help pinpoint performance bottlenecks.Network Monitoring
CloudWatch also enables deep network monitoring by collecting VPC flow logs and ELB access logs, offering a granular view of IP traffic. You can even monitor end-to-end network flows with probes between interfaces.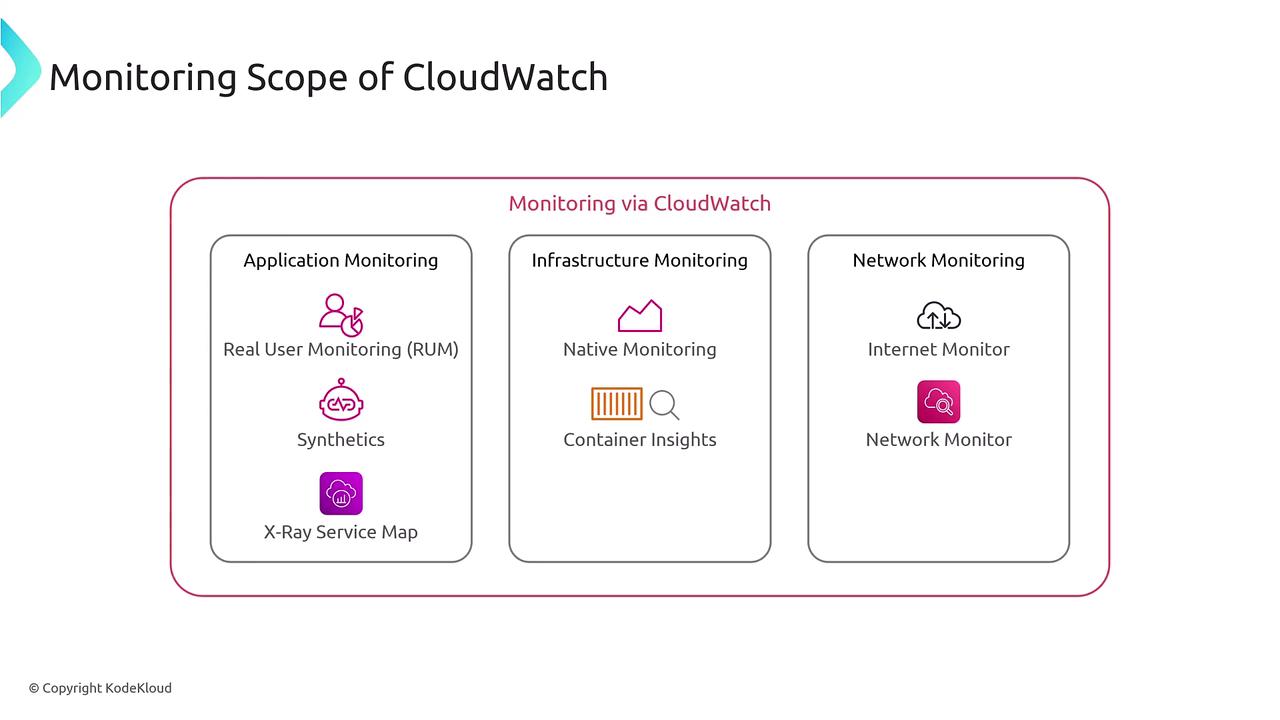
Flexible Data Collection
CloudWatch is highly adaptable when it comes to data collection methods. You can inject metrics using libraries available for almost any programming language or leverage AWS X-Ray for embedding tracking within your code. Whether your workload is hosted on EC2, containerized on Amazon EKS/ECS, or uses enhanced monitoring for services such as Amazon RDS, CloudWatch can handle it seamlessly.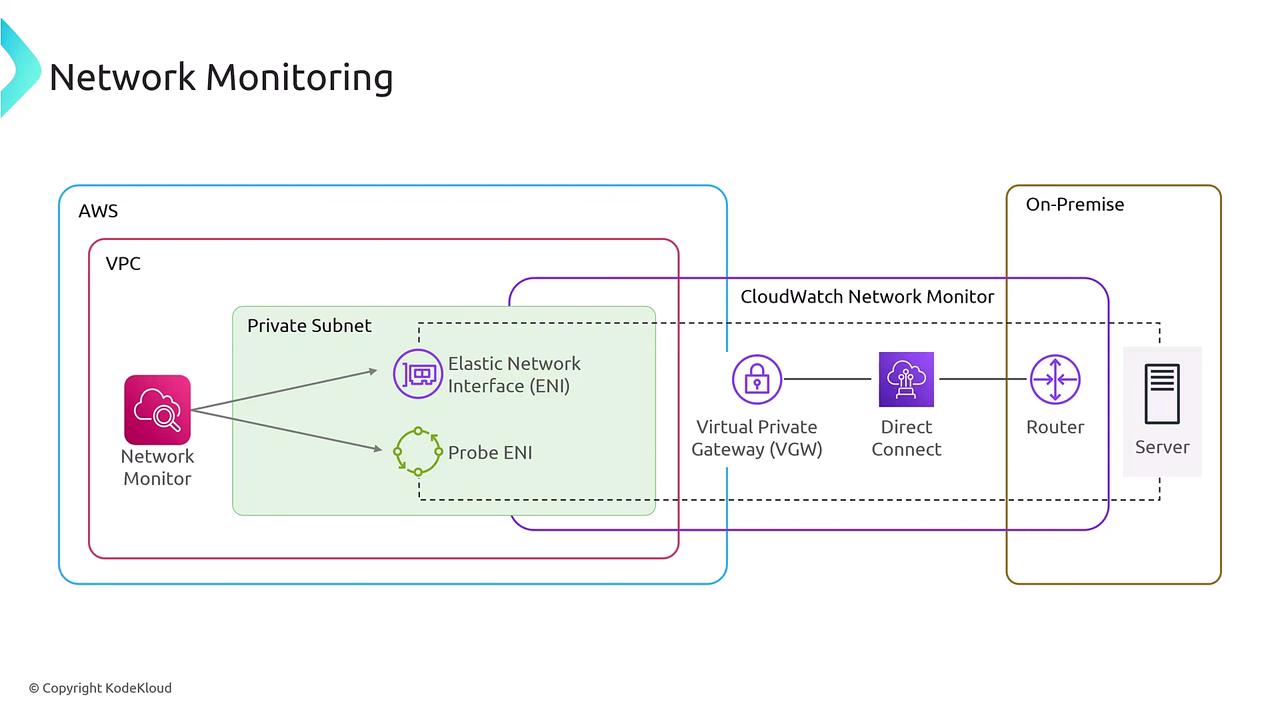
Granular Metrics and Alerts
By default, CloudWatch collects metrics at one-minute intervals, although some metrics default to a five-minute frequency if detailed monitoring isn’t enabled. Installing the CloudWatch agent allows for more granular data collection, enabling precise threshold alerts, notifications, and even custom visualizations.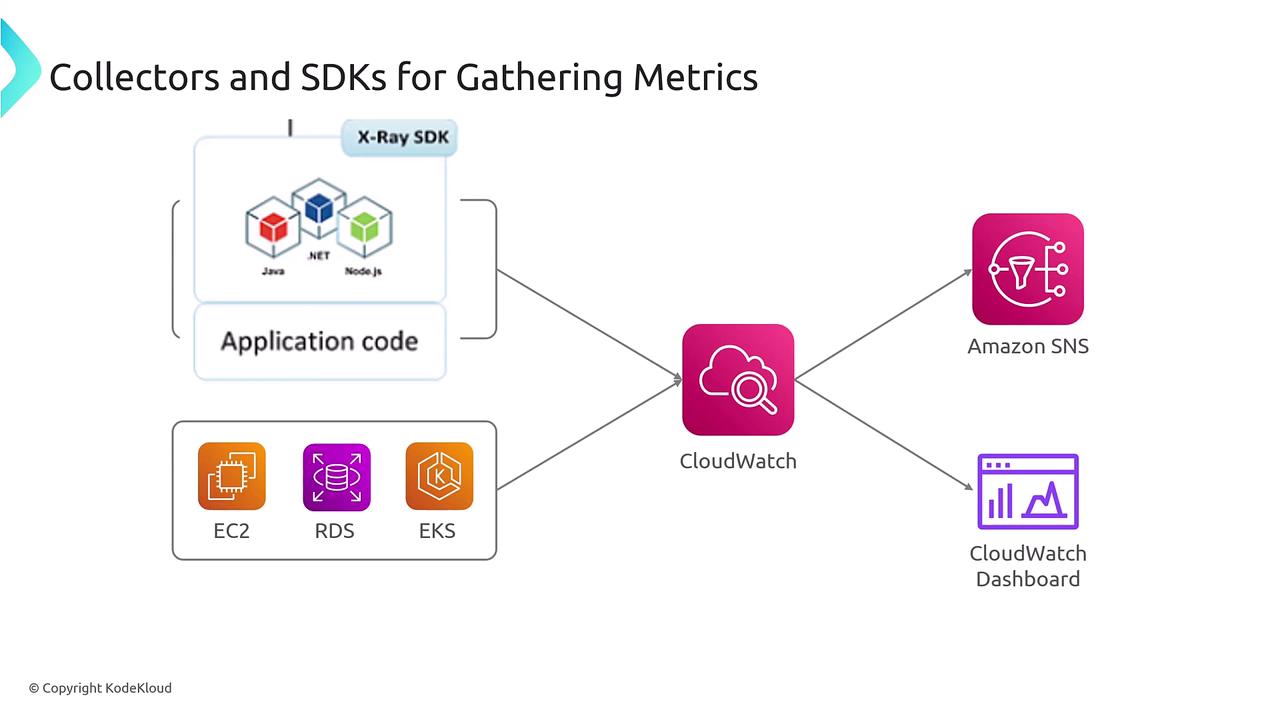
CloudWatch is the native AWS service for monitoring, equipped with an extensive suite of tools for tracking infrastructure, applications, and network metrics. Its adaptable nature and detailed insights make it indispensable for maintaining robust and reliable AWS environments.