AWS Certified SysOps Administrator - Associate
Domain 1 Monitoring Logging and Remediation
Using CloudWatch Agent to Collect Metrics and Logs
Welcome back to the lesson.
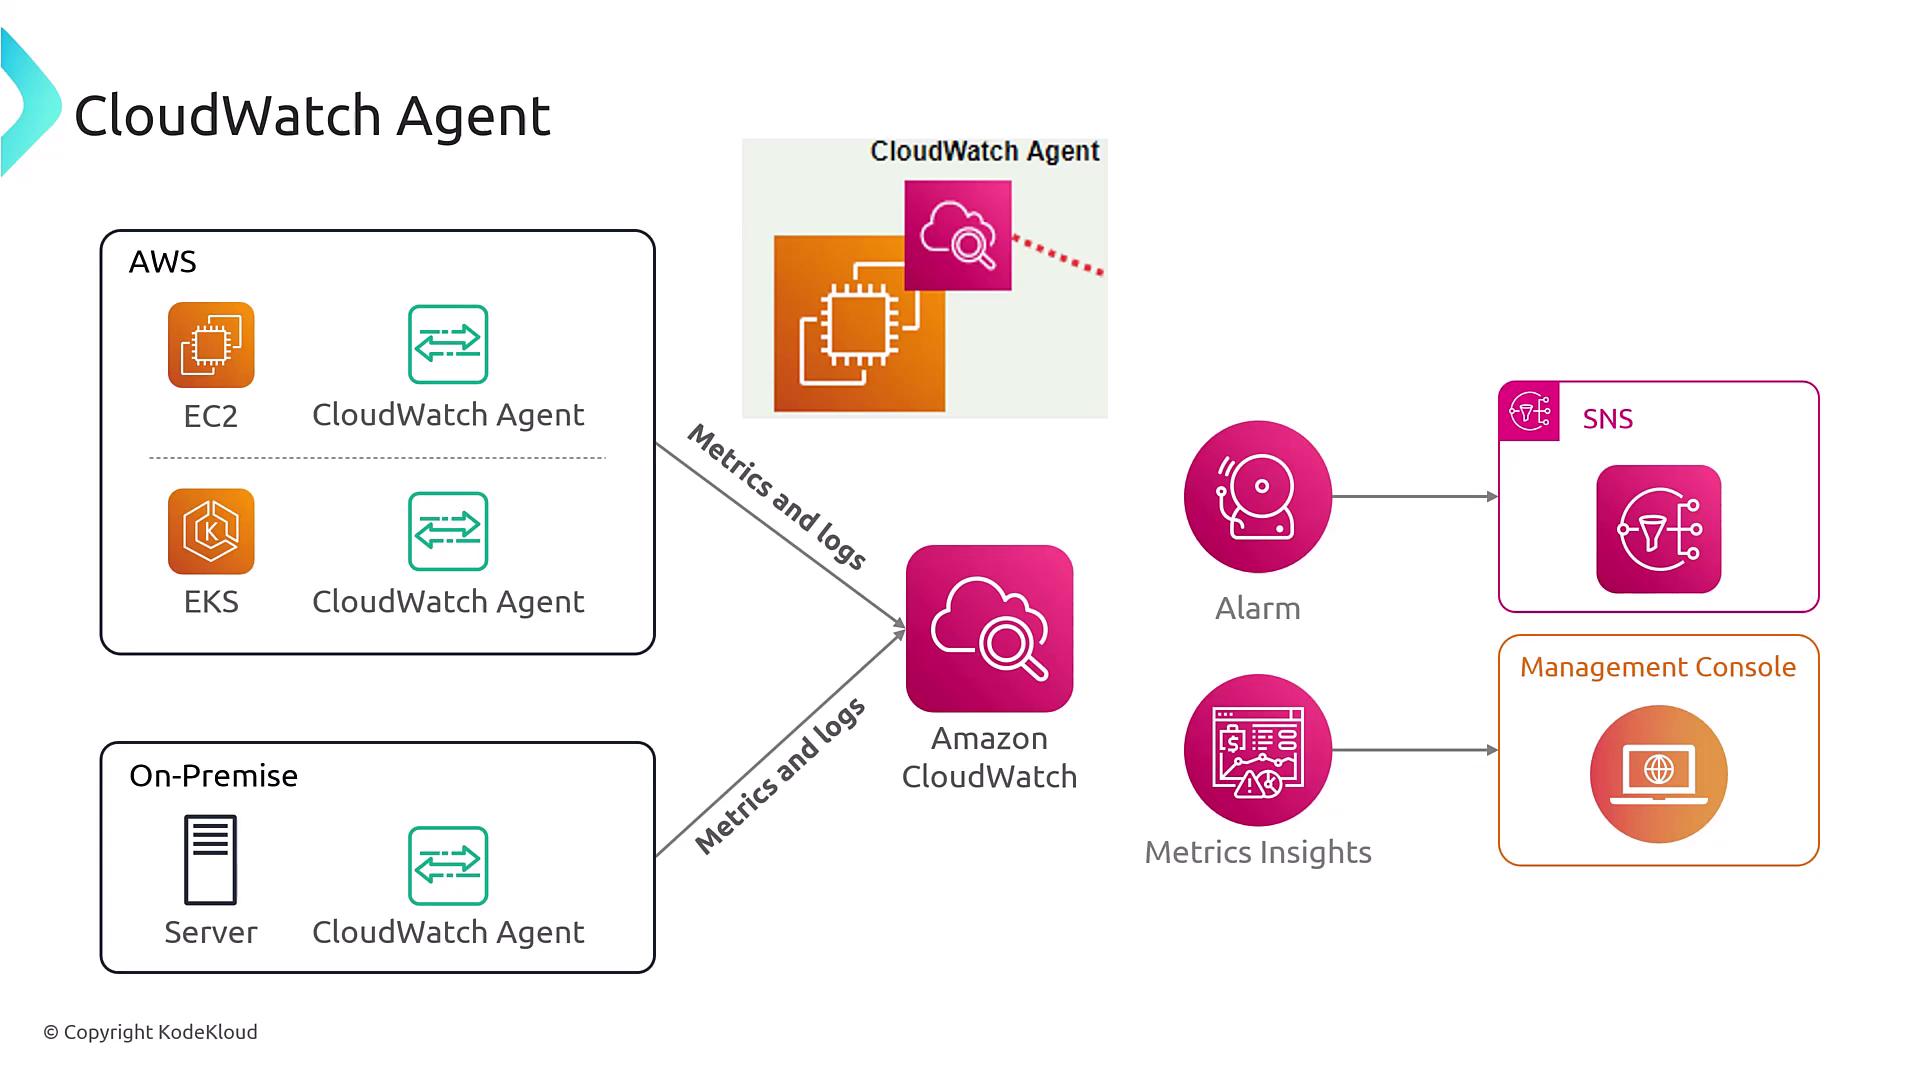
Imagine you need to collect metrics from an operating system—even one that is not hosted on AWS. What if you need to retrieve logs from within the OS, or require a solution that gathers file system-level metrics generated by your application and forwards them to CloudWatch? This is precisely where the CloudWatch Agent proves indispensable.
The CloudWatch Agent is particularly useful in hybrid environments, as it collects detailed system metrics and logs from resources on AWS and on-premises. It aggregates performance data from your infrastructure and applications, forwarding the information to CloudWatch. From there, you can set up alarms, create dashboards, and manage alerts using the AWS Management Console.
Key Concept
Before installing the CloudWatch Agent, ensure that the proper permissions are in place. This guarantees that your server can securely connect to CloudWatch.
Installation and Configuration
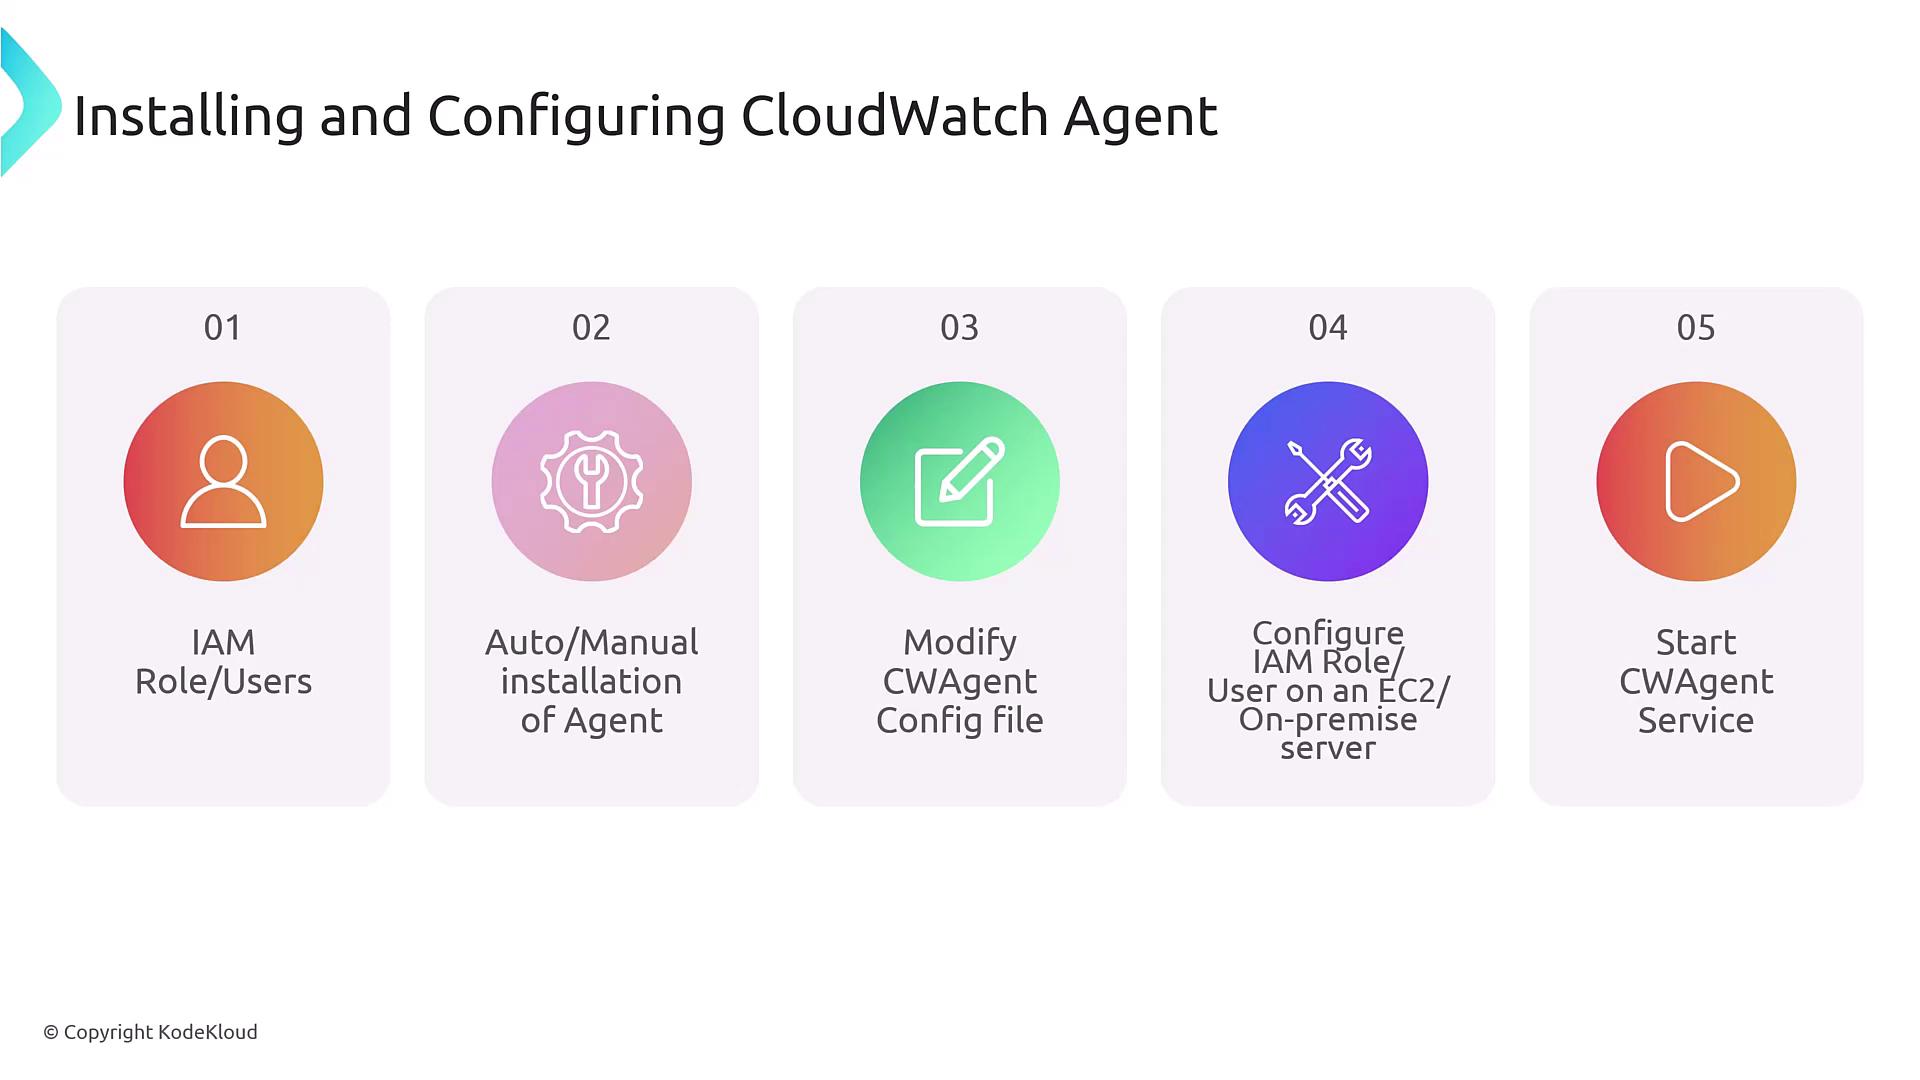
Before starting, follow these essential steps to install and configure the CloudWatch Agent:
- Create the necessary IAM roles or policies for your instance or container.
- Install the CloudWatch Agent on your operating system.
- Configure the CWAgent configuration file to specify which metrics and logs to collect.
- Attach the appropriate permissions to the compute resource (e.g., EC2 instance, ECS task, or EKS service account). In EKS, you might also use a pod identity service so that individual pods have the necessary permissions.
- Start the agent on your operating system.
During installation, note that a similar workflow applies when using the Systems Manager agent. Although a unified agent exists that performs multiple roles, this discussion specifically focuses on the CloudWatch Agent.
Metrics Collection
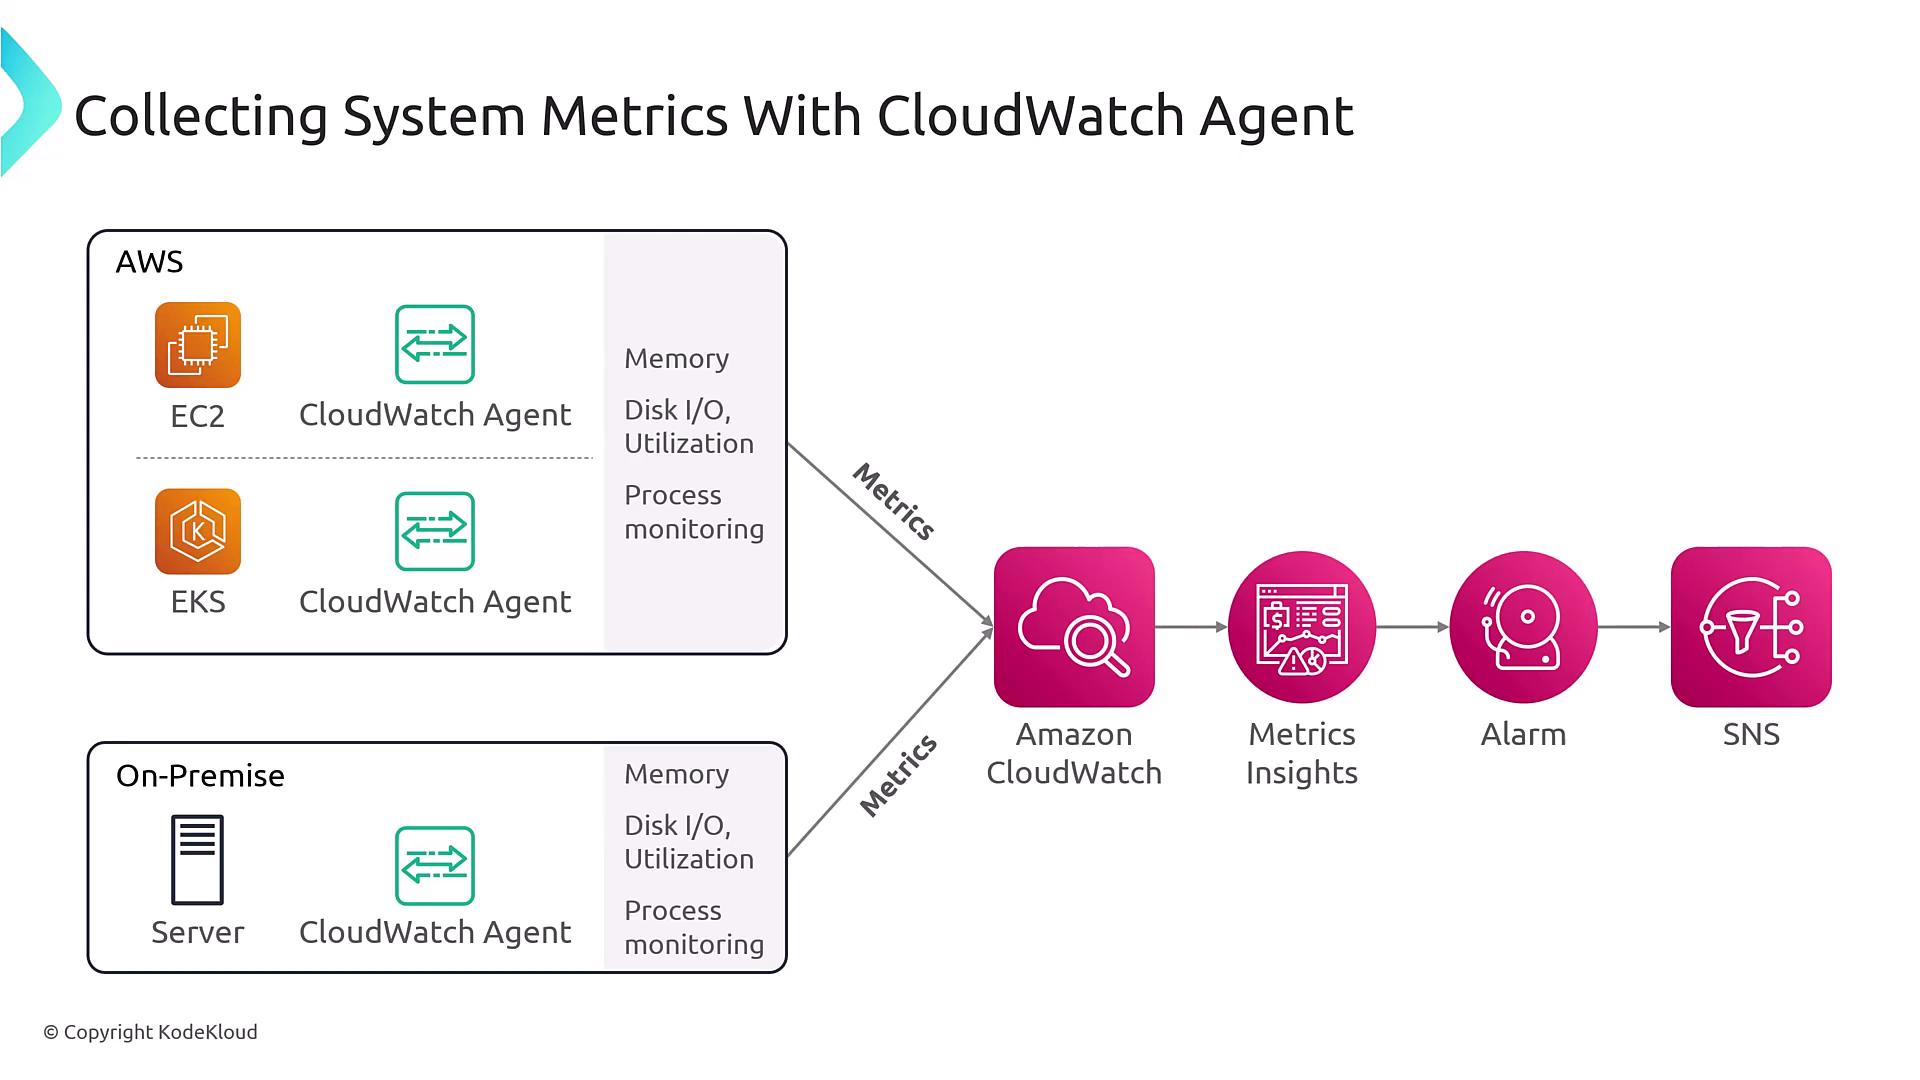
Running the CloudWatch Agent on your operating system allows you to capture in-depth metrics not available via hypervisor-level monitoring alone. For example, the agent provides:
- Detailed memory usage (e.g., the actual percentage of memory utilized by the OS)
- Disk I/O and disk utilization metrics from the OS perspective
- Process-level monitoring
Once the metrics are collected, they are transmitted to CloudWatch, where you can configure alarms and notifications.
Logs Collection
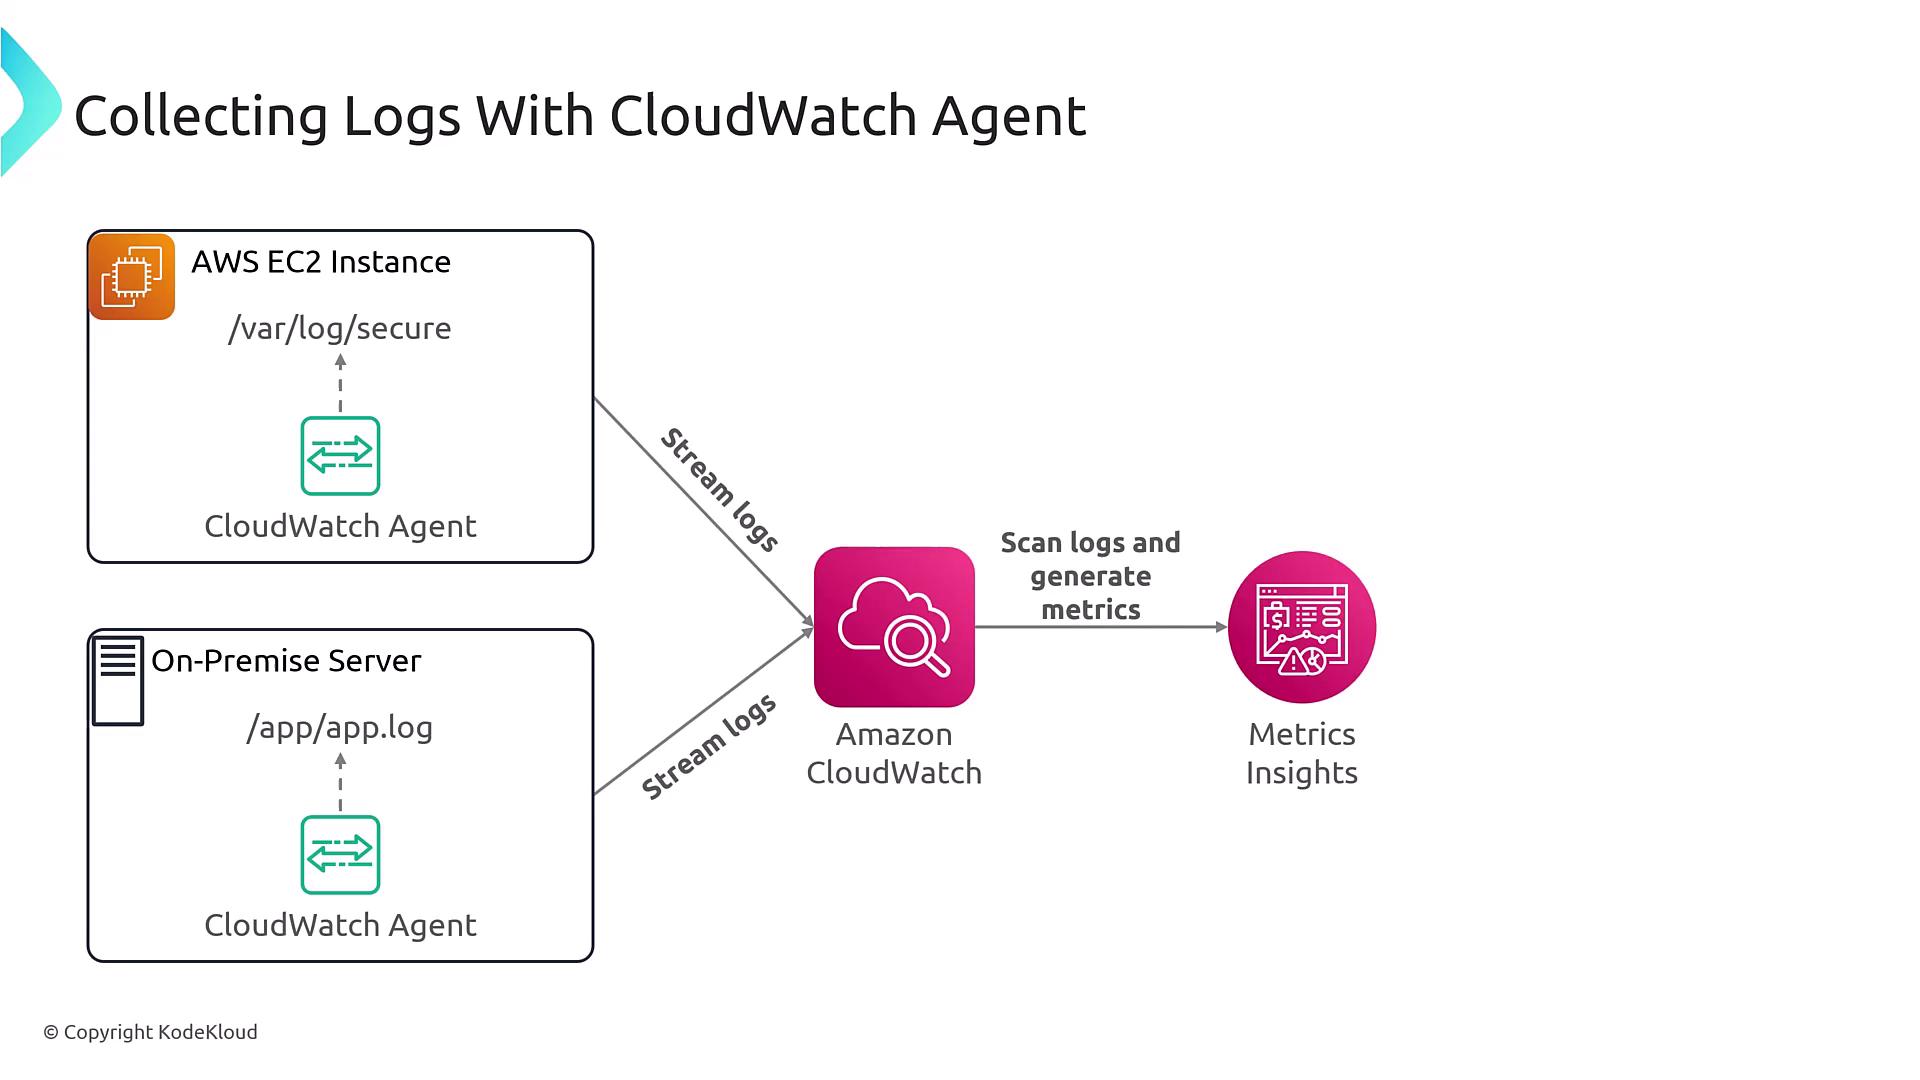
In addition to metrics, the CloudWatch Agent gathers logs based on the configuration in the CWAgent file. For example:
- On Windows systems, it typically collects Windows Event Logs.
- On Linux systems, it gathers messages from directories such as /var/log.
These logs are streamed directly to CloudWatch Logs, where you can apply metric filters and conduct further analysis. The process is consistent whether your server is hosted on AWS or in an on-premises environment.
Best Practices
When using the CloudWatch Agent, consider the following best practices:
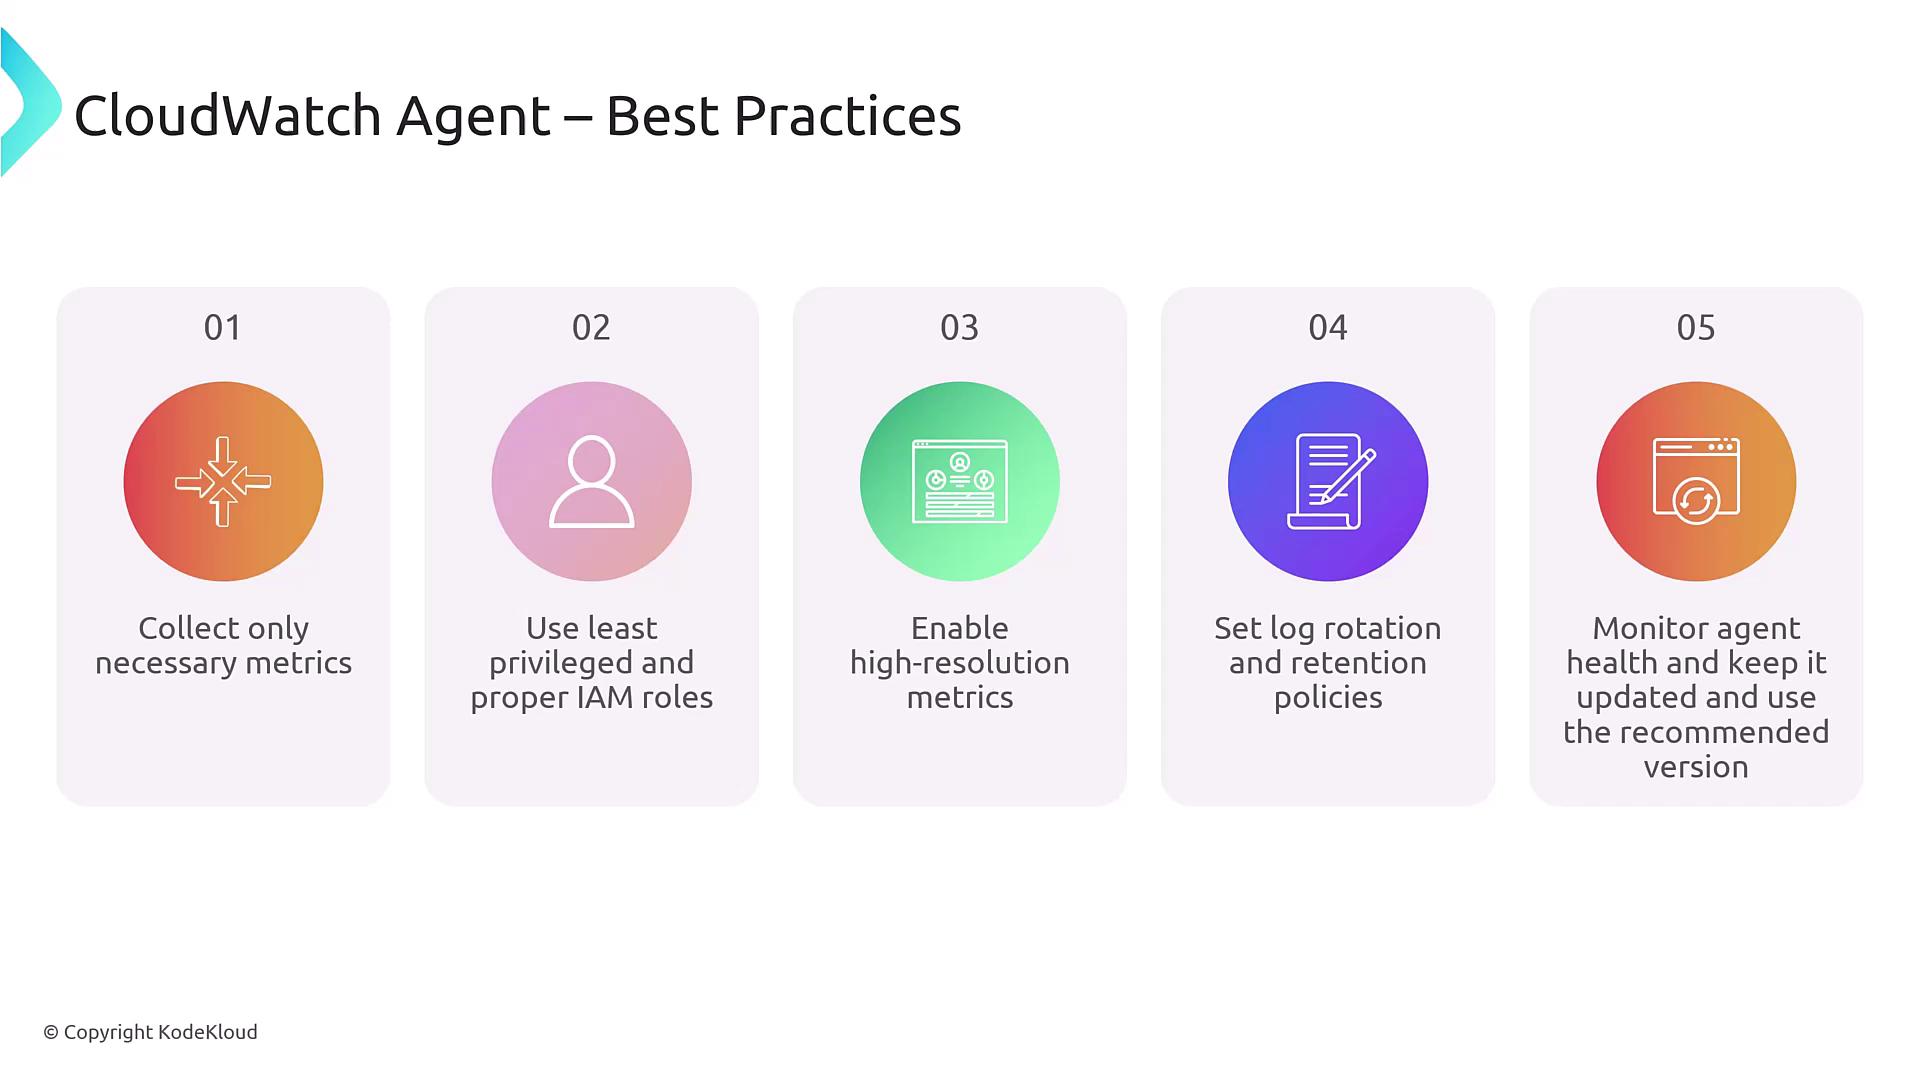
- Collect only necessary metrics and logs: Avoid overwhelming the system by gathering more data than needed.
- Implement the principle of least privilege: Use the minimum required IAM permissions for your compute resources. For example, do not grant administrative permissions solely to facilitate CloudWatch communication.
- Enable high-resolution metrics for critical systems: For high-traffic web applications or other critical environments, consider one-second interval metrics to capture transient performance spikes.
- Configure log rotation and retention policies: Manage data volume and control costs by setting retention policies. Remember, CloudWatch Logs store data indefinitely unless you specify otherwise; consider archiving logs to S3 for long-term cost-effective storage.
- Maintain the agent with regular updates: Use patch management or configuration management tools to ensure the CloudWatch Agent remains up-to-date and fully operational.
Security Alert
Always ensure that your IAM roles and policies follow the principle of least privilege to minimize security risks.
Summary
The CloudWatch Agent is a vital tool for collecting in-depth system metrics and logs from both AWS and on-premises environments. Whether you are monitoring resource usage at the OS or application level, understanding the deployment and configuration of this agent—including permissions, setup, and ongoing maintenance—is crucial for optimizing performance and ensuring security.
In the upcoming exam, you may encounter questions on the use, configuration, and best practices of the CloudWatch Agent. Mastering these concepts will be essential for your success.
We'll catch you in the next lesson.
Watch Video
Watch video content