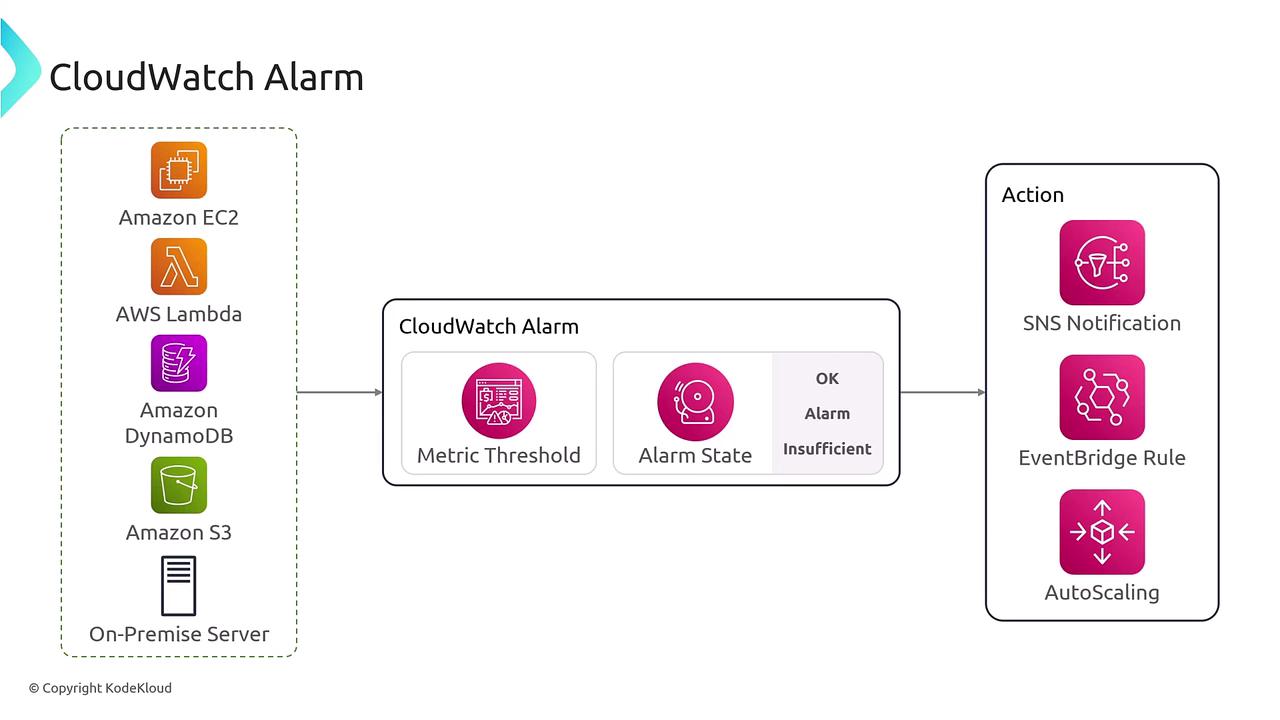
- OK: The metric readings are within acceptable limits.
- Alarm: The metric has exceeded the predefined threshold.
- Insufficient Data: There is not enough data to determine the state, typically when the alarm has just started collecting metrics.
AWS documentation may sometimes refer to the “alarm” state without distinguishing between these nuances. Here, we explicitly define each state for enhanced clarity in your monitoring setup.
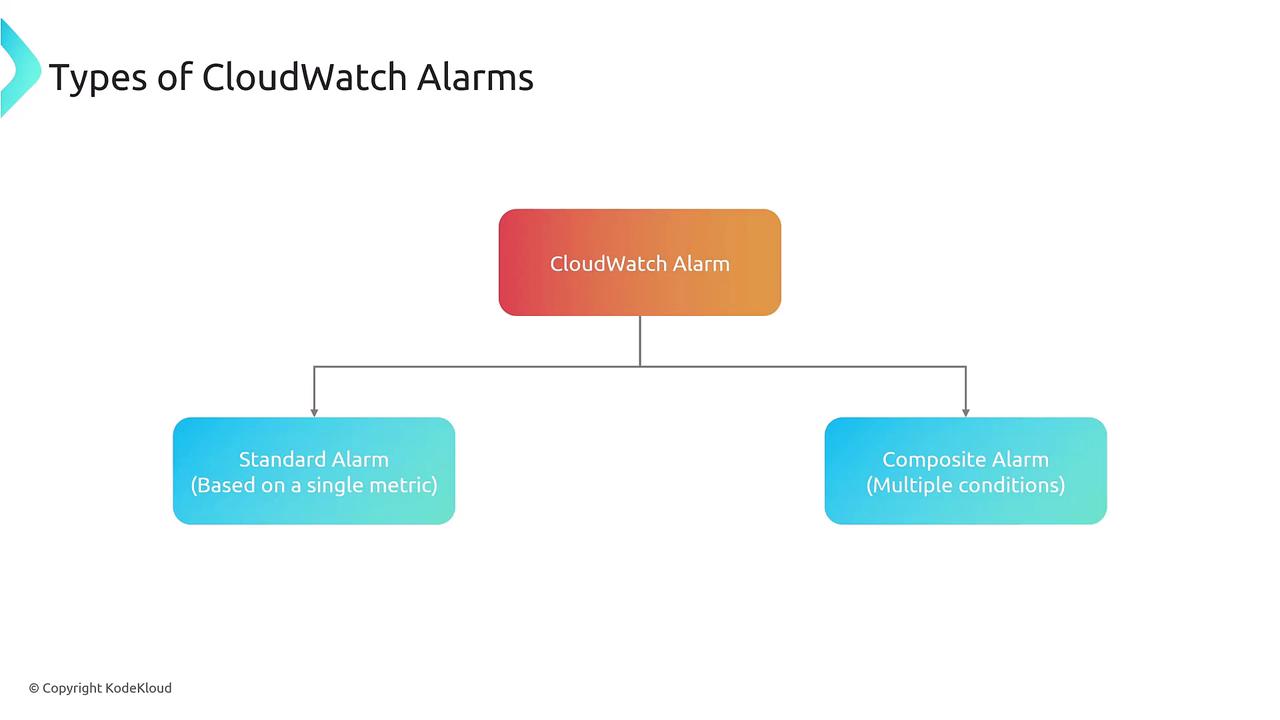
Types of CloudWatch Alarms
CloudWatch supports two primary alarm types:- Standard Alarms: These are typically based on a single metric, such as CPU utilization.
- Composite Alarms: These alarms trigger when multiple conditions occur simultaneously (e.g., a combination of CPU utilization and disk space usage). Although they offer additional flexibility, composite alarms are less commonly used.
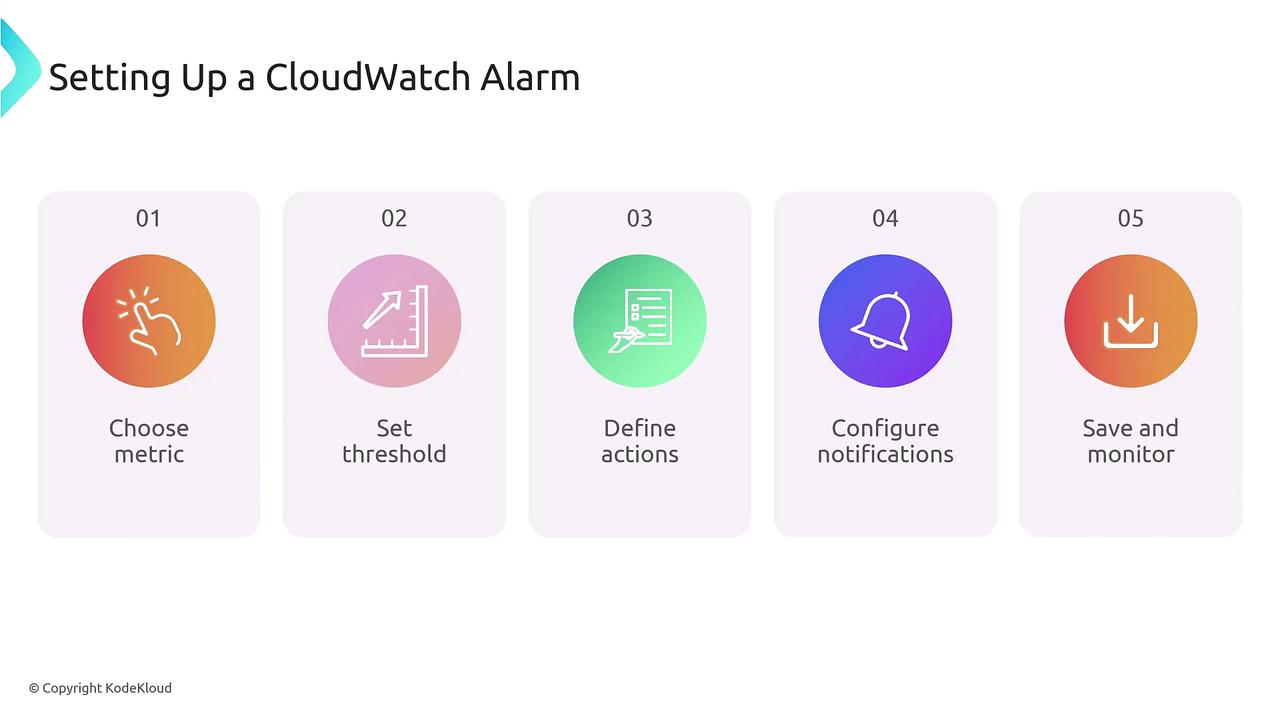
Configuring a CloudWatch Alarm
Setting up a CloudWatch alarm is straightforward. Follow these key steps to ensure efficient monitoring:- Choose a Metric: Decide on the AWS metric you want to monitor.
- Set a Threshold: Define the condition under which the alarm will be triggered. This may involve evaluating the metric over multiple time periods.
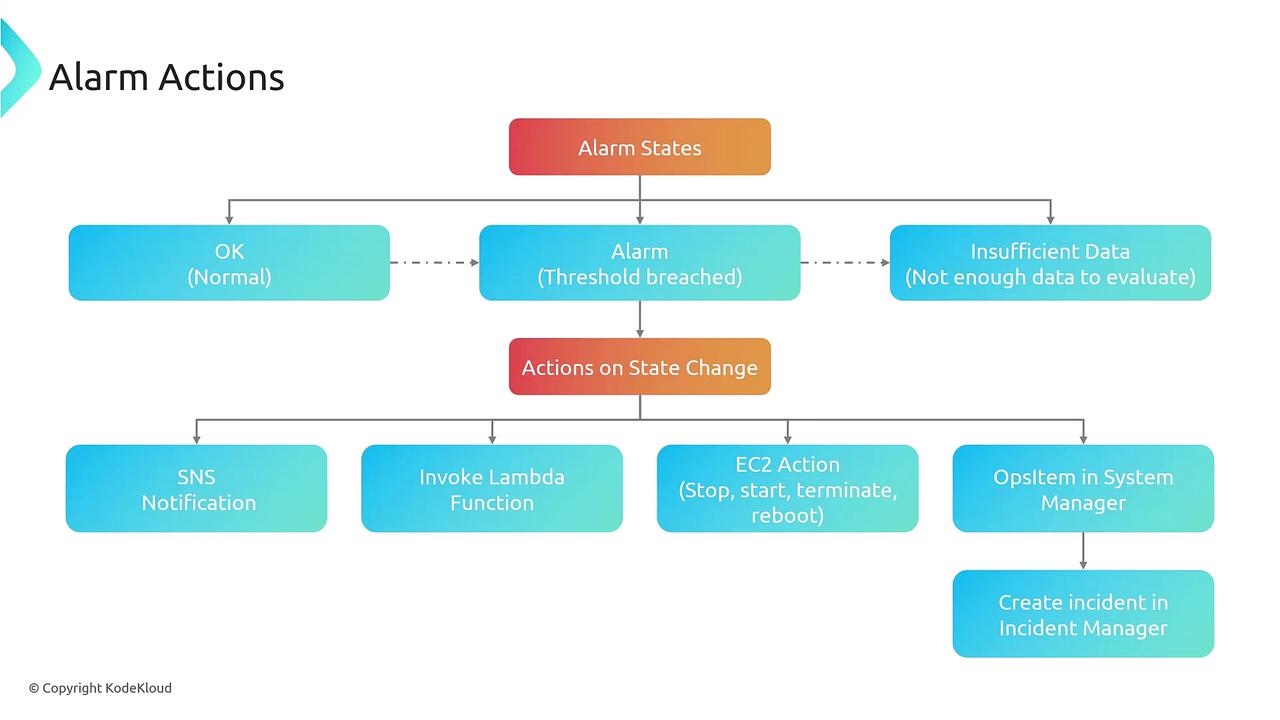
- Define Actions: Determine the automated responses when the threshold is breached, such as sending notifications, triggering auto scaling, or forwarding the event to EventBridge.
- Configure Notifications: Optionally set up additional notifications (commonly using SNS) to ensure you receive timely updates.
- Save and Monitor: Finalize your configuration, allowing the alarm to begin monitoring and reflecting state changes accordingly.
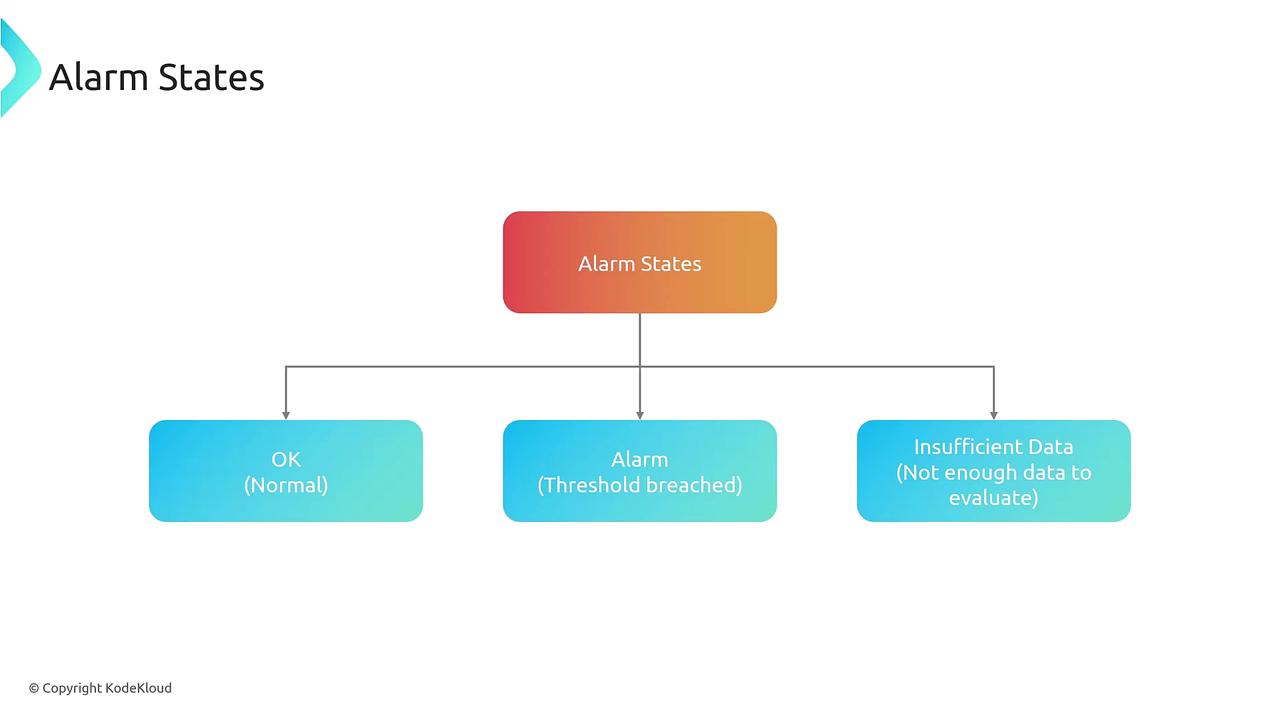
Alarm States
Understanding the three states of a CloudWatch alarm ensures that you can tailor responses and actions appropriately:- OK: The monitored metric is within the acceptable range.
- Alarm: The defined threshold has been breached.
- Insufficient Data: Not enough data is available to make a determination, often occurring during the initial data collection phase.
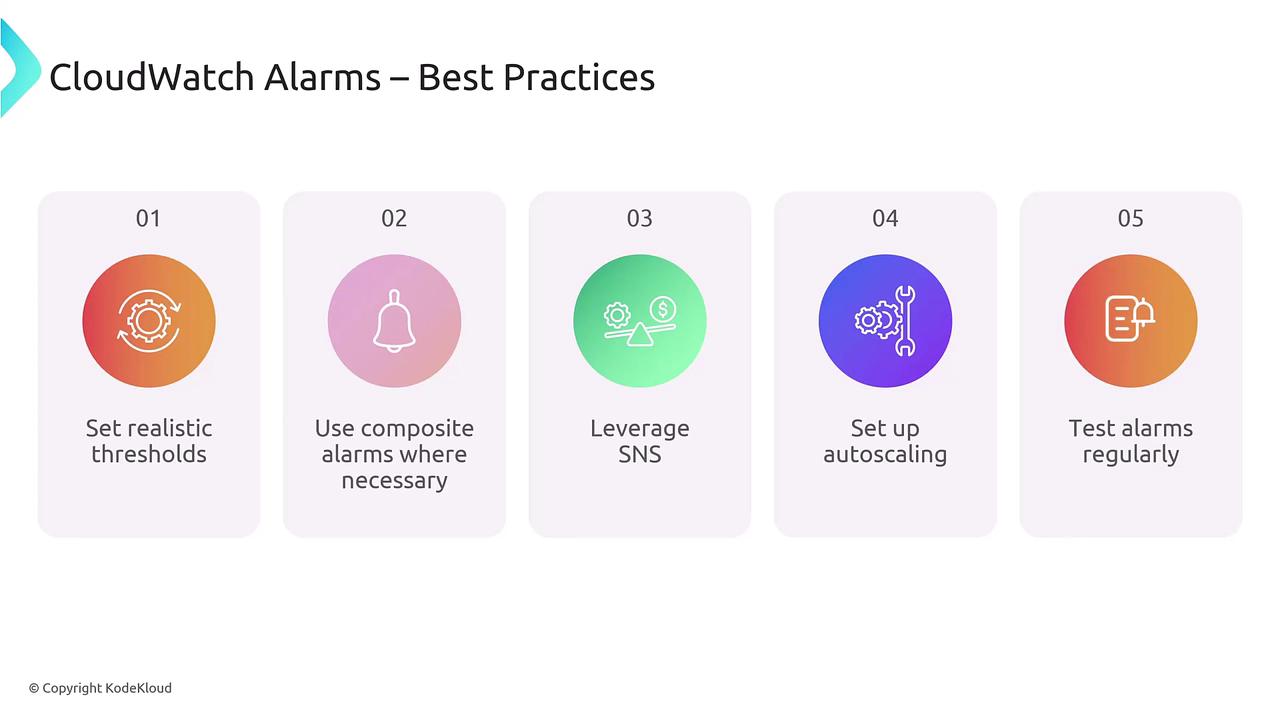
Best Practices for CloudWatch Alarms
To optimize your monitoring setup, consider the following best practices:- Set Realistic Thresholds: Instead of triggering an alarm at every minor spike (e.g., CPU usage of 40% or 50% if these levels are normal), configure the alarm to trigger only when high usage (such as 80%) persists over a certain period (e.g., five minutes). This approach minimizes false positives.
- Use Composite Alarms When Required: Implement composite alarms when you need multiple conditions to be met concurrently. However, be cautious as overly strict conditions might lead to missed alerts.
- Separate Notifications from Actions: While receiving notifications through SNS is crucial, ensure that you do not overwhelm your team with excessive alerts that could cause alert fatigue.
- Automate Remediation: Leverage auto scaling or auto-remediation processes to automatically respond to certain alarms. For example, you might configure auto scaling to kick in when CPU utilization exceeds a specified threshold.
- Regular Testing: Simulate alarm scenarios—even with false positives—before deploying them in a production environment. This ensures both your notifications and automated responses work as expected.