AWS CloudWatch
Cloudwatch Dashboards
Demo Hands on with Cloudwatch Dashboards
In this tutorial, you’ll learn how to provision infrastructure with CloudFormation, deploy a Python application on EC2 that writes to DynamoDB, generate load, and build a centralized AWS CloudWatch dashboard with various widget types.
1. Provision Base Infrastructure with CloudFormation
First, use a CloudFormation template to create the EC2 instance, IAM role, and instance profile.
1.1 CloudFormation Template Overview
This template (cloudwatch_dashboard_cloudformation.yaml
) provisions:
- A t2.micro EC2 instance (Amazon Linux 2).
- An IAM role with full EC2, DynamoDB, and SSM permissions.
- An instance profile to attach the role to the instance.
Resource | Type | Details |
---|---|---|
EC2 Instance | AWS::EC2::Instance | t2.micro, Amazon Linux 2, uses SSM Session Manager |
IAM Role | AWS::IAM::Role | Full access to EC2, DynamoDB, and SSM |
IAM Instance Profile | AWS::IAM::InstanceProfile | Binds the IAM role to the EC2 instance |
# cloudwatch_dashboard_cloudformation.yaml
Parameters:
LatestAmiId:
Type: AWS::SSM::Parameter::Value<AWS::EC2::Image::Id>
Default: /aws/service/ami-amazon-linux-latest/amzn2-ami-hvm-x86_64-gp2
Resources:
MyEC2Instance:
Type: AWS::EC2::Instance
Properties:
ImageId: !Ref LatestAmiId
InstanceType: t2.micro
IamInstanceProfile: !Ref InstanceProfile
InstanceProfile:
Type: AWS::IAM::InstanceProfile
Properties:
Roles:
- Ref: EC2DynamoDBRole
EC2DynamoDBRole:
Type: AWS::IAM::Role
Properties:
AssumeRolePolicyDocument:
Version: "2012-10-17"
Statement:
- Effect: Allow
Principal:
Service: ec2.amazonaws.com
Action: sts:AssumeRole
Policies:
- PolicyName: EC2DynamoDBSSMFullAccess
PolicyDocument:
Version: "2012-10-17"
Statement:
- Effect: Allow
Action:
- ec2:*
- dynamodb:*
- ssm:*
Resource: '*'
Outputs:
EC2InstanceID:
Description: 'ID of the newly created EC2 instance'
Value: !Ref MyEC2Instance
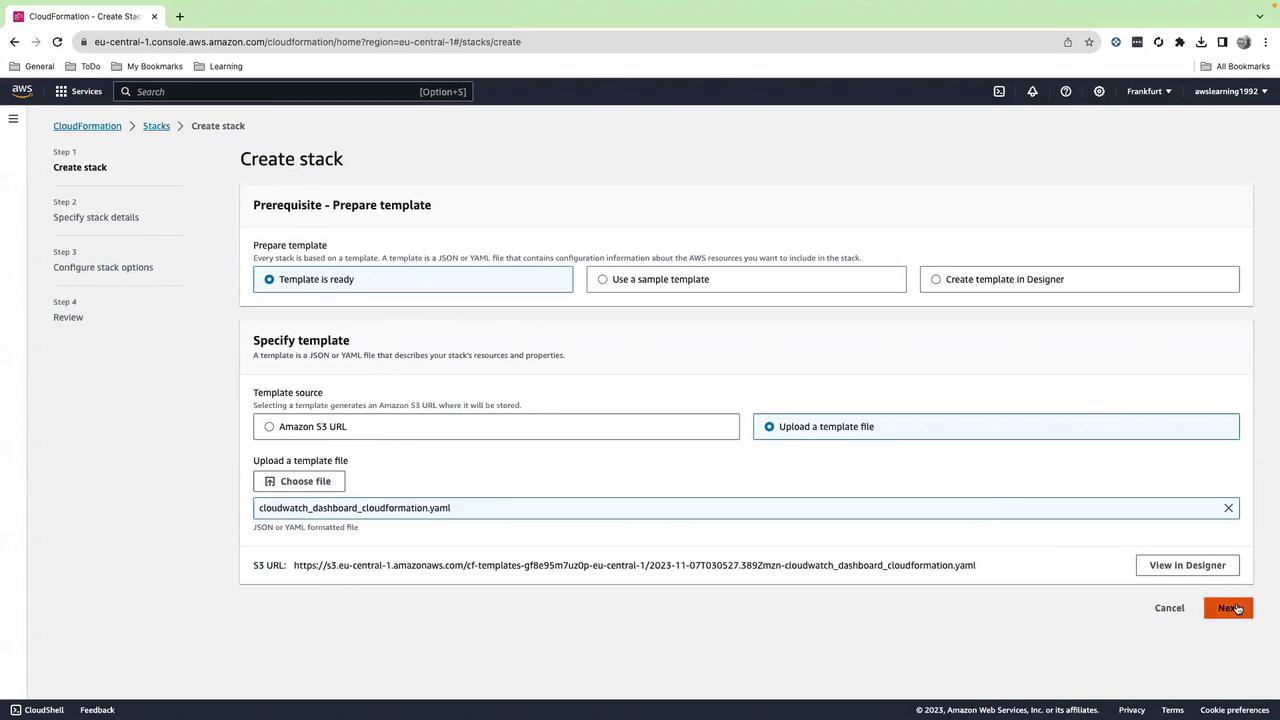
- Open the AWS CloudFormation console.
- Click Create stack → With new resources (standard).
- Under Template source, select Upload a template file, choose the YAML above, then Next.
- Enter CloudWatch-Dashboard-App01 as the stack name, accept defaults, acknowledge IAM changes, and click Create stack.
Wait until the stack reaches CREATE_COMPLETE.
Note
Make sure you deploy in the same AWS Region where you intend to run your workloads.
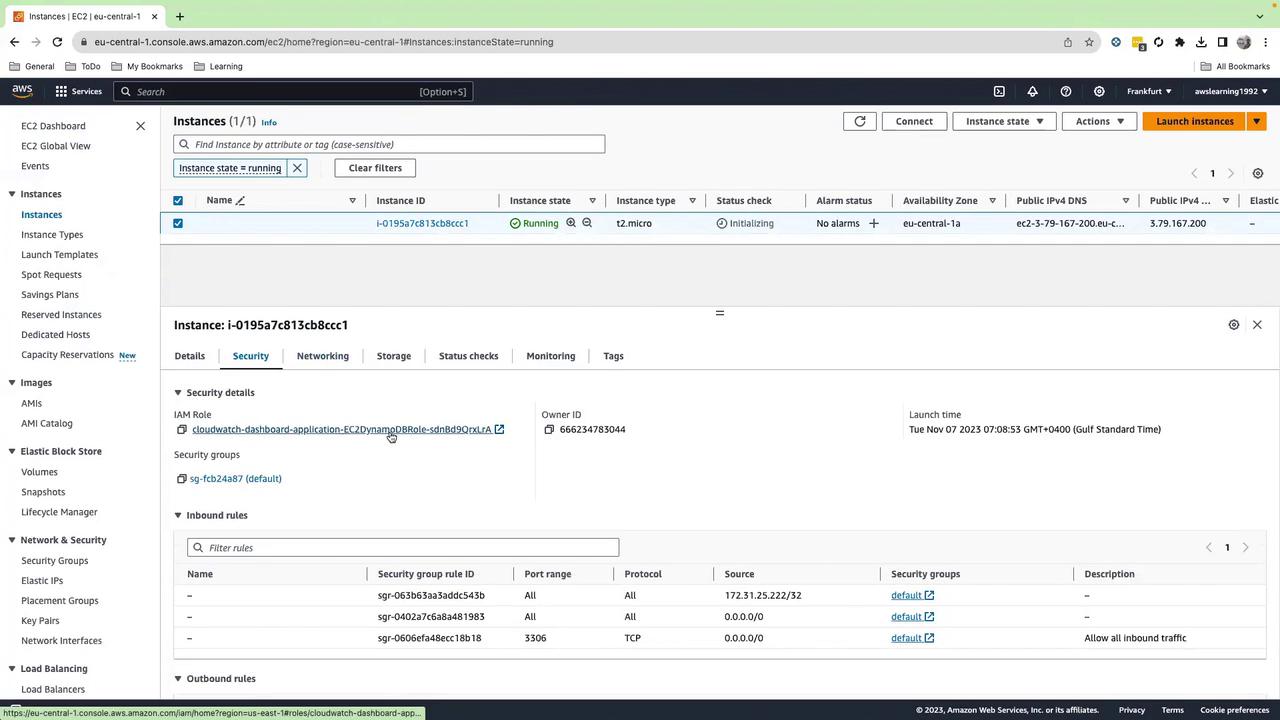
2. Verify EC2 Instance and IAM Role
- Open the EC2 console.
- Confirm your t2.micro instance is running.
- Under Security → IAM role, ensure
EC2DynamoDBRole
is attached.
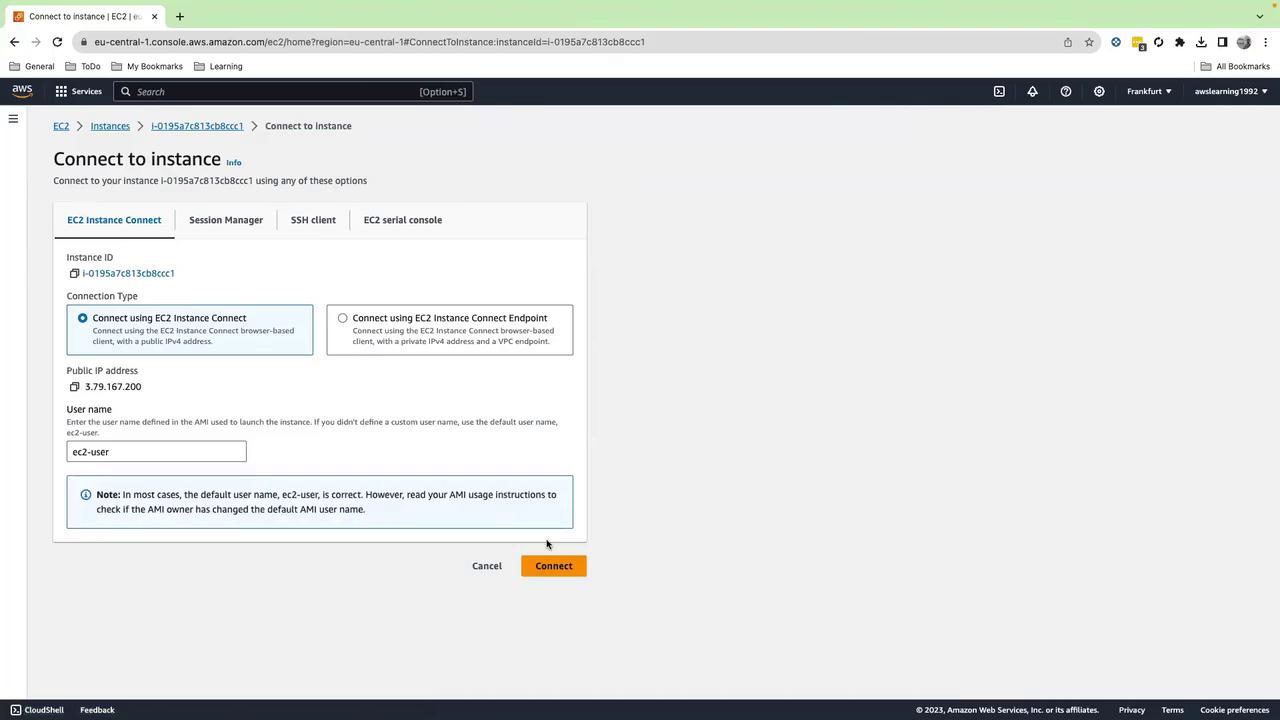
3. Connect via Session Manager
Use AWS Systems Manager Session Manager to get a shell without SSH keys:
- In the EC2 console, select the instance.
- Click Connect → Session Manager → Connect.
Once connected, switch to root and navigate:
sudo su -
cd /home/ec2-user
4. Install Dependencies and Deploy Sample Application
4.1 Install pip
curl -O https://bootstrap.pypa.io/get-pip.py
python3 get-pip.py
4.2 Install stress
yum install -y stress
4.3 Prepare the Application Directory
mkdir -p application_01 && cd application_01
cat > requirements.txt <<EOF
boto3
EOF
pip3 install -r requirements.txt
4.4 Create the Python Application
In application_01/app.py
:
# application_01/app.py
import boto3
from botocore.exceptions import ClientError
import random, time, decimal
dynamodb = boto3.resource('dynamodb')
order_rand = random.Random()
item_rand = random.Random()
quant_rand = random.Random()
def create_table(name):
try:
table = dynamodb.create_table(
TableName=name,
KeySchema=[{'AttributeName': 'order_id', 'KeyType': 'HASH'}],
AttributeDefinitions=[{'AttributeName': 'order_id', 'AttributeType': 'S'}],
ProvisionedThroughput={'ReadCapacityUnits': 5, 'WriteCapacityUnits': 5}
)
table.wait_until_exists()
print(f"Table {name} created successfully.")
except ClientError as e:
if e.response['Error']['Code'] == 'ResourceInUseException':
print(f"Table {name} already exists.")
else:
print(f"Unexpected error: {e}")
def put_random_shopping_data(name):
table = dynamodb.Table(name)
count = 0
while True:
order_id = str(order_rand.randint(1, 100000))
item_name = f"item_{item_rand.randint(1, 100)}"
quantity = quant_rand.randint(1, 20)
price = decimal.Decimal(round(random.random()*1000, 2))
table.put_item(Item={
'order_id': order_id,
'item_name': item_name,
'quantity': quantity,
'price': price
})
print(f"PutItem succeeded: {order_id}, {item_name}, {quantity}, {price}")
count += 1
if count % 100 == 0:
print("Sleeping for 1 minute...")
time.sleep(60)
if __name__ == '__main__':
table_name = 'ShoppingData'
create_table(table_name)
put_random_shopping_data(table_name)
Run the application:
python3 app.py
# Output will confirm table creation and ongoing PutItem calls
Warning
This script runs indefinitely until you stop it (Ctrl+C).
5. Verify DynamoDB Table
In the DynamoDB console, under Tables, confirm ShoppingData is active:
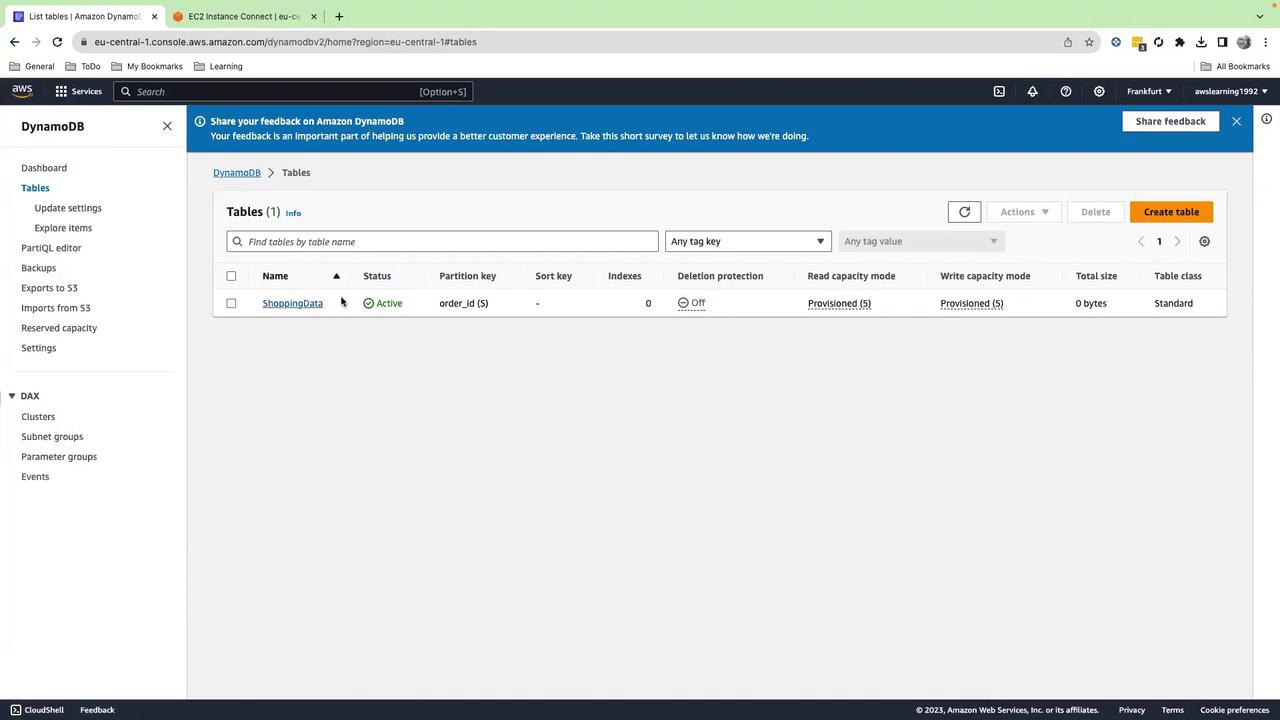
6. Apply Load with a Stress Script
Open a new Session Manager tab to keep app.py
running, then:
cat > stress_test.sh <<'EOF'
#!/bin/bash
# Disk Stress
dd if=/dev/zero of=/tmp/testfile bs=1M count=100 iflag=fullblock
# CPU Stress (2 cores, 60s)
stress --cpu 2 --timeout 60
# Memory Stress (2 VMs, 128MB each, 60s)
stress --vm 2 --vm-bytes 128M --timeout 60
EOF
bash stress_test.sh
This generates CPU, memory, and disk activity on the instance.
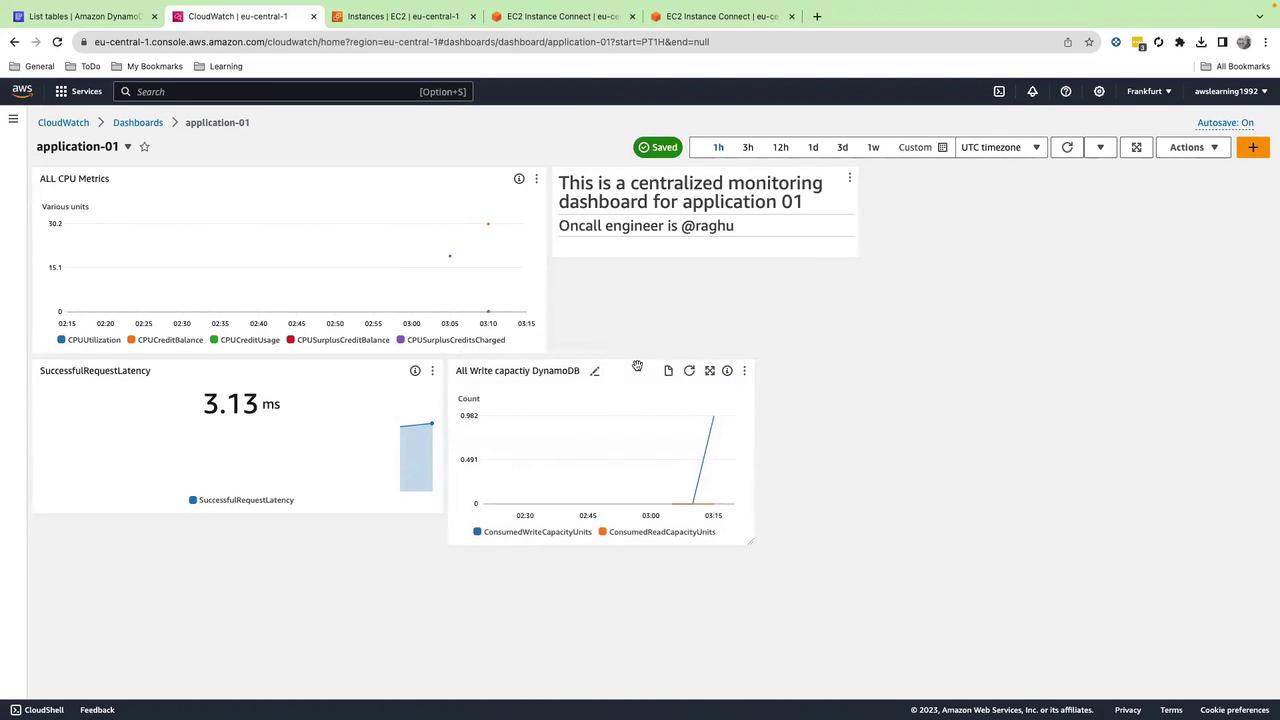
7. Build Your CloudWatch Dashboard
- Open CloudWatch → Dashboards → Create dashboard.
- Name it Application-01 and click Create dashboard.
- For each widget, choose Add widget and select the type.
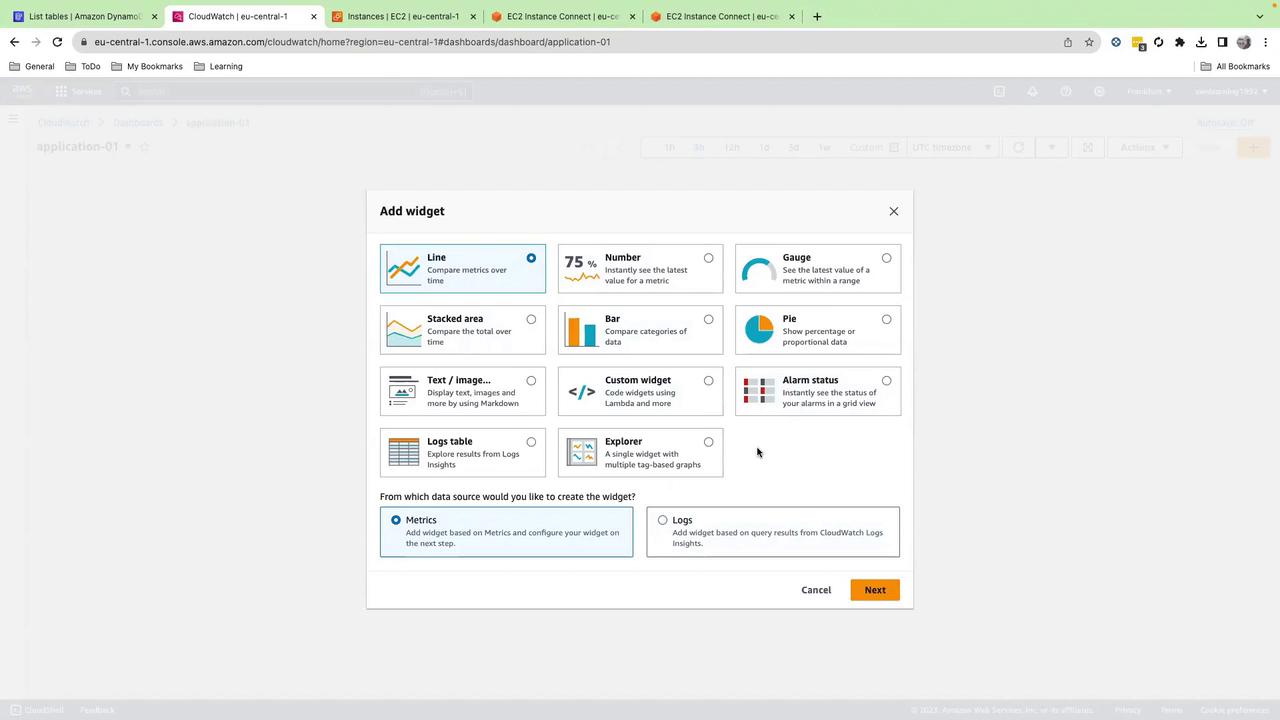
7.1 EC2 CPU Metrics (Line Chart)
- Browse Metrics → EC2 → Per-Instance Metrics.
- Select your instance, then check:
- CPUUtilization
- CPUCreditBalance
- CPUSurplusCreditBalance
- CPUSurplusCreditsCharged
- Set Time range to 1 hour, click Create widget.
- Enable Autosave and rename to EC2 CPU Metrics.
7.2 Dashboard Header (Text/Markdown)
- Add Text widget, choose Markdown, and enter:
# Application 01 Dashboard **On-Call:** [email protected]
- Click Create widget and drag it to the top.
7.3 DynamoDB Latency (Number Widget)
- Add Number widget.
- Browse DynamoDB → TableMetrics → ShoppingData → SuccessfulRequestLatency.
- Click Create widget.
7.4 DynamoDB Consumed Write Capacity (Line Chart)
- Add Line widget.
- Browse DynamoDB → TableMetrics → ShoppingData → ConsumedWriteCapacityUnits.
- Click Create widget.
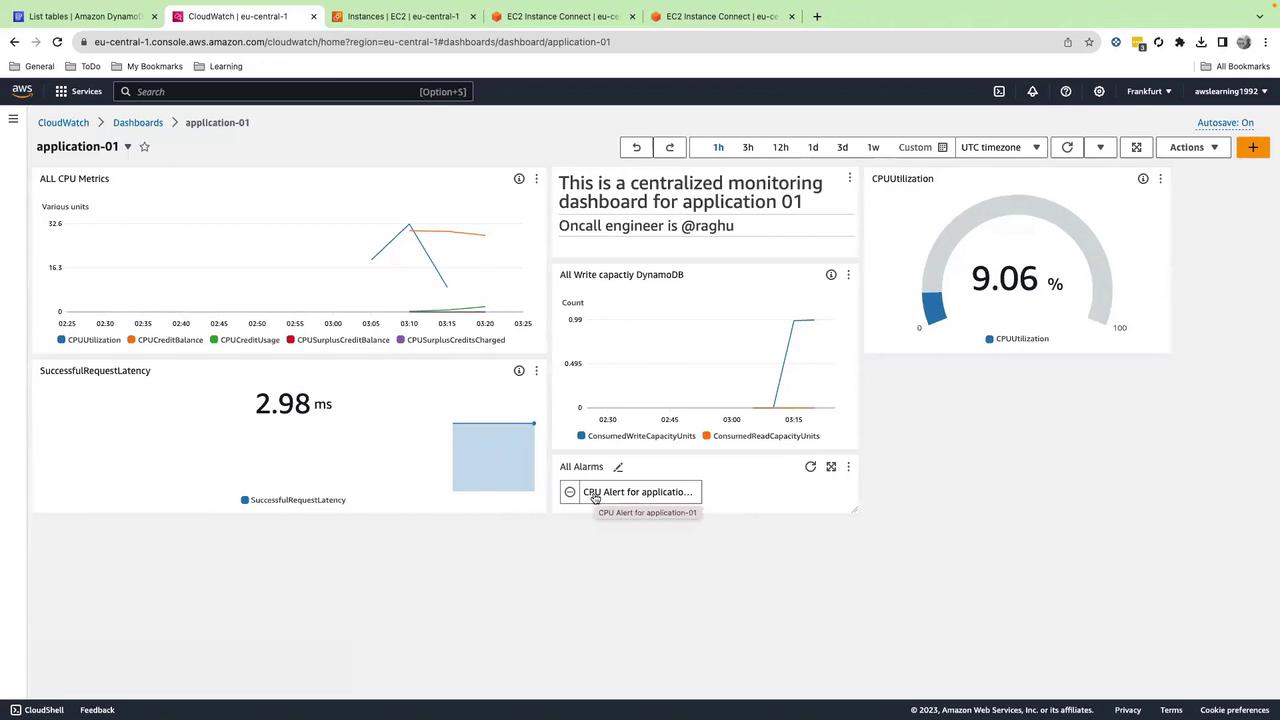
7.5 EC2 CPU Utilization Gauge
- Add Gauge widget.
- Browse EC2 → Per-Instance Metrics → your instance → CPUUtilization.
- Set Min=0, Max=100, click Create widget.
Your dashboard should now look like this:
7.6 Alarm Status (Alarm Status Widget)
- In CloudWatch → All alarms → Create alarm.
- Select EC2 → Per-Instance Metrics → CPUUtilization.
- Set threshold >= 90%, configure an SNS topic for notifications.
- Complete the wizard.
- Back in your dashboard, add an Alarm status widget, select your new alarm, and click Create widget.
Now you’ll see live alarm indicators:
8. Cleanup
To avoid ongoing charges, delete:
- The CloudFormation stack.
- The CloudWatch dashboard.
- Any SNS topics and alarms you created.
- The DynamoDB table if no longer needed.
References
Watch Video
Watch video content
Practice Lab
Practice lab