Combining different widget types on a single dashboard helps you correlate trends, anomalies, and operational events in one view.
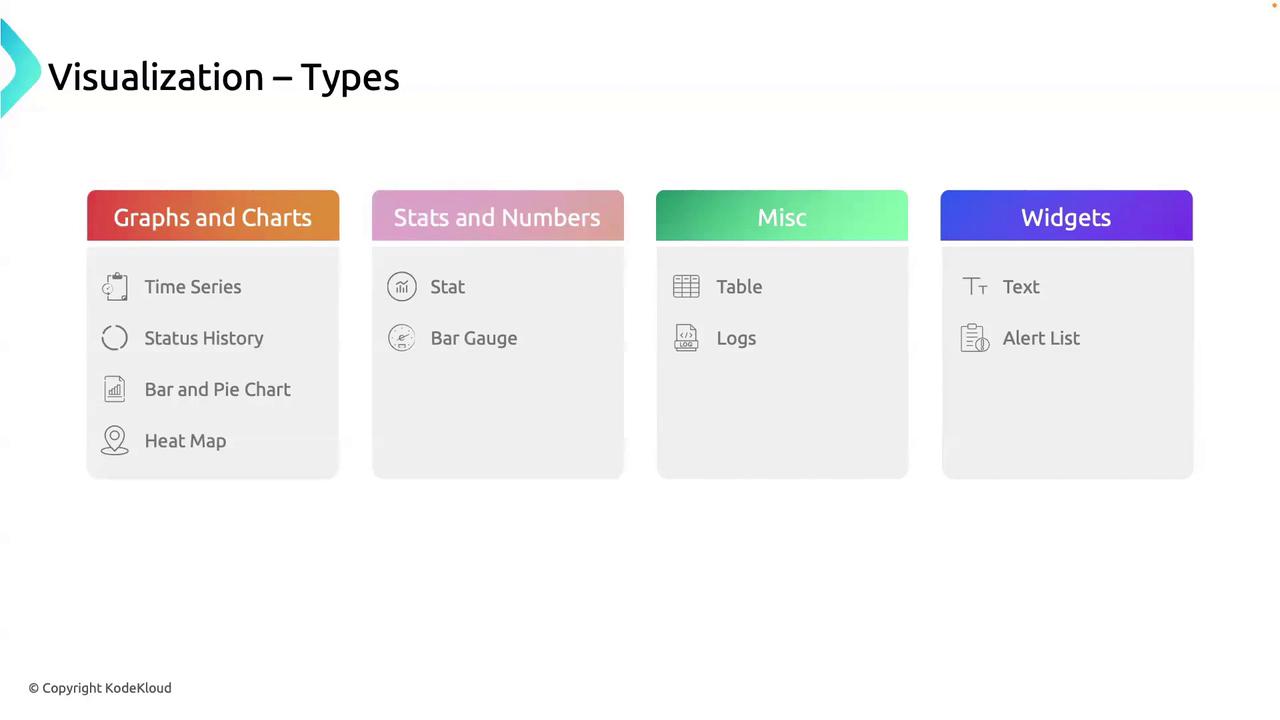
1. Graphs and Charts
Graphs and charts are essential when you need to track changes and compare metrics over time.-
Time Series Graph
Track metrics across a continuous time window.
Use case: Plot HTTP request counts over the last 24 hours to identify traffic spikes and troughs. -
Status History Graph
Visualize state transitions along a timeline.
Use case: Monitor CI/CD pipeline statuses—successes, failures, and in-progress builds. -
Bar Chart
Compare discrete categories side by side.
Use case: Contrast average response times for different microservices. -
Pie Chart
Show proportional distributions.
Use case: Display the percentage of GET vs. POST vs. PUT requests your API handles. -
Heat Map
Highlight intensity across two dimensions.
Use case: View CPU utilization across Auto Scaling group instances during peak load.
2. Stats and Numeric Widgets
For at-a-glance figures and threshold monitoring, consider these widgets:| Widget | Description | Example |
|---|---|---|
| Stat Widget | Single numeric value, perfect for key metrics | Current count of running EC2 instances |
| Gauge / Bar | Value against thresholds | Disk I/O utilization nearing a defined critical limit |
Avoid overcrowding your dashboard with too many stat widgets—focus on the metrics that drive your operations.
3. Miscellaneous Widgets
Use these to consolidate data in tables or stream log output:| Widget | Description | Example |
|---|---|---|
| Table | Tabular display of multiple metrics or query results | Recent deployment durations for each microservice |
| Log Query Widget | Real-time log entries from CloudWatch Logs Insights | Latest error messages filtered by application name and severity |
4. Text and Alert Widgets
Annotations and alert overviews keep your team informed:-
Text Widget
Add Markdown or plain text to document schedules, notes, or context for other elements. -
Alert List
Display active alarms for monitored resources.
Use case: Quickly see build failures or service outages in your CI/CD pipeline.
By selecting the right combination of these visualization types, you can tailor your CloudWatch Dashboard to meet your monitoring goals, accelerate troubleshooting, and maintain operational excellence.