

- Maintain application health
- Simplify troubleshooting
- Support security and compliance audits
Key Capabilities of CloudWatch Logs
Defining an indefinite retention policy can increase storage costs. Always monitor your log volume and set a realistic retention period.
Installing and Configuring the CloudWatch Agent
You install the CloudWatch Agent on EC2 instances or on-premises servers to collect metrics and logs:- Log files to monitor
- Metrics to collect
- Destination (CloudWatch Logs or CloudWatch Metrics)
You can also store your agent configuration in SSM Parameter Store and reference it in the
start command:sudo /opt/aws/amazon-cloudwatch-agent/bin/amazon-cloudwatch-agent-ctl -a fetch-config -m ec2 -c ssm:YourParameterName -sCore Concepts: Log Groups vs. Log Streams
CloudWatch Logs structures data using two primary concepts:- Log Group: Use to separate environments (dev, prod) or applications.
- Log Stream: Each instance or component can have its own stream.
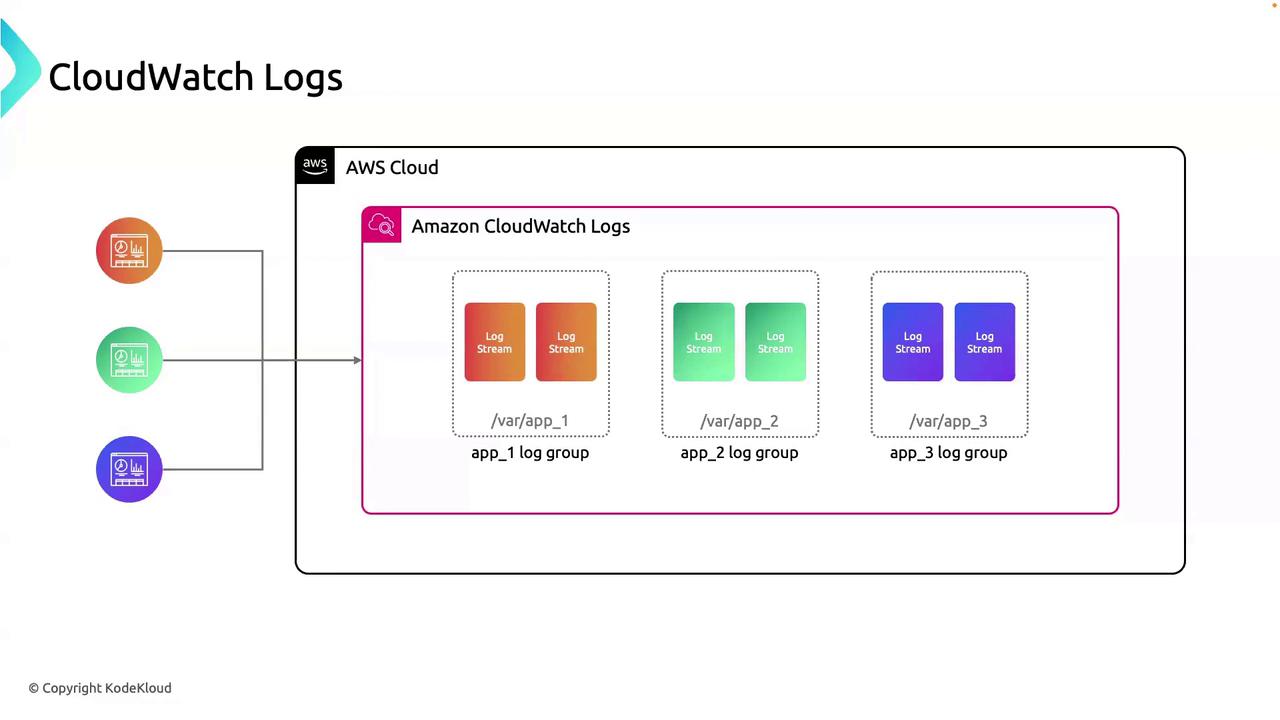
Use Case: Debugging with CloudWatch Logs
When troubleshootingapp_01:
- Go to the app_01 log group.
- Select the relevant log stream for your instance or task.
- Use real-time filtering (e.g.,
ERROR,WARN) to pinpoint exceptions. - If needed, create a metric filter to track error rates over time.