

Table of Contents
Metric Granularity
Metric granularity determines how often CloudWatch collects and stores data points—similar to adjusting a camera’s resolution. Fine-grained data offers deeper insights into system behavior.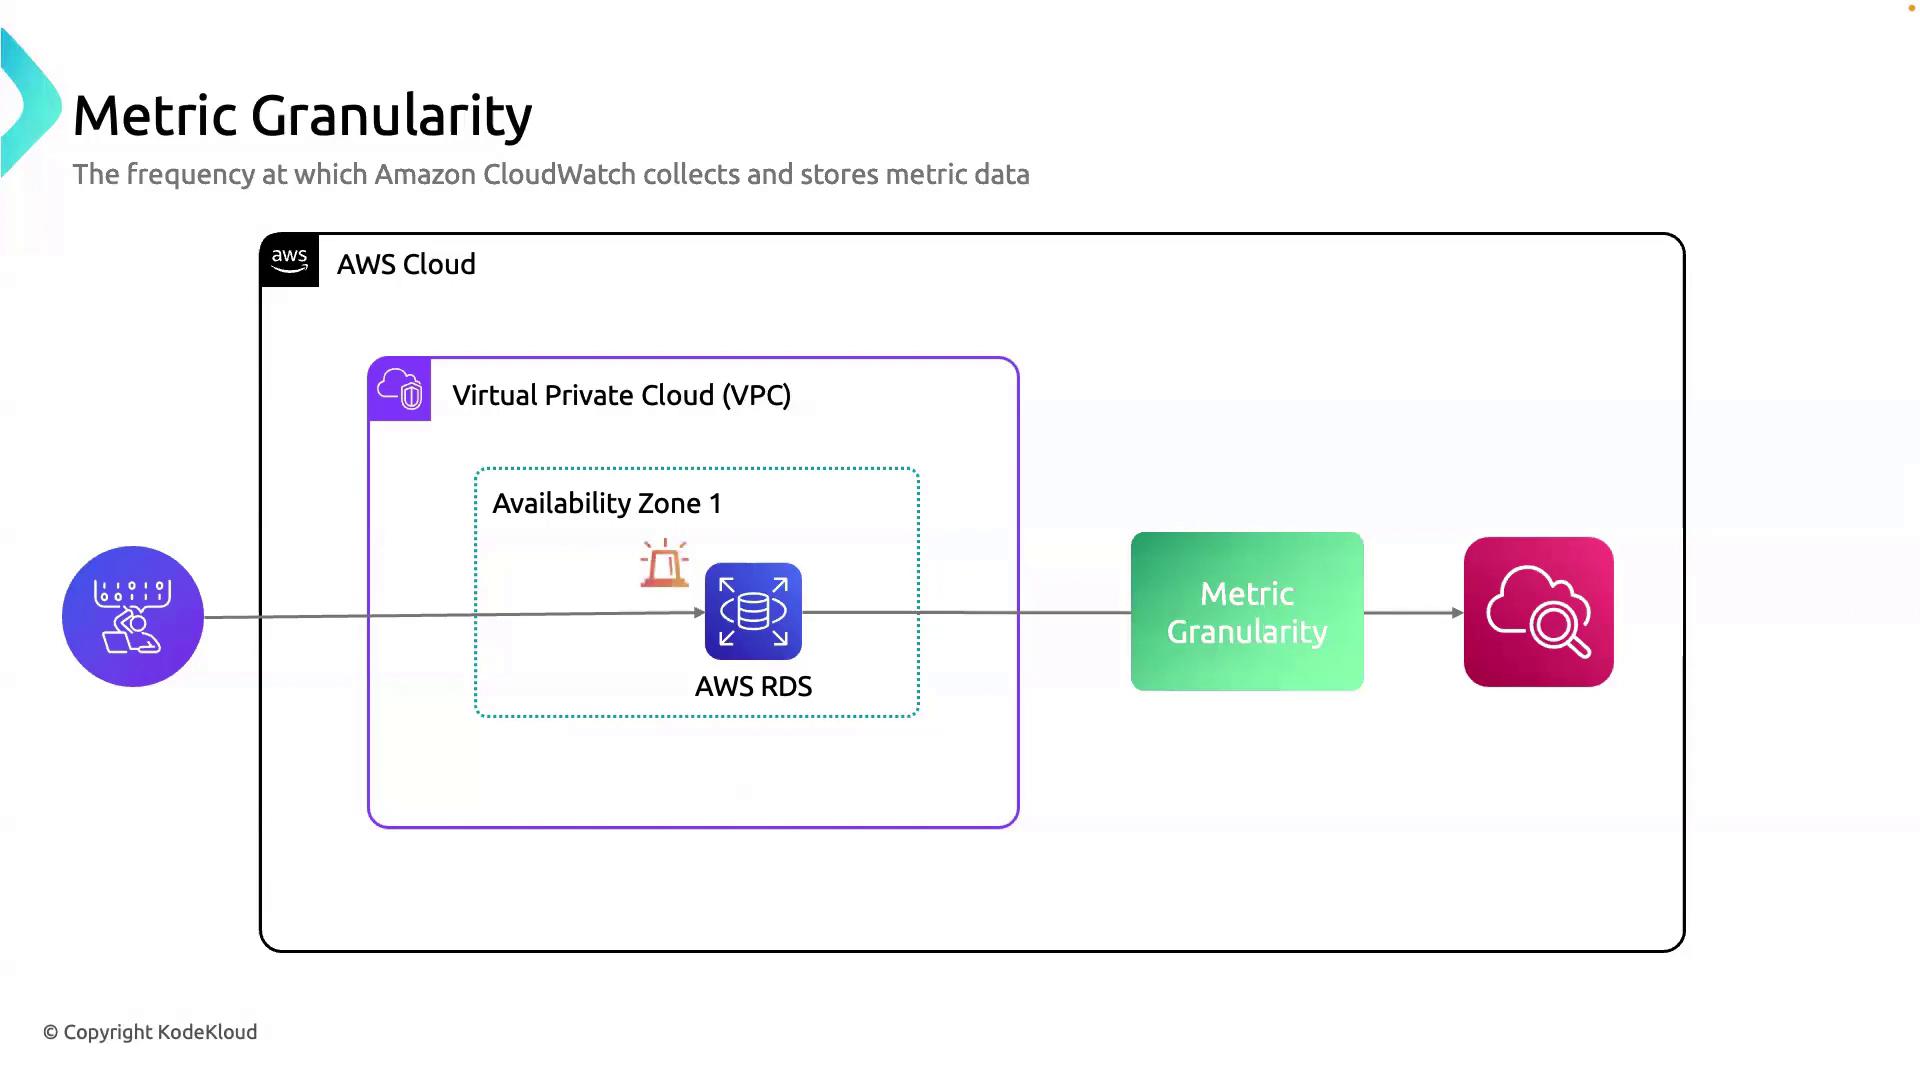
For mission-critical workloads, enabling detailed monitoring provides the visibility needed to detect spikes and performance bottlenecks.
Why Granularity Matters
- Responsive Alarms: Trigger alerts at precise thresholds.
- Detailed Dashboards: Visualize fine spikes in CPU, memory, or I/O.
- Performance Tuning: Correlate rapid metric changes with application events.
Metric Aggregation
Aggregation in CloudWatch summarizes multiple data points into a single metric value by applying statistical functions. This process helps identify trends and anomalies over time.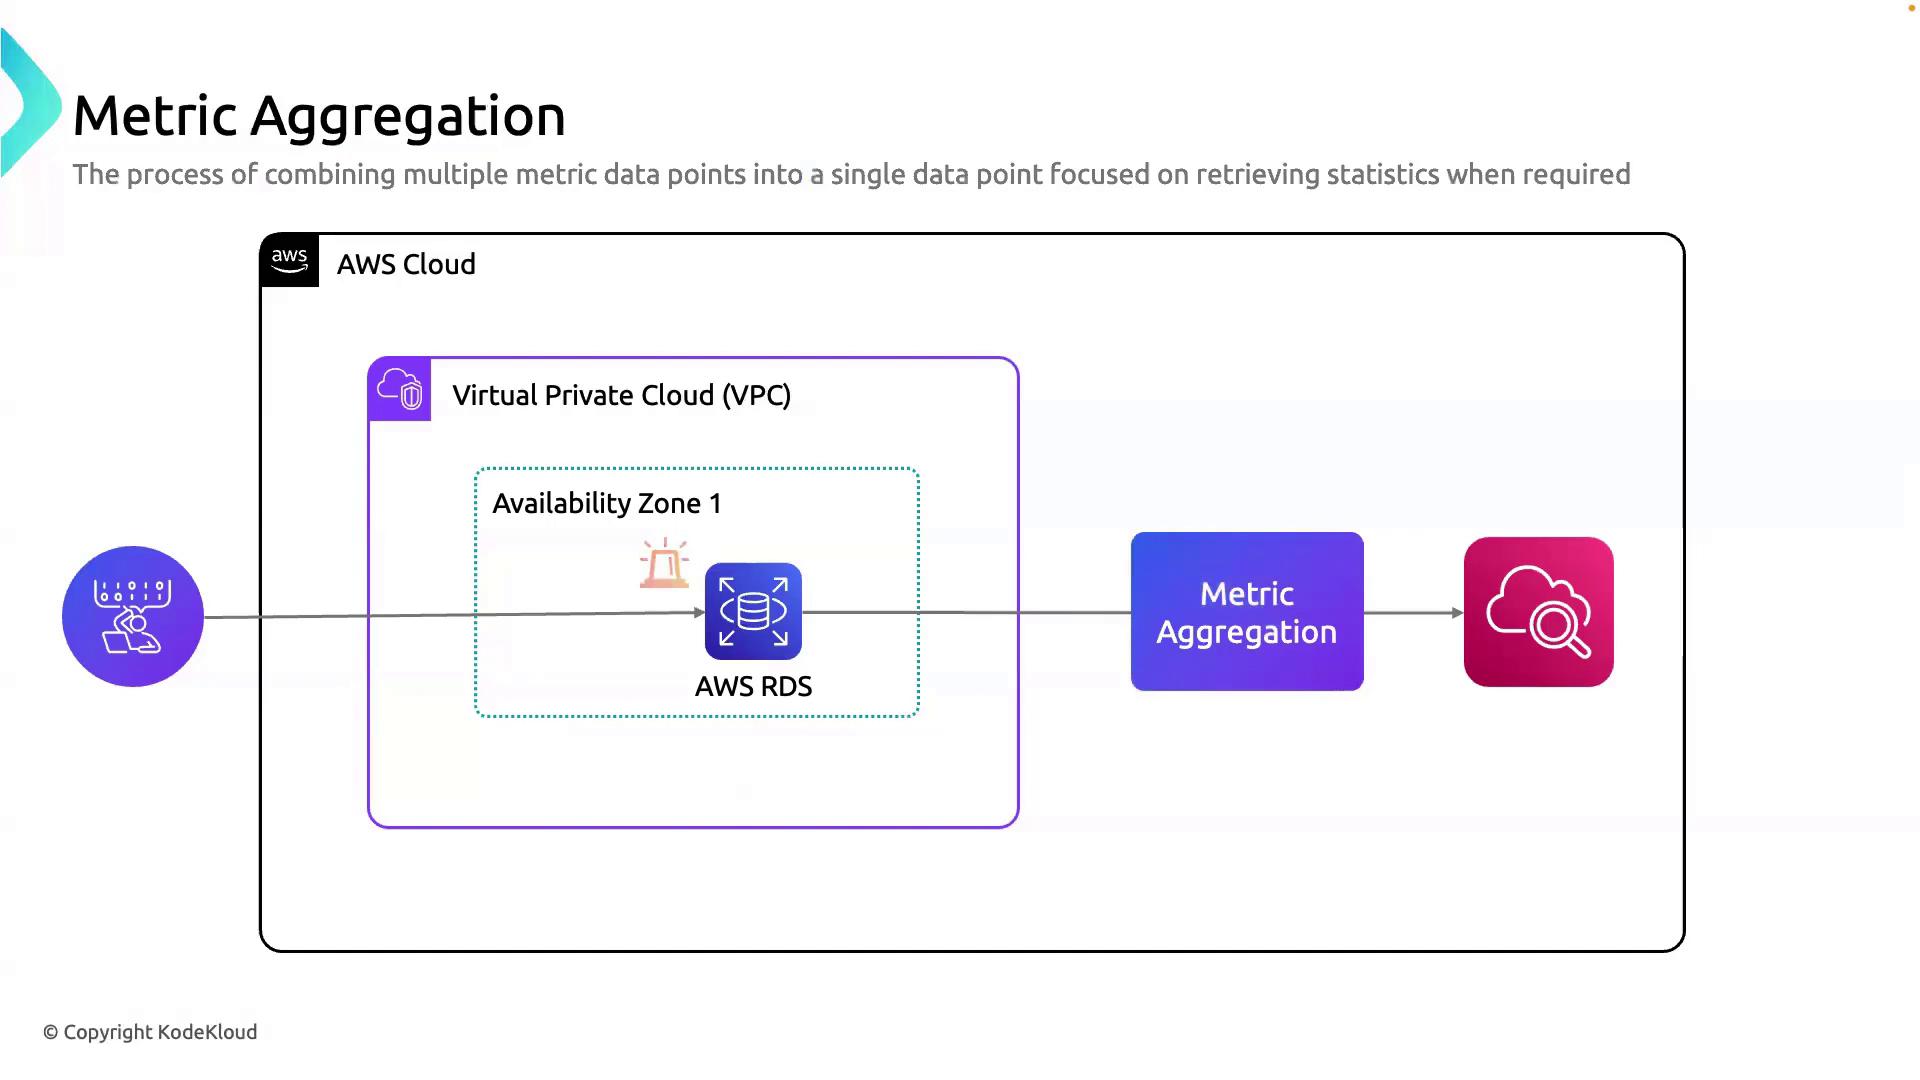
Use Cases for Aggregation
- Retrospective Analysis: Understand resource usage over days or weeks.
- Predictive Scaling: Forecast demand to automate scaling policies.
- Smart Alarms: Set thresholds on aggregated values (e.g., 5-minute average CPU).
Aggregation over coarse time intervals can mask short-lived spikes. Always align your aggregation period with your alerting requirements.
Best Practices
- Enable 1-minute granularity for critical services (RDS, EC2).
- Choose appropriate aggregation periods to balance data volume and insight.
- Leverage Composite Alarms to combine multiple aggregated metrics.
- Use Metric Math for custom calculations and anomaly detection.