Why Use Real-Time User Monitoring?
Modern applications must deliver fast, reliable experiences across a variety of devices and network conditions. With AWS CloudWatch RUM, you can:- Understand actual user experience in real time
- Detect performance regressions and errors immediately
- Correlate frontend telemetry with backend metrics and logs
Use Case Example
Imagine your customers browse your e-commerce site from desktops, tablets, and smartphones. A sudden spike in page load times on mobile may signal a CDN misconfiguration or a heavy third-party script. RUM lets you spot these anomalies in minutes and take corrective action.Getting Started with AWS CloudWatch RUM
- Create a RUM app monitor in the Amazon CloudWatch console
- Add the provided JavaScript snippet to your website or mobile SDK to begin collecting data
- View client-side metrics and user sessions in the CloudWatch RUM dashboard
Before deploying to production, verify user consent and compliance with data-privacy regulations when collecting client-side telemetry.
Key Features
| Feature | Description | Benefit |
|---|---|---|
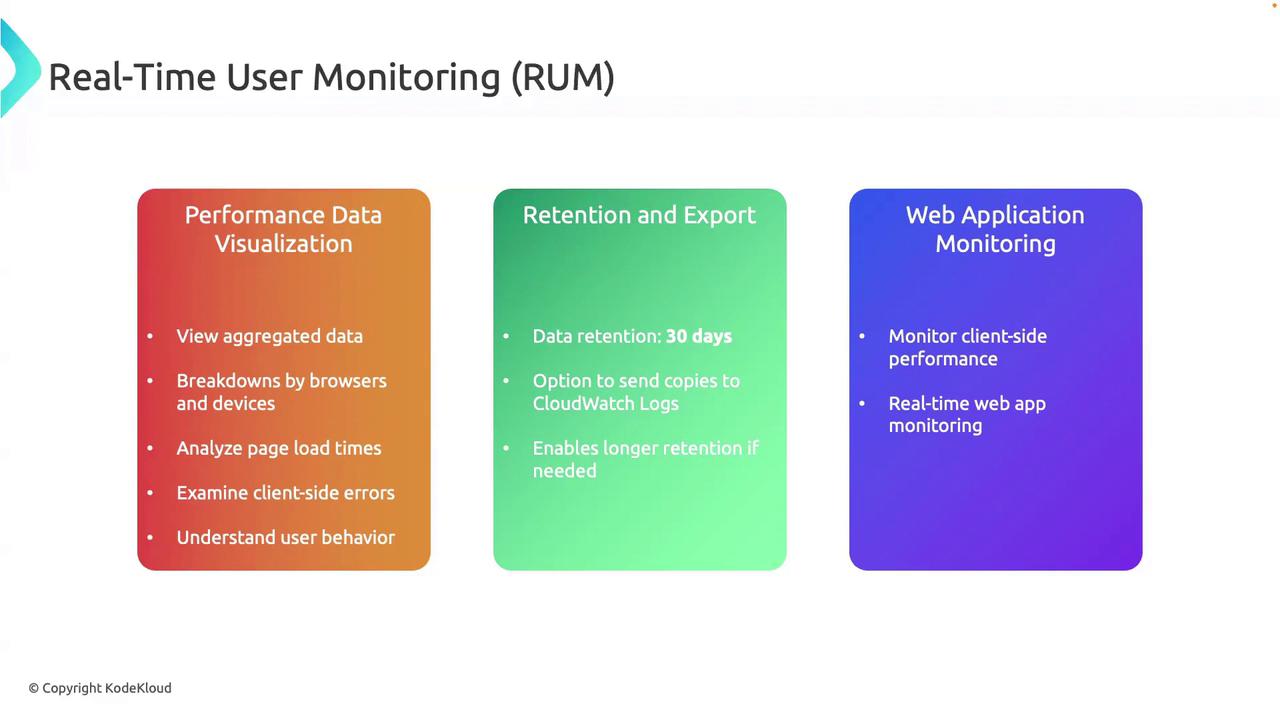
| Performance Data Visualization | Aggregated charts for page load times, user interactions, and resource timings. | Quickly identify slow pages and resource bottlenecks. |
| Breakdowns by Browser & Device | Slice and dice metrics by browser type, device model, or geography. | Understand performance discrepancies across user environments. |
| Client-side Error Tracking | Capture JavaScript errors and stack traces directly from the user’s session. | Speed up debugging by pinpointing error sources. |
| Data Retention & Export | Default 30-day retention in CloudWatch, with optional export to CloudWatch Logs or S3. | Maintain historical data for audits or deep analysis. |
| Real-Time Alerts & Notifications | Configure alerts for performance thresholds or error rates via Amazon SNS or AWS Chatbot. | Respond immediately to performance degradations. |
Retention and Long-Term Storage
- 30-Day Default: RUM data is stored in CloudWatch Metrics for 30 days.
- Export Options: Send RUM data to CloudWatch Logs or S3 for extended retention.
- Lifecycle Policies: Configure S3 lifecycle rules to archive or delete old data.
Exporting large volumes of RUM data to S3 can incur storage costs. Review your retention policies to control expenses.
Real-Time Monitoring & Analytics
- Instant Detection: Dashboards refresh in seconds, so you can spot issues as they emerge.
- User Session Replay: Inspect individual sessions to understand the exact user journey.
- Data-Driven Improvements: Use RUM insights to prioritize frontend optimizations and feature rollouts.