

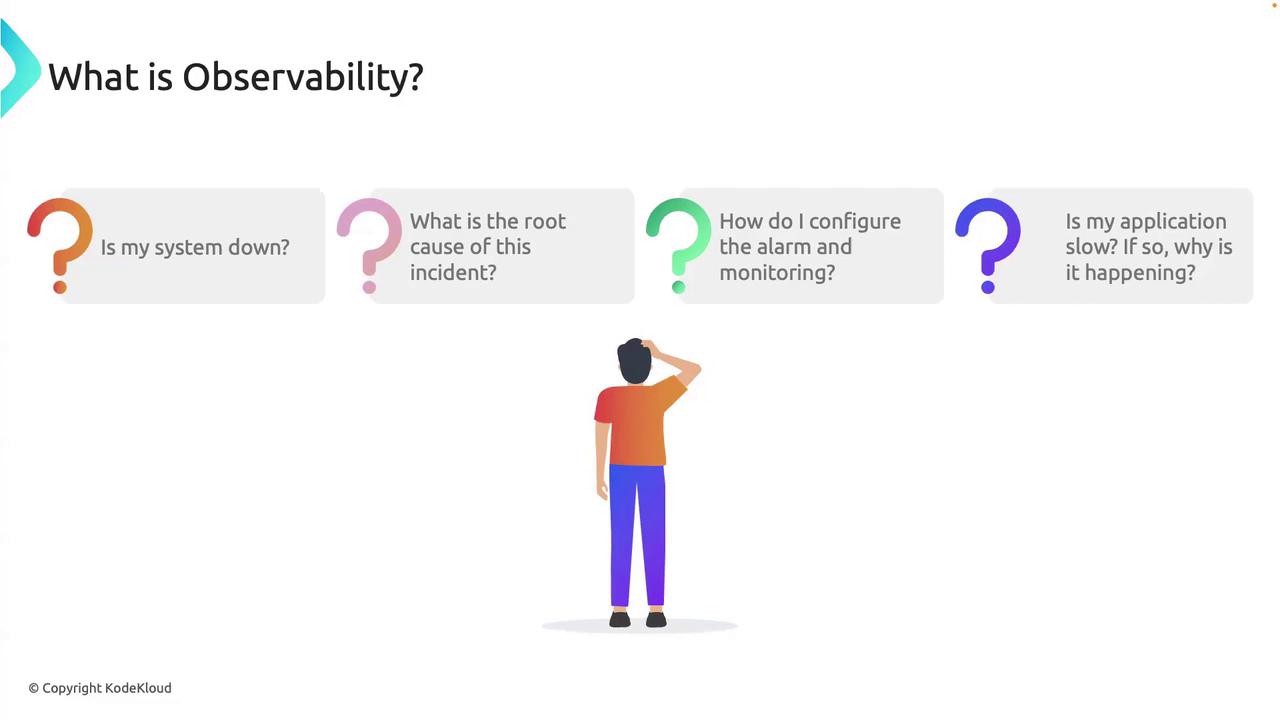
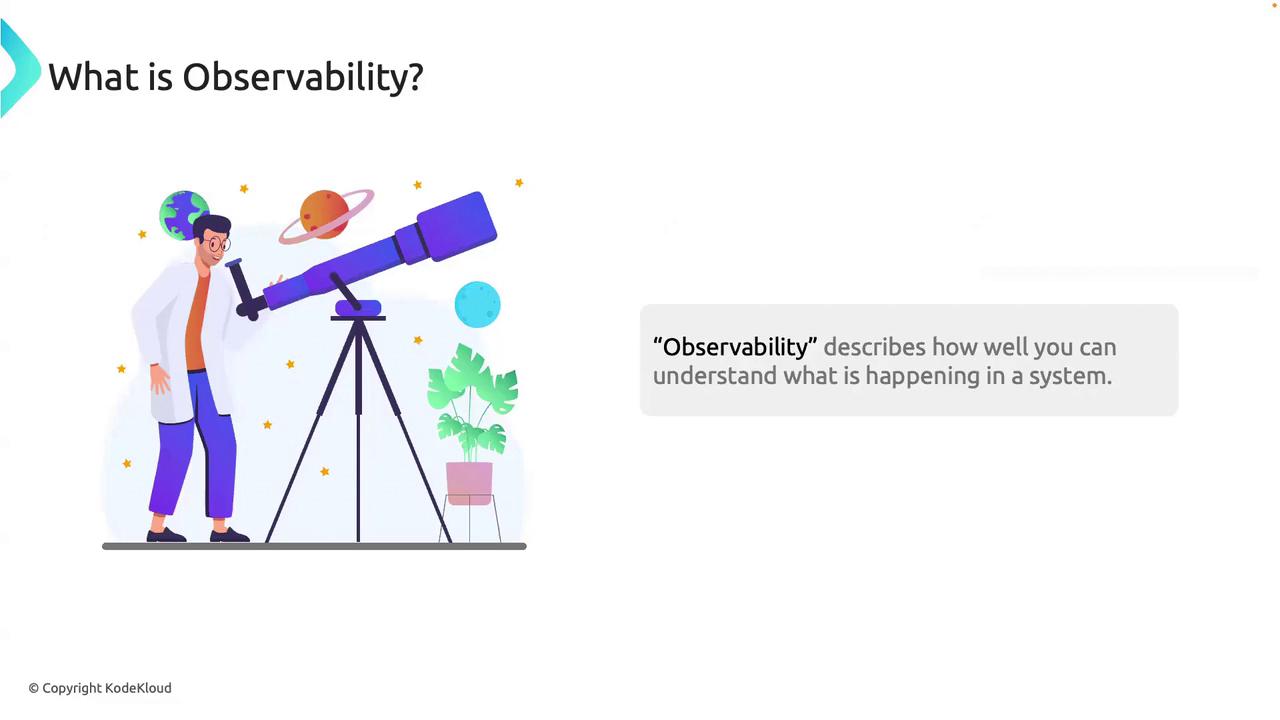
The Three Pillars of Observability
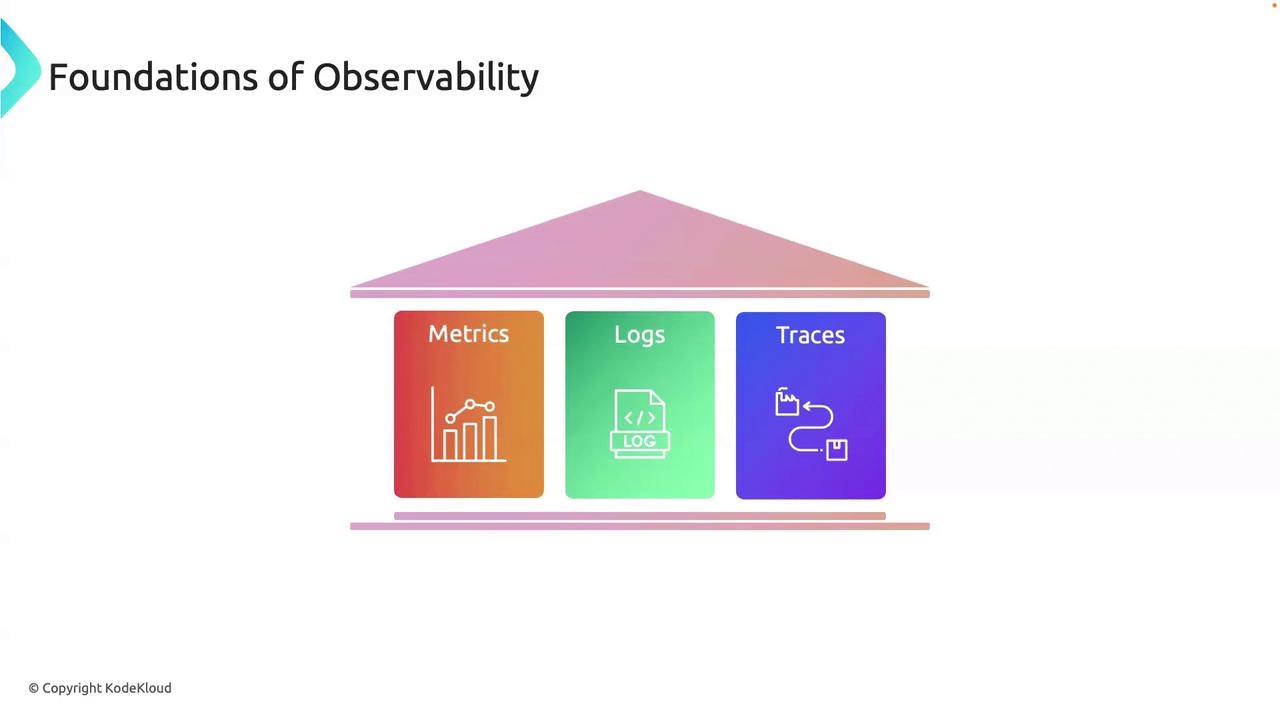
Observability stands on three foundational pillars. Together, they provide a comprehensive view of system behavior:
Metrics offer the “vital signs” of your infrastructure, logs provide the detailed event history, and traces map the journey of individual requests.
When ingesting high-cardinality logs, ensure you set appropriate log retention and indexing filters in CloudWatch Logs. This avoids unnecessary costs and search delays.
An Observability Action Plan
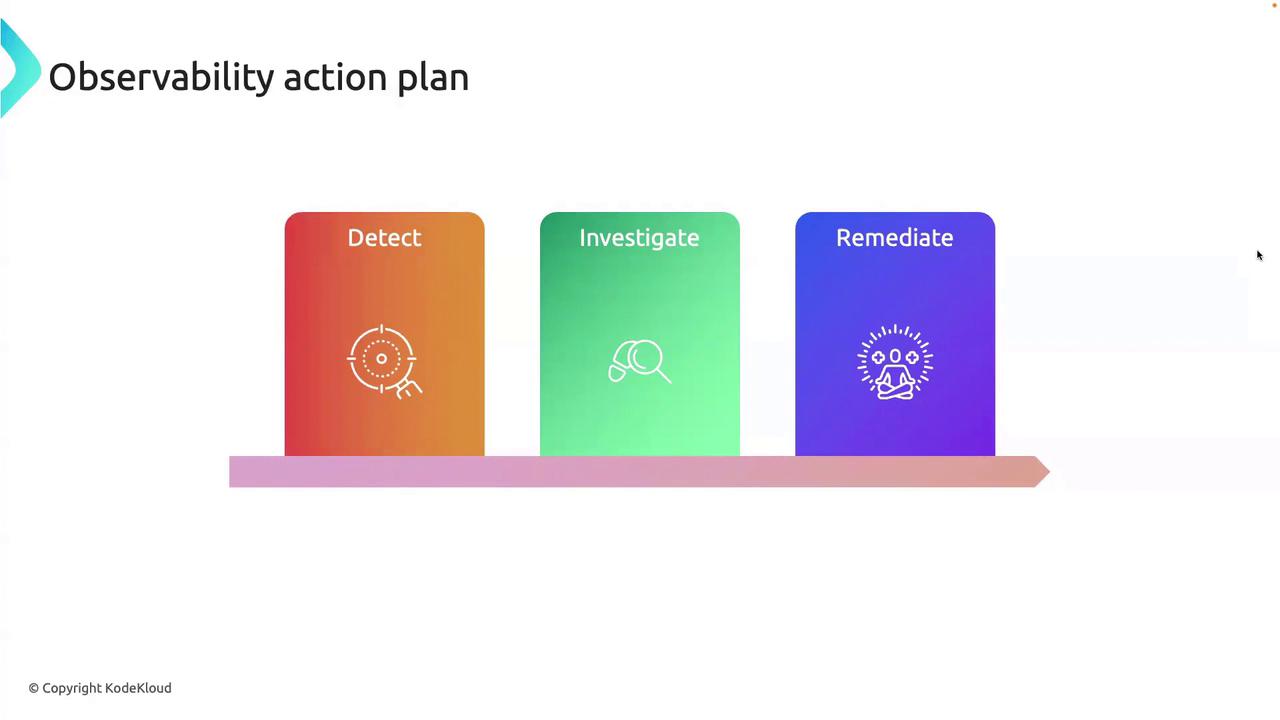
To operationalize observability, follow this three-stage cycle:-
Detect
Set up CloudWatch Alarms on metrics likeLatency,ErrorRate, or custom business KPIs. Enable Anomaly Detection to catch unexpected patterns. -
Investigate
Open CloudWatch Logs insights queries or AWS X-Ray service maps. Correlate timestamped logs with trace spans to uncover the root cause quickly. -
Remediate
Roll out hotfixes via AWS Systems Manager or CI/CD pipelines. Then refine your alerts, add dashboards, and update runbooks to prevent recurrence.
Over-alerting leads to alert fatigue. Review and tune thresholds regularly—only notify when action is truly required.
Conclusion
Observability is your competitive advantage in cloud-native environments. By harnessing metrics, logs, and traces—and rigorously following the detect → investigate → remediate cycle—you ensure resilient, high-performing systems. The more observable your stack, the more confidently you can deploy, scale, and innovate with AWS CloudWatch at your side.Links and References
- AWS CloudWatch Documentation
- AWS X-Ray Developer Guide
- Amazon CloudWatch Logs Insights
- Kubernetes Logging and Monitoring