In this lesson, you’ll learn how Amazon CloudWatch Insights and AWS X-Ray work together to deliver end-to-end monitoring and distributed tracing for modern applications. By combining detailed metrics, logs, and traces, you can detect issues faster, understand root causes, and automate responses.Documentation Index
Fetch the complete documentation index at: https://notes.kodekloud.com/llms.txt
Use this file to discover all available pages before exploring further.
1. CloudWatch Insights: Operational Visibility
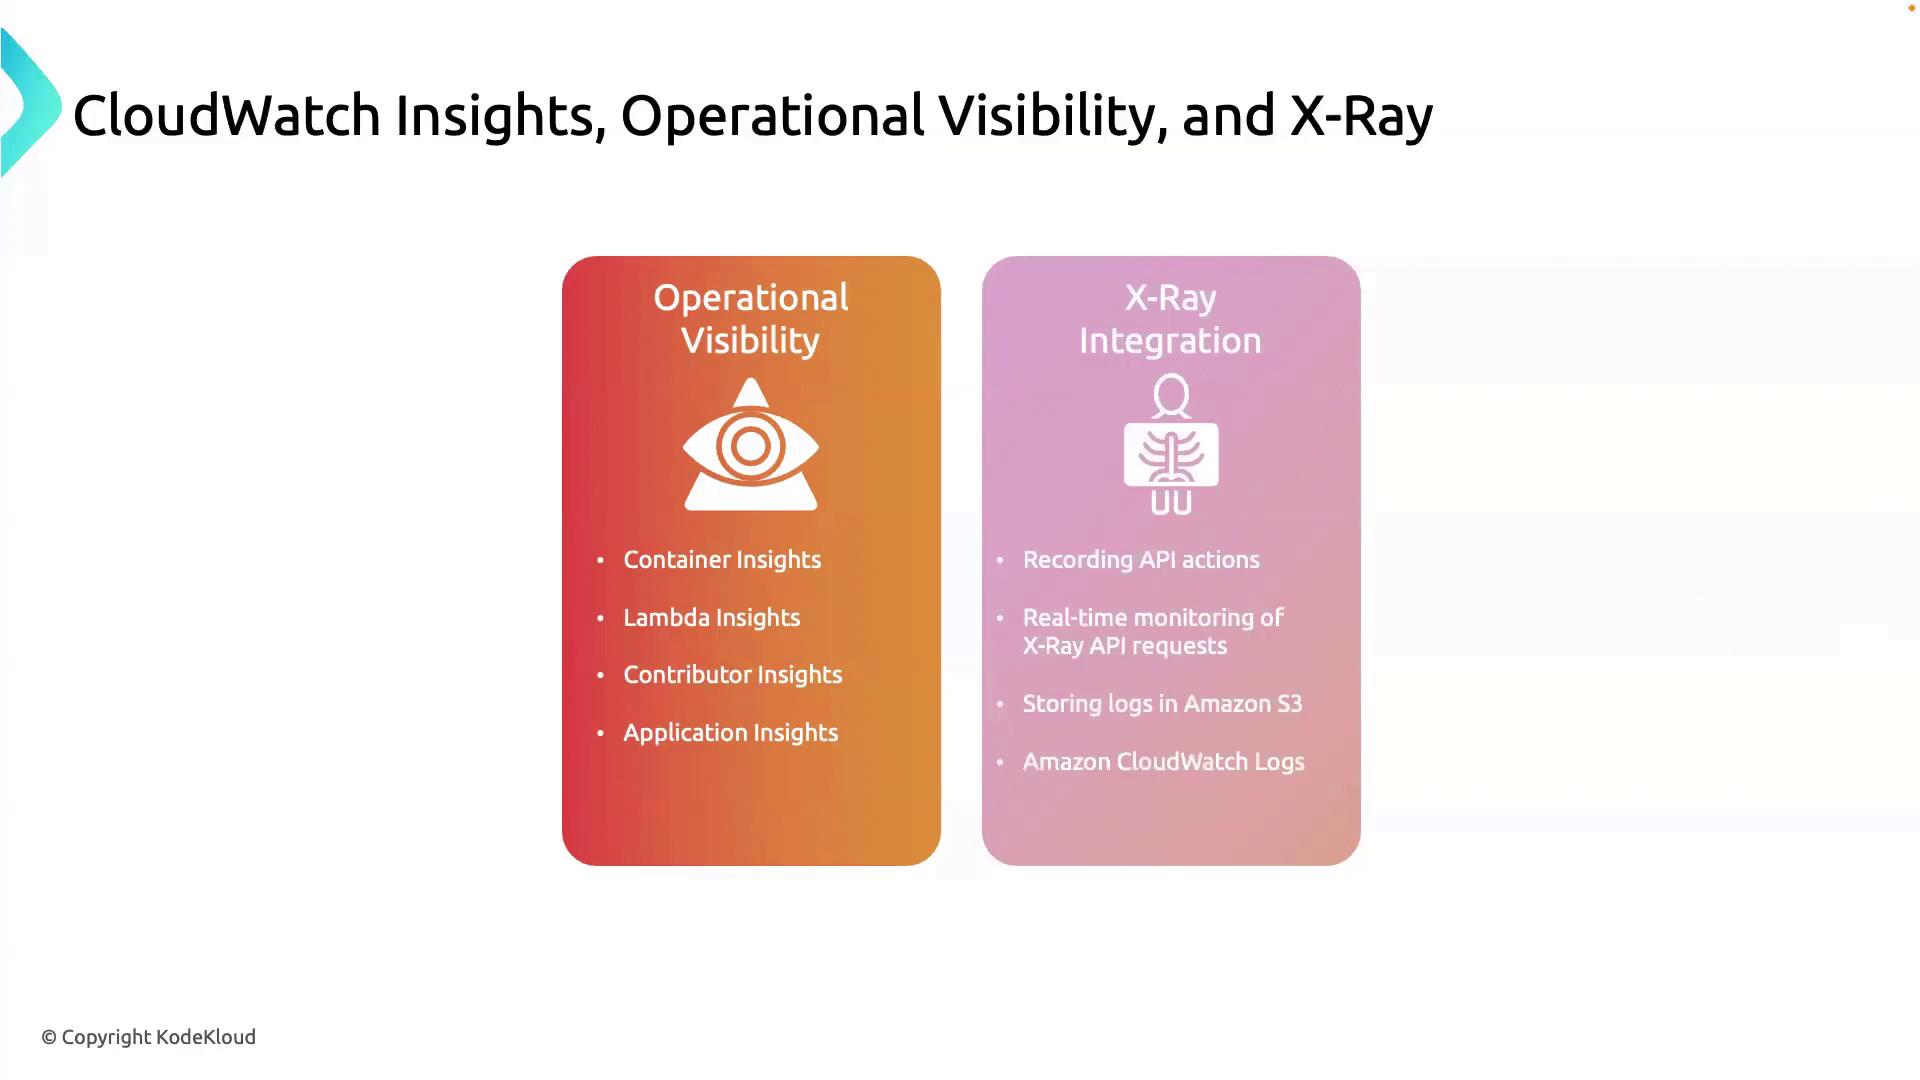
CloudWatch Insights provides granular visibility into your application stack. With built-in dashboards and customizable queries, you can quickly pinpoint performance bottlenecks.| Feature | Description | Example CLI Command |
|---|---|---|
| Container Insights | Monitor CPU, memory, and networking metrics for ECS, EKS, and Fargate workloads. | aws cloudwatch get-metric-data --metric-data-queries file://queries.json |
| Lambda Insights | Collect function-level metrics, logs, and duration histograms for AWS Lambda. | aws lambda list-functions |
| Contributor Insights | Identify top-N contributors to spikes in metrics like error rates or latency. | aws cloudwatch describe-contributor-insights |
| Application Insights | Automatically detect and visualize anomalies across metrics, logs, and events. | aws opsworks describe-applications |
Use CloudWatch Logs Insights queries to filter, aggregate, and visualize log data in seconds.
For more details, see CloudWatch Logs Insights.
For more details, see CloudWatch Logs Insights.
2. AWS X-Ray: Distributed Tracing
AWS X-Ray captures detailed trace data to help you understand service interactions and latency across distributed architectures:- End-to-End Traces: Follow a request as it travels through multiple services.
- Service Map Visualization: View a graph of service dependencies and latency.
- Request Sampling: Control the volume of traces collected to balance cost and visibility.
- Storage in S3: Archive and analyze trace data using tools like Athena or EMR.

Integrate X-Ray with CloudWatch Events to trigger automated alerts or Lambda functions when anomalies are detected.
Learn more at AWS X-Ray Developer Guide.
Learn more at AWS X-Ray Developer Guide.
3. Integrating Insights & Tracing
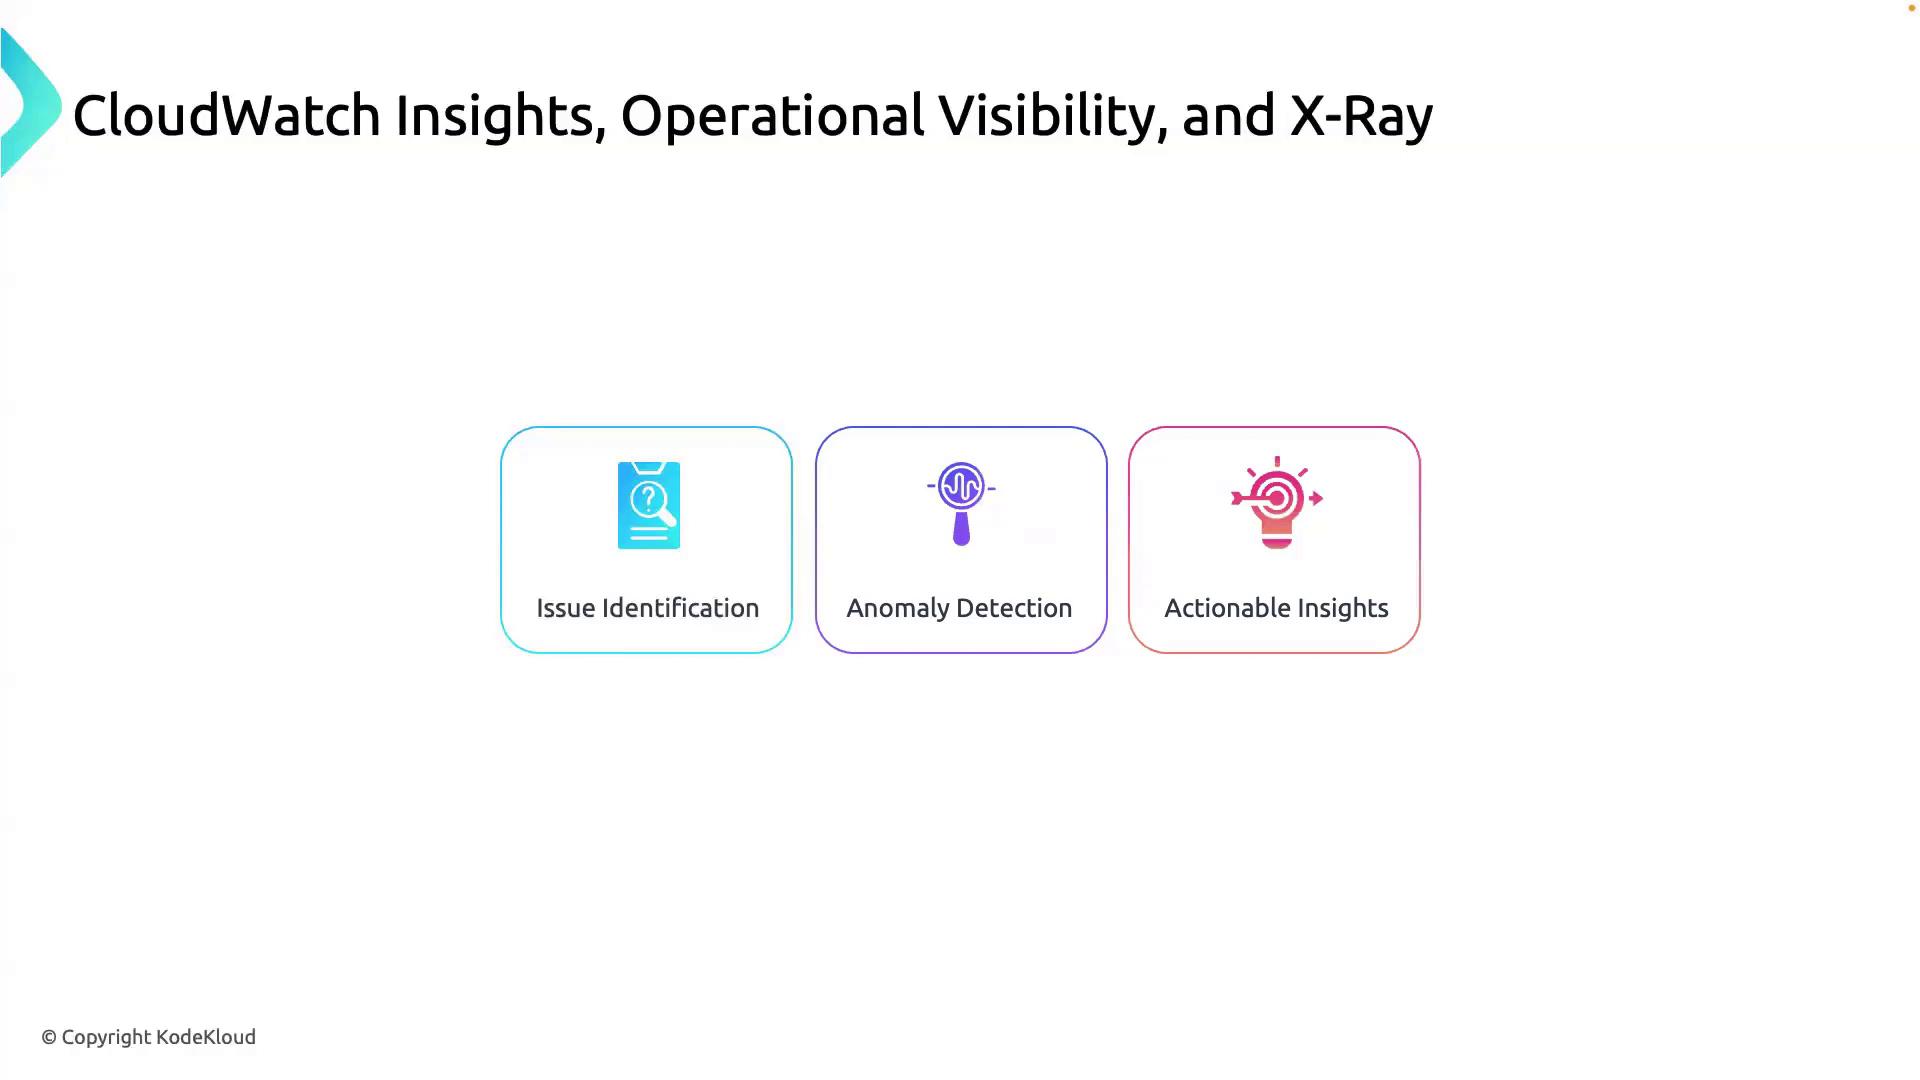
By correlating CloudWatch metrics and logs with X-Ray traces, you get a holistic observability solution:- Issue Identification
- Use CloudWatch Alarms to flag unusual metrics.
- Anomaly Detection
- Drill down with Logs Insights queries and trace segments.
- Actionable Insights
- Automate incident response with CloudWatch Events and Lambda.

Ensure that your services are instrumented correctly with the X-Ray SDK and that IAM roles grant permissions for both CloudWatch and X-Ray APIs. Failing to do so may result in incomplete trace data.
4. Proactive Issue Resolution
With combined observability:- Detect anomalies before they affect end-users.
- Trace requests to their origin for root-cause analysis.
- Respond automatically using EventBridge rules and Lambda.