In this tutorial, you’ll learn how to provision infrastructure with CloudFormation, deploy a Python application on EC2 that writes to DynamoDB, generate load, and build a centralized AWS CloudWatch dashboard with various widget types.Documentation Index
Fetch the complete documentation index at: https://notes.kodekloud.com/llms.txt
Use this file to discover all available pages before exploring further.
1. Provision Base Infrastructure with CloudFormation
First, use a CloudFormation template to create the EC2 instance, IAM role, and instance profile.1.1 CloudFormation Template Overview
This template (cloudwatch_dashboard_cloudformation.yaml) provisions:
- A t2.micro EC2 instance (Amazon Linux 2).
- An IAM role with full EC2, DynamoDB, and SSM permissions.
- An instance profile to attach the role to the instance.
| Resource | Type | Details |
|---|---|---|
| EC2 Instance | AWS::EC2::Instance | t2.micro, Amazon Linux 2, uses SSM Session Manager |
| IAM Role | AWS::IAM::Role | Full access to EC2, DynamoDB, and SSM |
| IAM Instance Profile | AWS::IAM::InstanceProfile | Binds the IAM role to the EC2 instance |
- Open the AWS CloudFormation console.
- Click Create stack → With new resources (standard).
- Under Template source, select Upload a template file, choose the YAML above, then Next.
- Enter CloudWatch-Dashboard-App01 as the stack name, accept defaults, acknowledge IAM changes, and click Create stack.
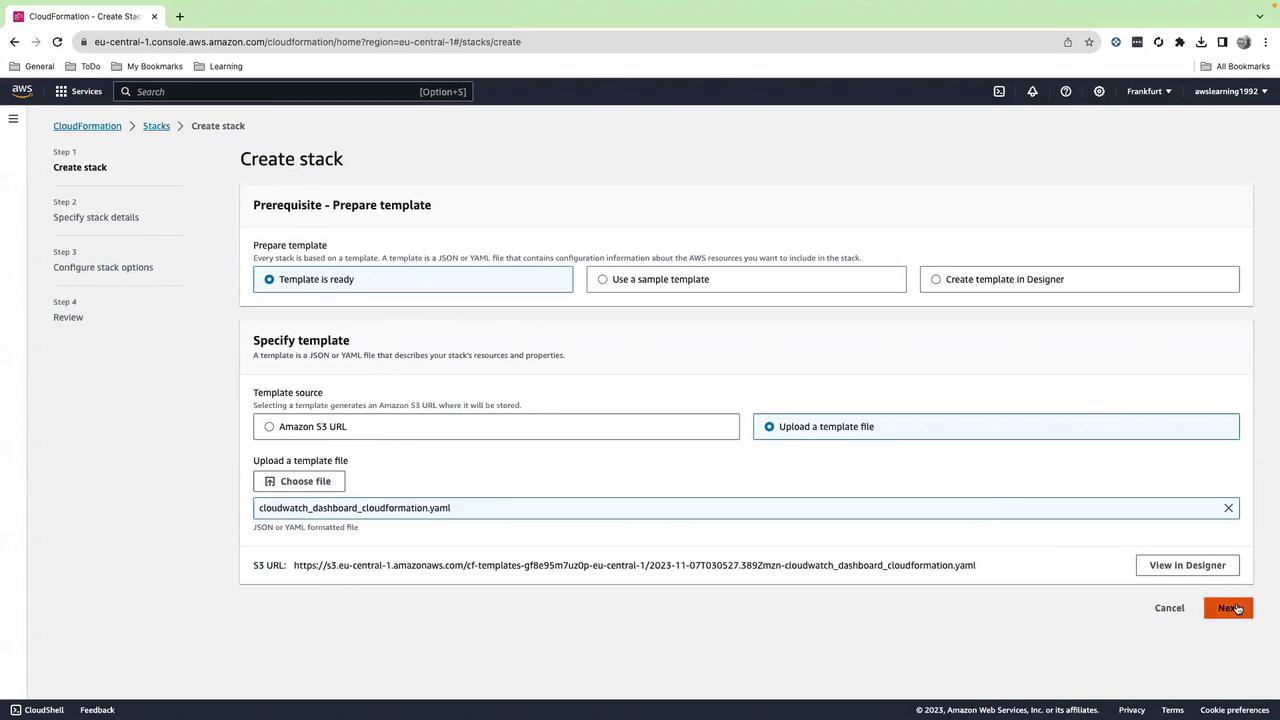
Make sure you deploy in the same AWS Region where you intend to run your workloads.
2. Verify EC2 Instance and IAM Role
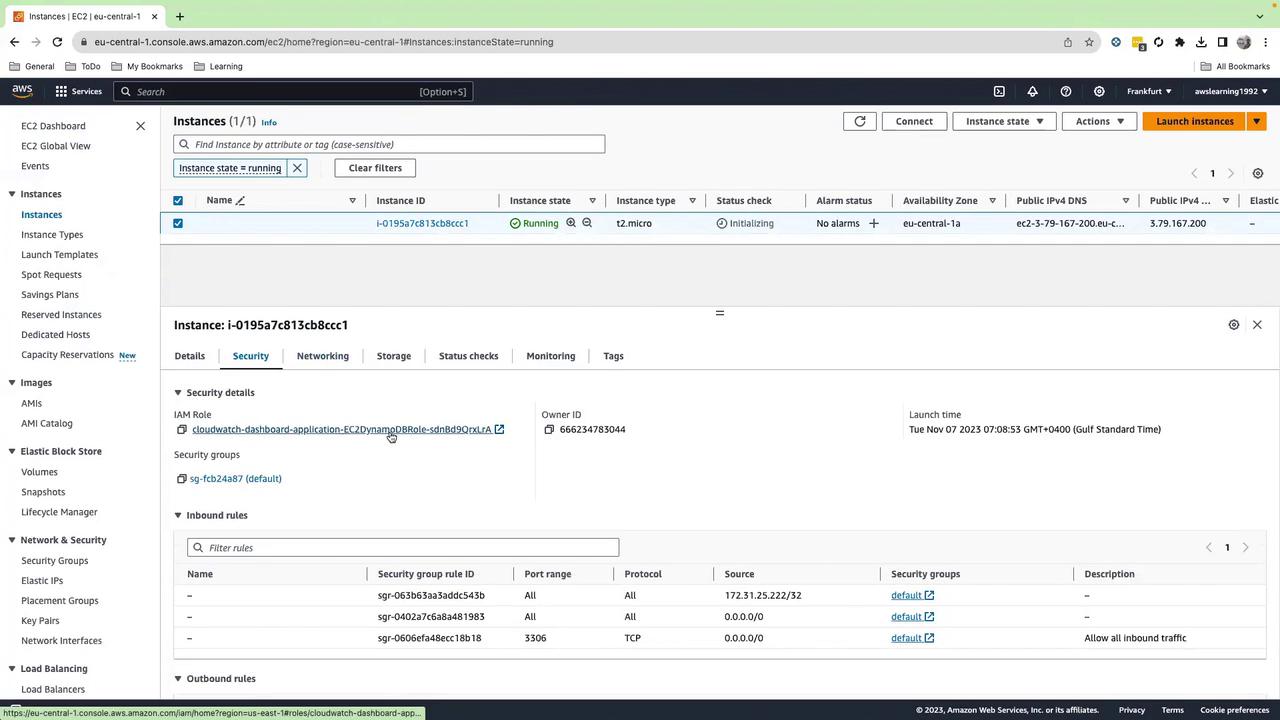
- Open the EC2 console.
- Confirm your t2.micro instance is running.
- Under Security → IAM role, ensure
EC2DynamoDBRoleis attached.
3. Connect via Session Manager
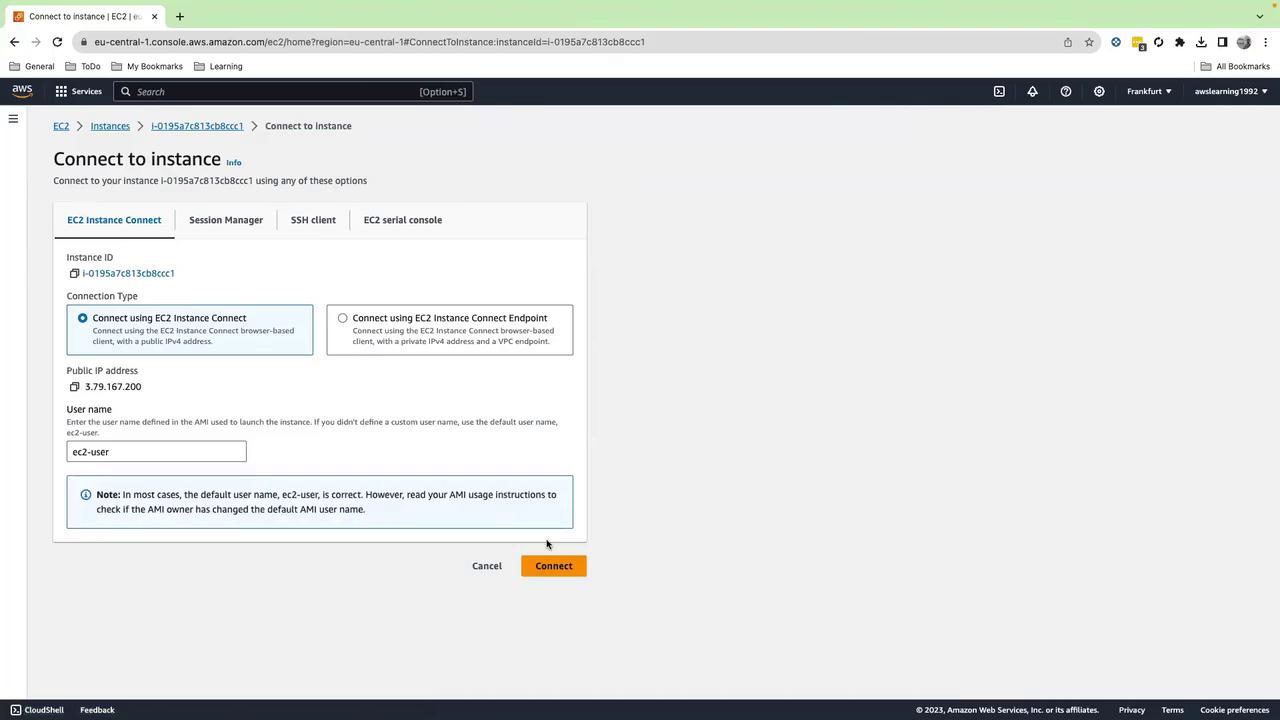
Use AWS Systems Manager Session Manager to get a shell without SSH keys:- In the EC2 console, select the instance.
- Click Connect → Session Manager → Connect.
4. Install Dependencies and Deploy Sample Application
4.1 Install pip
4.2 Install stress
4.3 Prepare the Application Directory
4.4 Create the Python Application
Inapplication_01/app.py:
This script runs indefinitely until you stop it (Ctrl+C).
5. Verify DynamoDB Table
In the DynamoDB console, under Tables, confirm ShoppingData is active: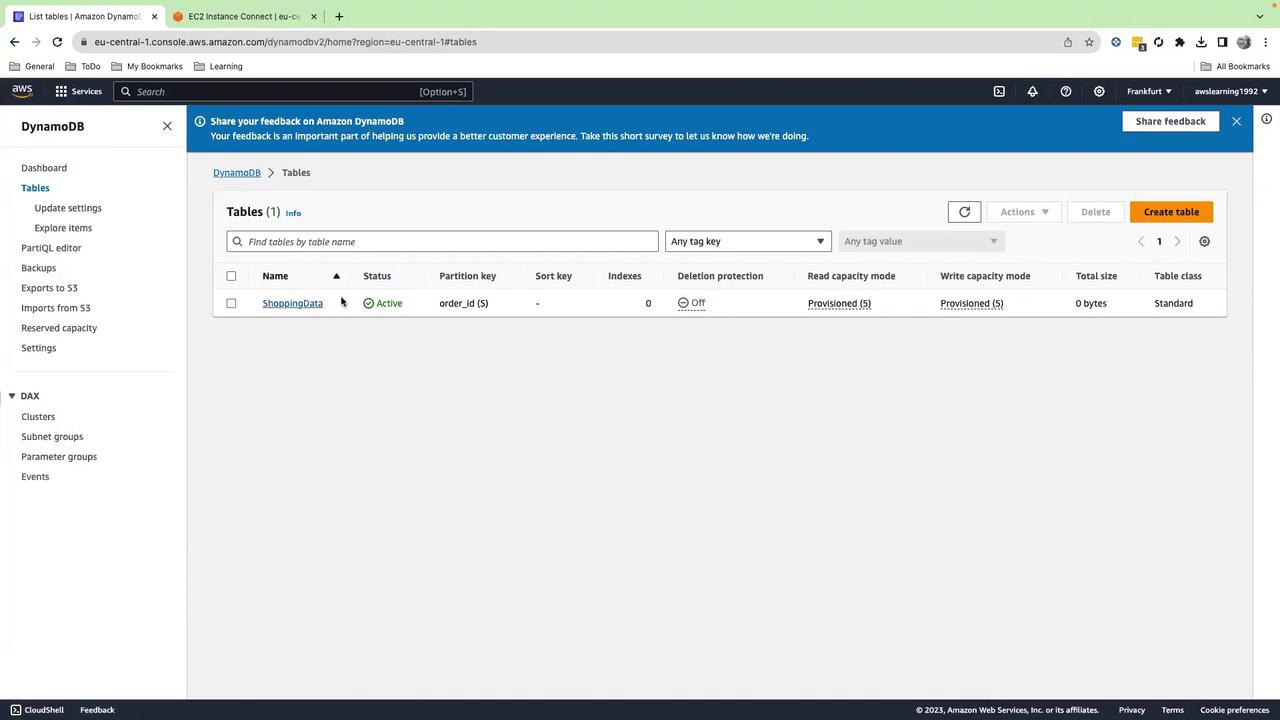
6. Apply Load with a Stress Script
Open a new Session Manager tab to keepapp.py running, then:
7. Build Your CloudWatch Dashboard
- Open CloudWatch → Dashboards → Create dashboard.
- Name it Application-01 and click Create dashboard.
- For each widget, choose Add widget and select the type.
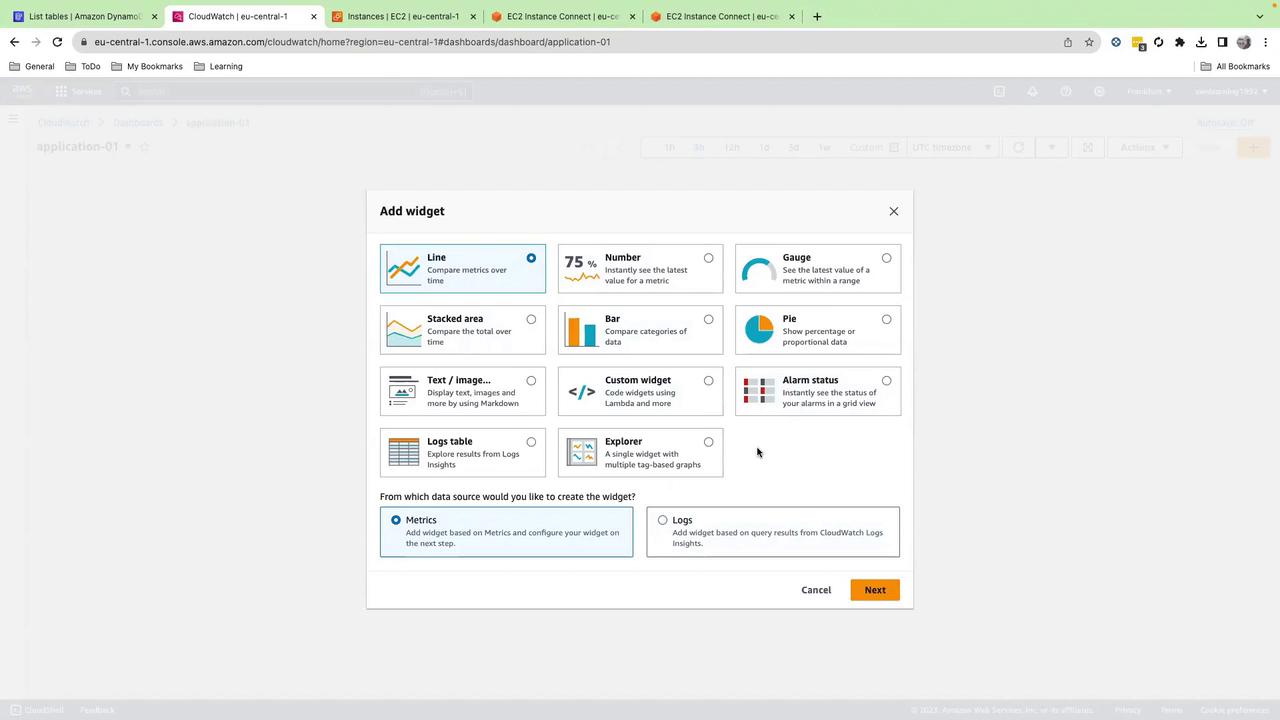
7.1 EC2 CPU Metrics (Line Chart)
- Browse Metrics → EC2 → Per-Instance Metrics.
- Select your instance, then check:
- CPUUtilization
- CPUCreditBalance
- CPUSurplusCreditBalance
- CPUSurplusCreditsCharged
- Set Time range to 1 hour, click Create widget.
- Enable Autosave and rename to EC2 CPU Metrics.
7.2 Dashboard Header (Text/Markdown)
- Add Text widget, choose Markdown, and enter:
- Click Create widget and drag it to the top.
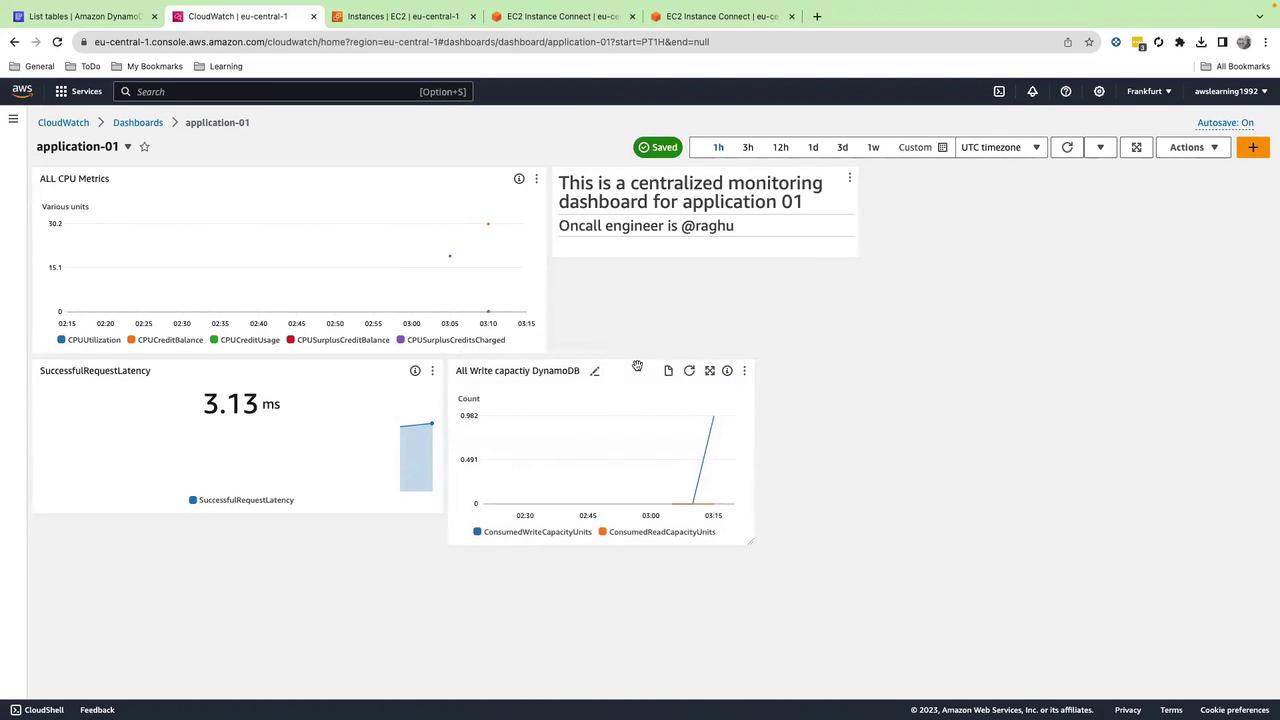
7.3 DynamoDB Latency (Number Widget)
- Add Number widget.
- Browse DynamoDB → TableMetrics → ShoppingData → SuccessfulRequestLatency.
- Click Create widget.
7.4 DynamoDB Consumed Write Capacity (Line Chart)
- Add Line widget.
- Browse DynamoDB → TableMetrics → ShoppingData → ConsumedWriteCapacityUnits.
- Click Create widget.
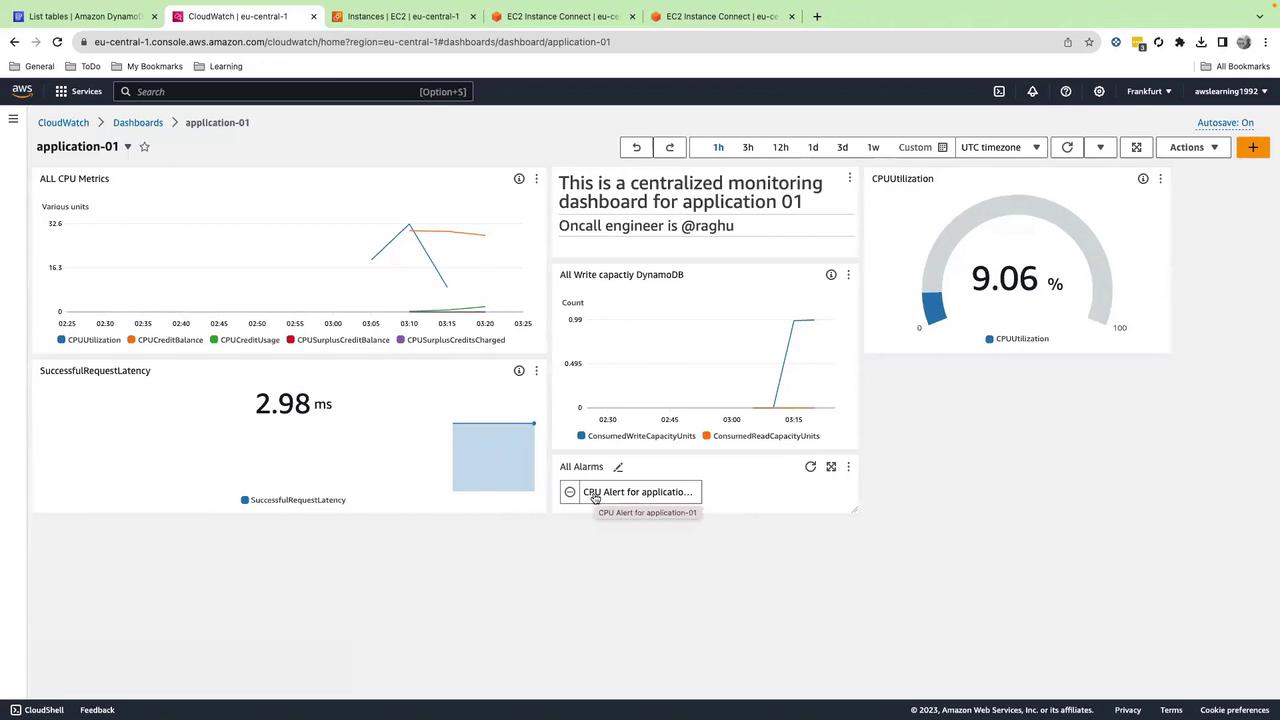
7.5 EC2 CPU Utilization Gauge
- Add Gauge widget.
- Browse EC2 → Per-Instance Metrics → your instance → CPUUtilization.
- Set Min=0, Max=100, click Create widget.
7.6 Alarm Status (Alarm Status Widget)
- In CloudWatch → All alarms → Create alarm.
- Select EC2 → Per-Instance Metrics → CPUUtilization.
- Set threshold >= 90%, configure an SNS topic for notifications.
- Complete the wizard.
- Back in your dashboard, add an Alarm status widget, select your new alarm, and click Create widget.
8. Cleanup
To avoid ongoing charges, delete:- The CloudFormation stack.
- The CloudWatch dashboard.
- Any SNS topics and alarms you created.
- The DynamoDB table if no longer needed.