In this lesson, we’ll dissect the components of a CloudWatch alarm, explore best practices for setting thresholds, and walk through an example of monitoring an RDS instance.

Core Components of a CloudWatch Alarm
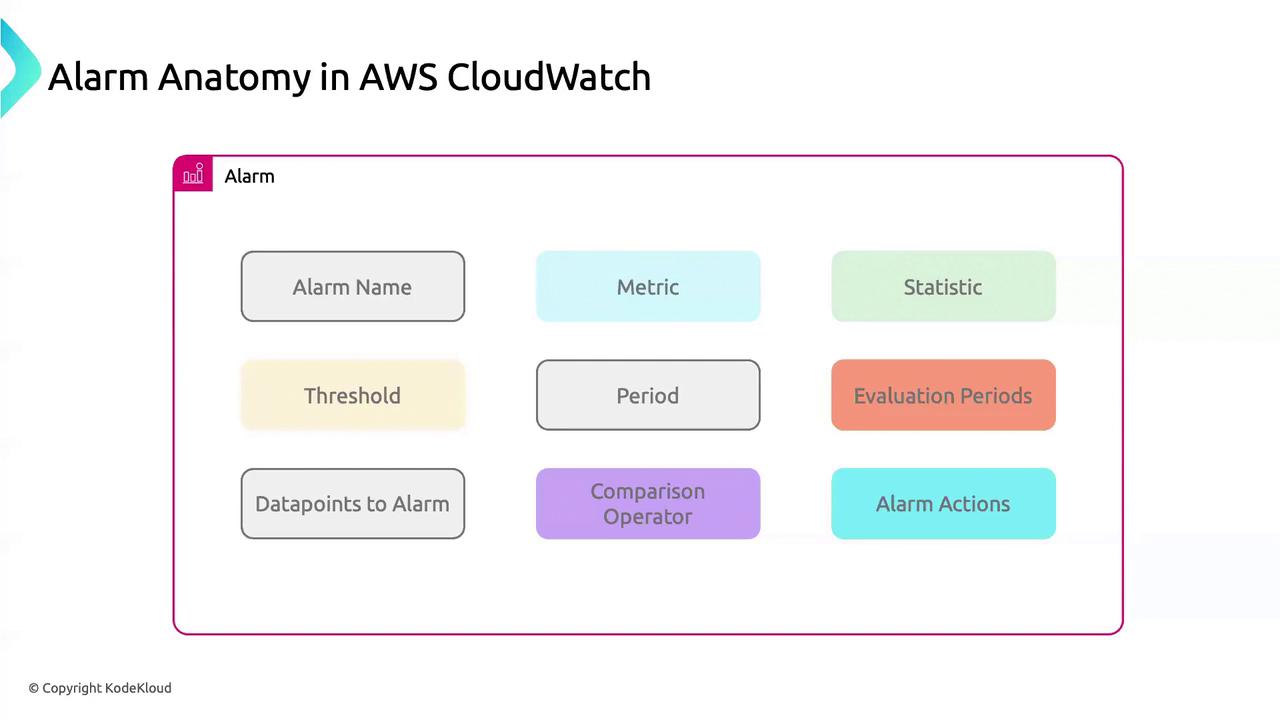
The image is a diagram titled "Alarm Anatomy in AWS CloudWatch," showing components like Alarm Name, Metric, Statistic, Threshold, Period, Evaluation Periods, Datapoints to Alarm, Comparison Operator, and Alarm Actions.

Example: Creating an Alarm for RDS CPU Utilization

Apply these settings to keep tabs on an Amazon RDS instance’s CPU usage:
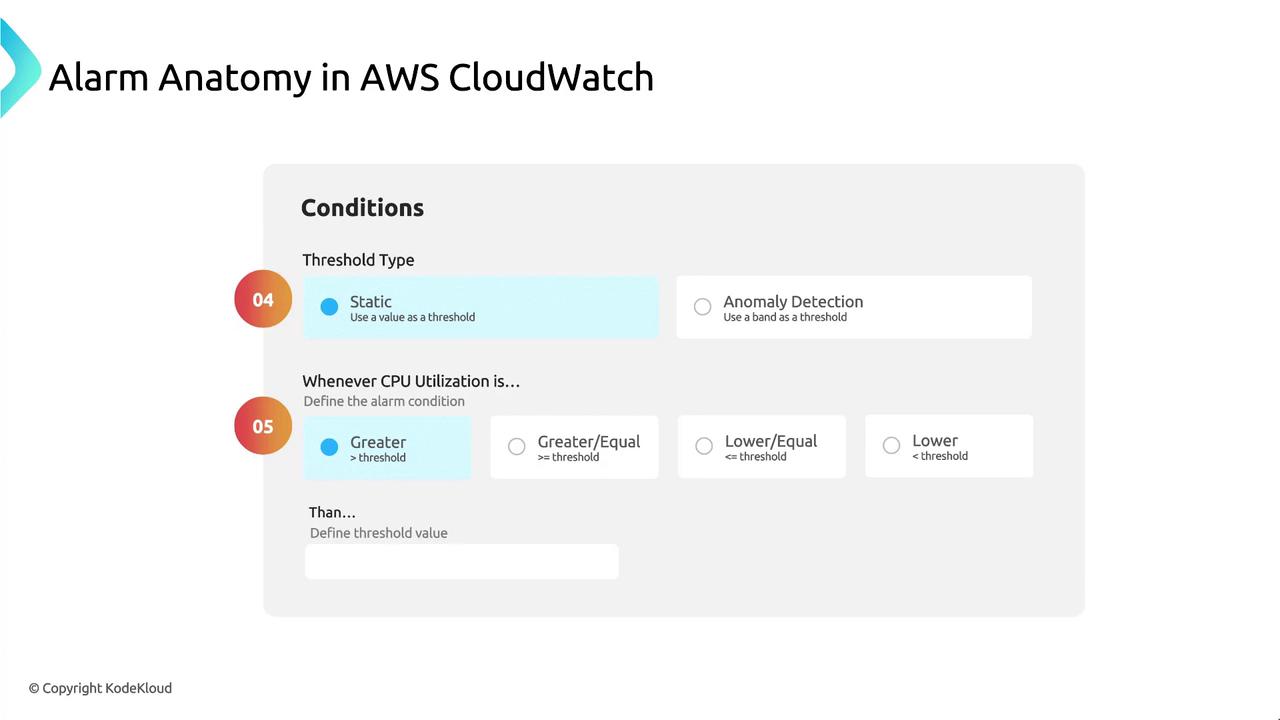
The image is a diagram explaining the conditions for setting an alarm in AWS CloudWatch, focusing on threshold types and CPU utilization criteria. It includes options for static and anomaly detection thresholds, and conditions like greater, greater/equal, lower/equal, and lower.
Consider using anomaly detection thresholds for dynamic baselines instead of static thresholds.
Avoid setting low thresholds with short evaluation periods—this can generate noise from transient spikes. Tune EvaluationPeriods and DatapointsToAlarm for stability.

Notification Settings

Define how CloudWatch alerts you when the alarm state changes:
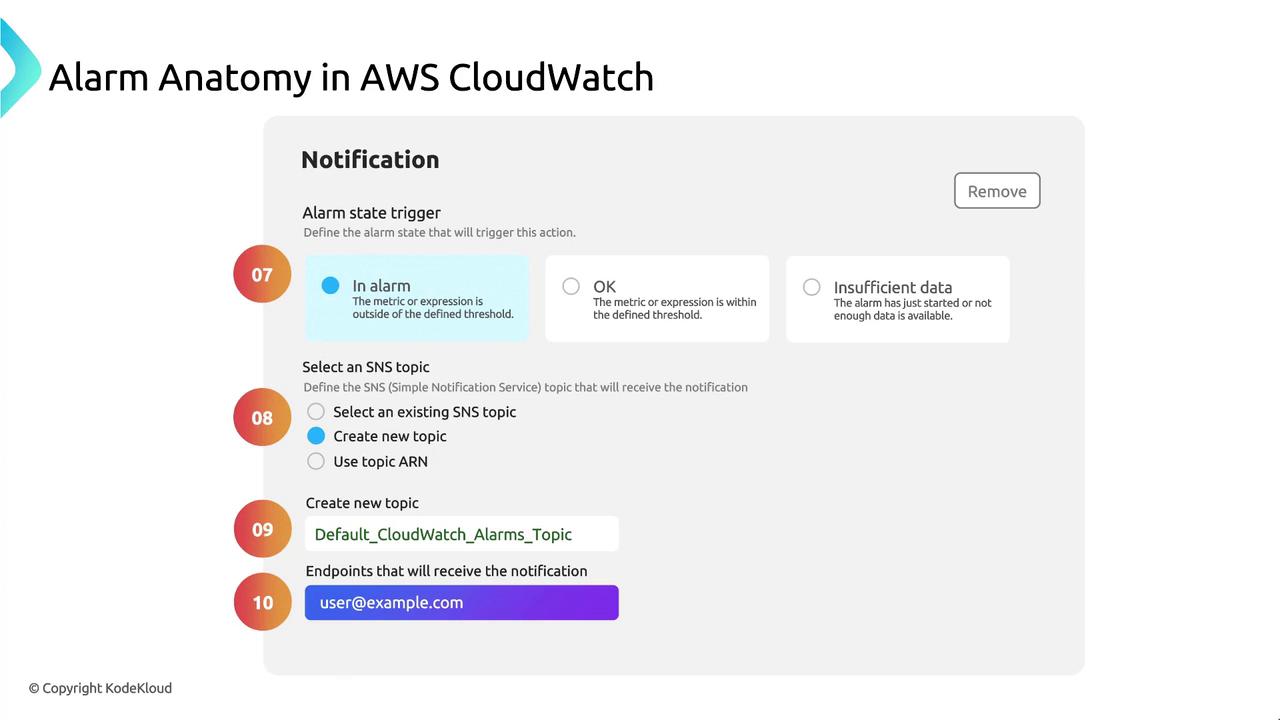
The image is a diagram explaining the notification settings for an alarm in AWS CloudWatch, detailing alarm state triggers and SNS topic selection. It includes options for defining alarm states and creating or selecting SNS topics for notifications.

Watch Video