Key Features
| Feature | Benefit |
|---|---|
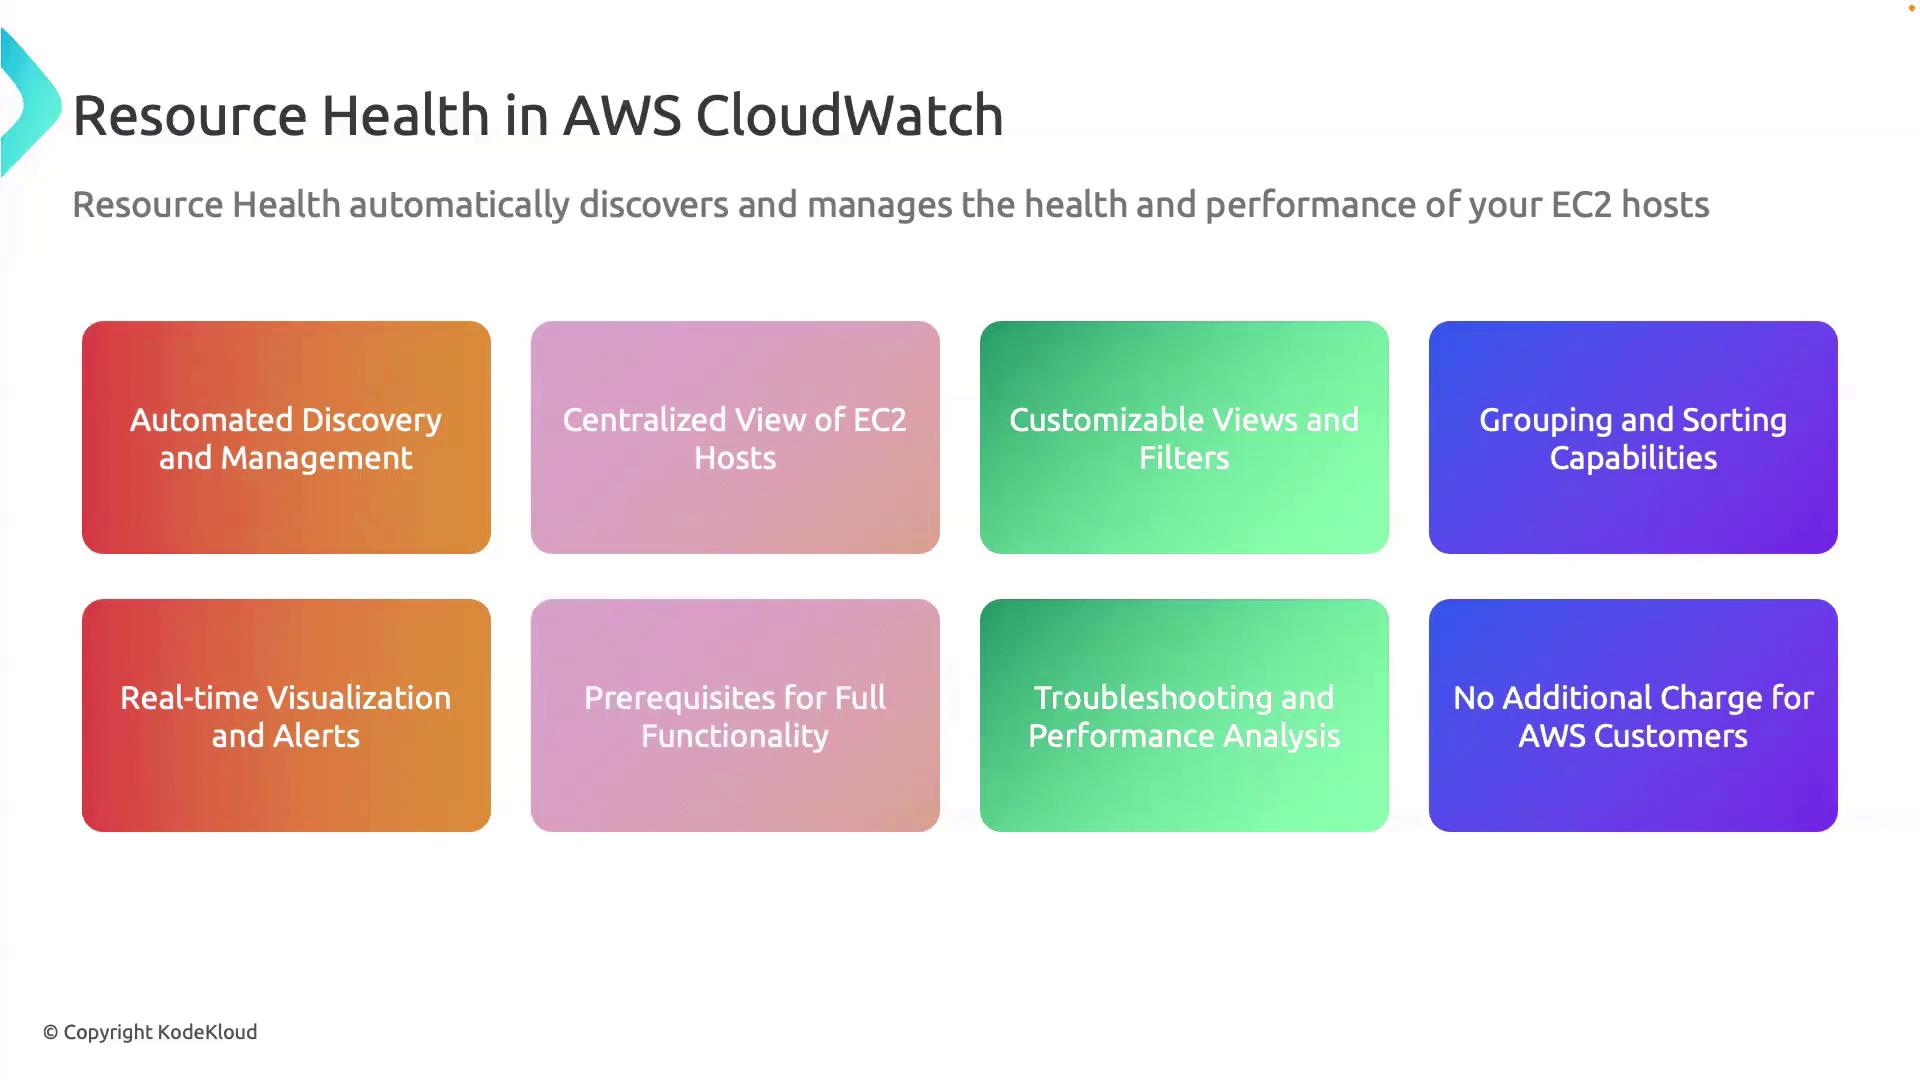
| Automated Discovery | Instantly discovers all EC2 instances and begins monitoring without manual setup. |
| Centralized Dashboard | Offers a single pane of glass across accounts and regions to spot trends and anomalies. |
| Customizable Views & Filters | Drill into CPU, memory, network I/O or filter by tag, instance type, or availability zone. |
| Grouping & Sorting | Organize instances by custom tags, AZ, or type to quickly isolate performance issues. |
| Real-Time Monitoring | See live updates on all metrics, enabling faster response to unexpected behavior. |
Prerequisites
- Install the CloudWatch agent on each EC2 instance to collect OS-level metrics (memory, disk, etc.).
- Configure IAM roles and policies to allow the agent to push metrics and grant users dashboard viewing rights.
Memory and disk metrics are not collected by default. Ensure the CloudWatch agent configuration file includes the appropriate sections for
mem_used_percent, disk_used_percent, and any other OS-level metrics you require.Your IAM policy must include permissions such as
cloudwatch:PutMetricData, logs:CreateLogStream, logs:PutLogEvents, and cloudwatch:GetDashboard to fully leverage Resource Health.Benefits
- Improved Troubleshooting: Quickly pinpoint underutilized or overutilized instances with contextual metrics.
- Performance Analysis: Combine historical and real-time data to optimize capacity planning.
- Zero Additional Cost: Resource Health is included at no extra charge for all AWS customers.
Next Steps
- Deploy the CloudWatch agent using the AWS Systems Manager Run Command.
- Create a Resource Health dashboard and apply custom filters for your critical workloads.
- Explore automated alerts and integrate with Amazon SNS or third-party tools for notifications.
References
- AWS CloudWatch Resource Health Documentation
- Installing and Configuring the CloudWatch Agent
- AWS Identity and Access Management User Guide