AWS CloudWatch

Cloudwatch Insights X Ray and Service Map

Demo Setting up X Ray with a Sample Application

In this guide, you’ll learn how to deploy a demo app on AWS, instrument it with AWS X-Ray, and analyze traces and service maps in Amazon CloudWatch. By the end, you’ll have end-to-end visibility into a microservices architecture using HTTP endpoints, ECS, and DynamoDB.

Prerequisites

  • An AWS account with permissions for CloudWatch, X-Ray, CloudFormation, ECS, DynamoDB, and IAM
  • AWS CLI or Console access

Note

Make sure your IAM user or role has the required permissions for deploying CloudFormation stacks and viewing X-Ray service maps.

Step 1: Deploy the Sample Application via CloudFormation

  1. Log in to the AWS Console and open CloudWatch.
  2. In the left sidebar, expand X-Ray Traces and select Service Map.
  3. Click Setup Demo App, then choose Create Sample Application with CloudFormation.
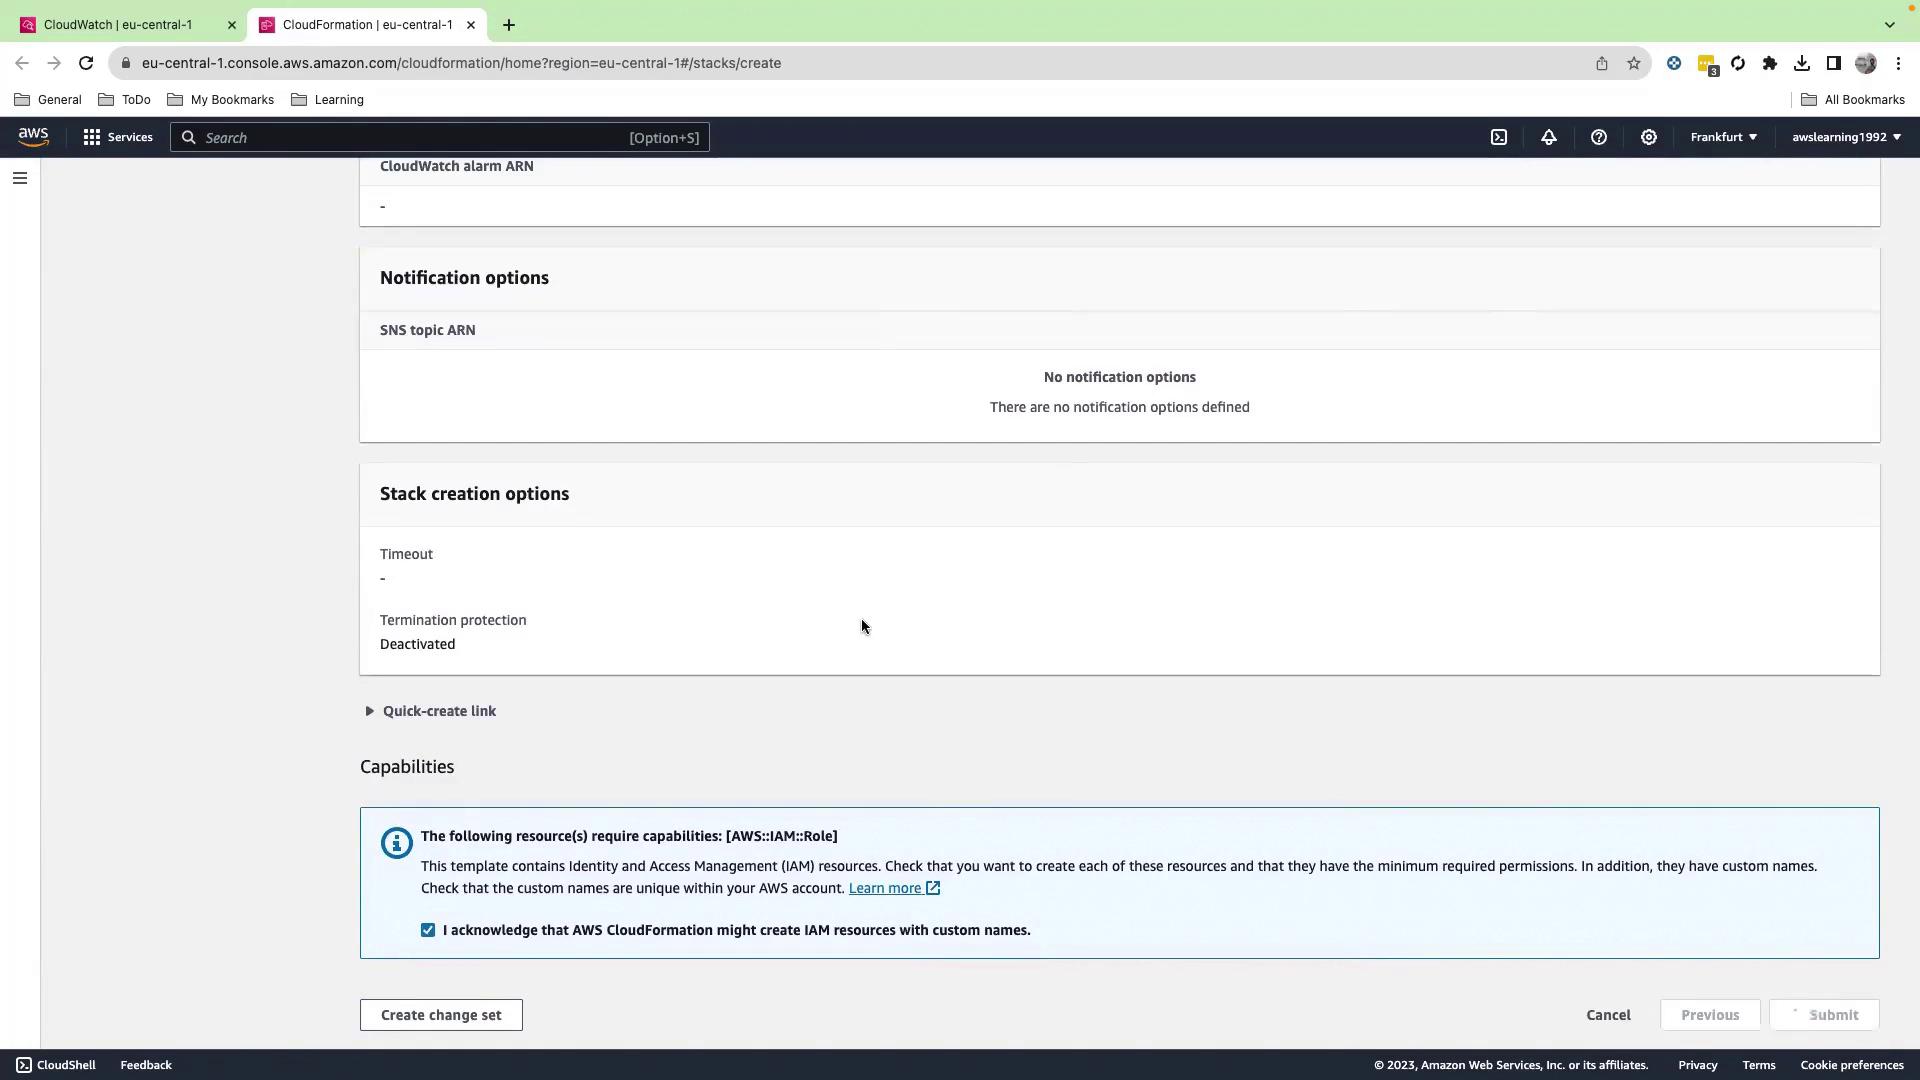
  4. Proceed through the wizard without changing defaults:
    • NextNext
    • Acknowledge IAM capabilities → Submit

This creates a CloudFormation stack named xray-sample.

The image shows an AWS CloudFormation console page with options for notification and stack creation, including capabilities and IAM resource acknowledgments.

Warning

The demo stack provisions ECS clusters, an Application Load Balancer, and DynamoDB tables. You may incur AWS charges—remember to delete the stack when you're done.

Step 2: Wait for Stack Completion

Monitor the stack events and wait until the status changes to CREATE_COMPLETE.

The image shows an AWS CloudFormation console with a stack named "xray-sample" in the process of being created. The status is "CREATE_IN_PROGRESS" and the event is user-initiated.

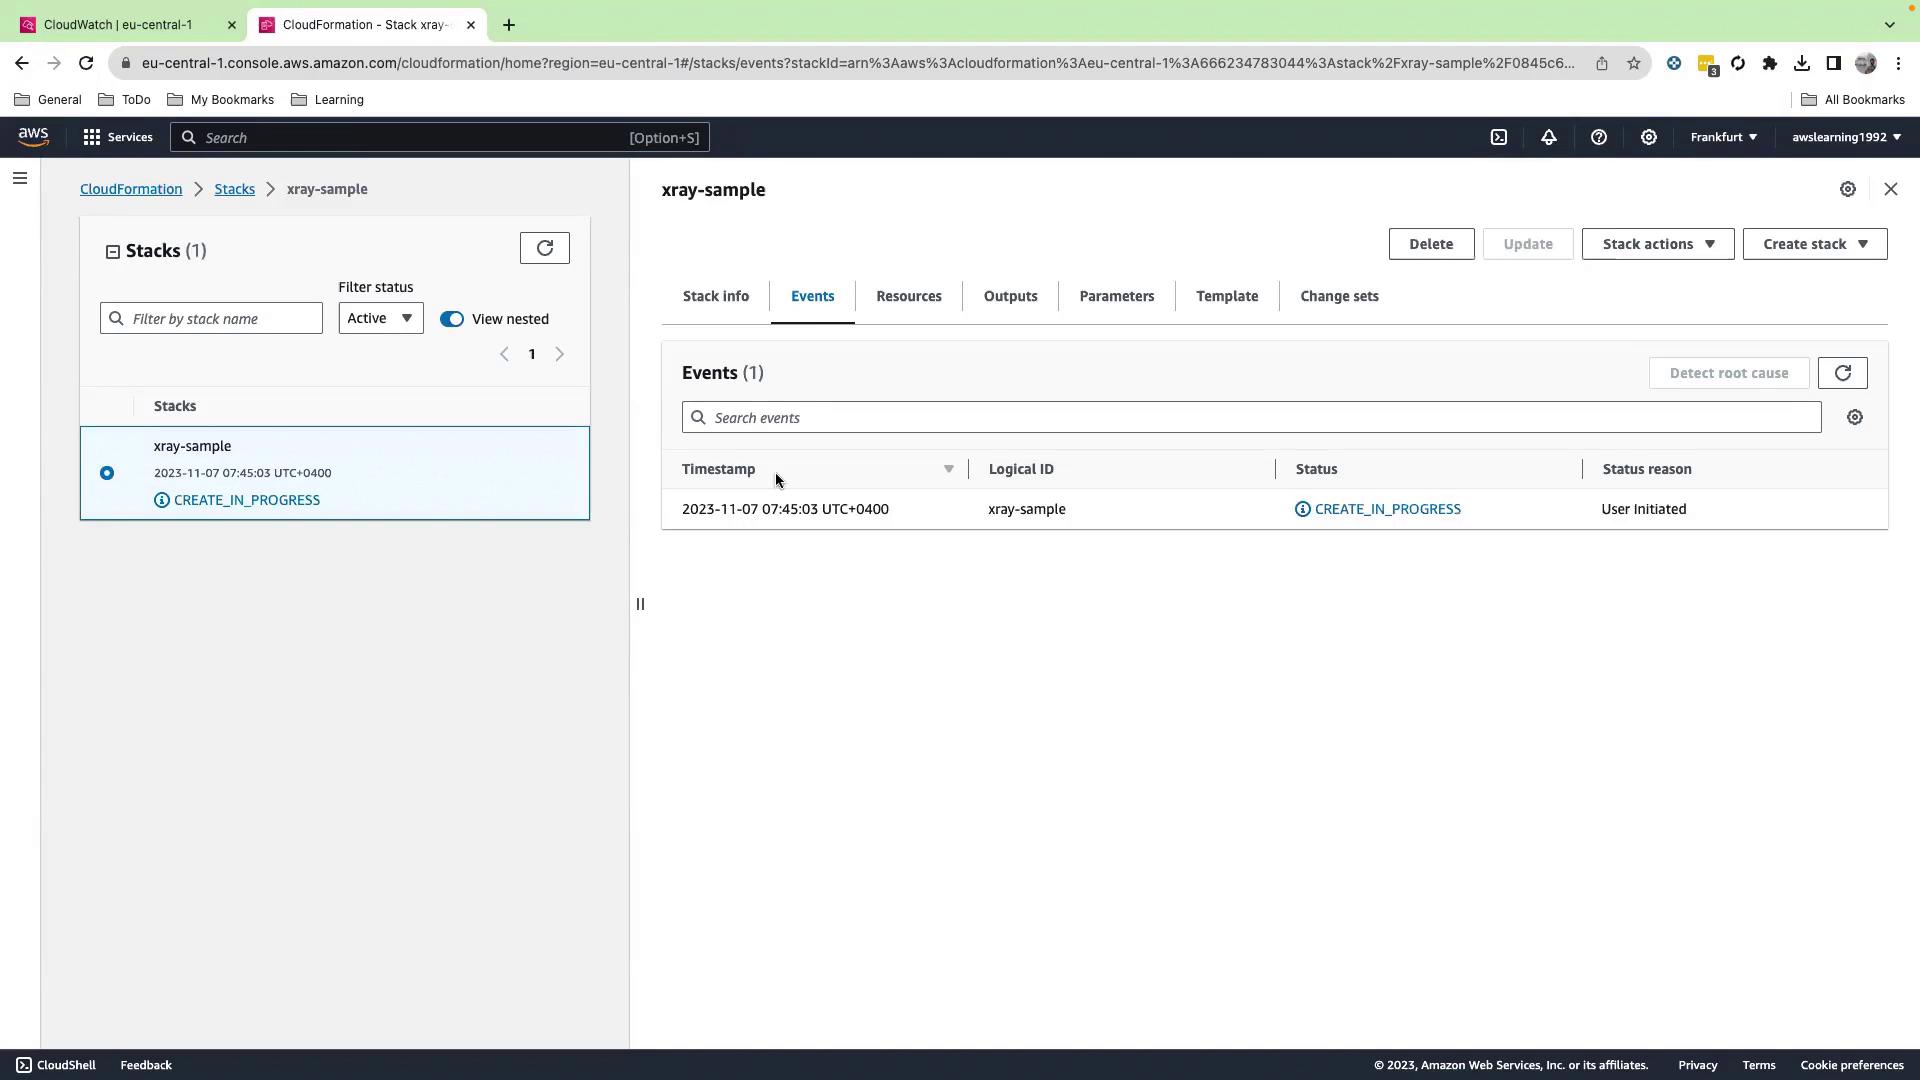
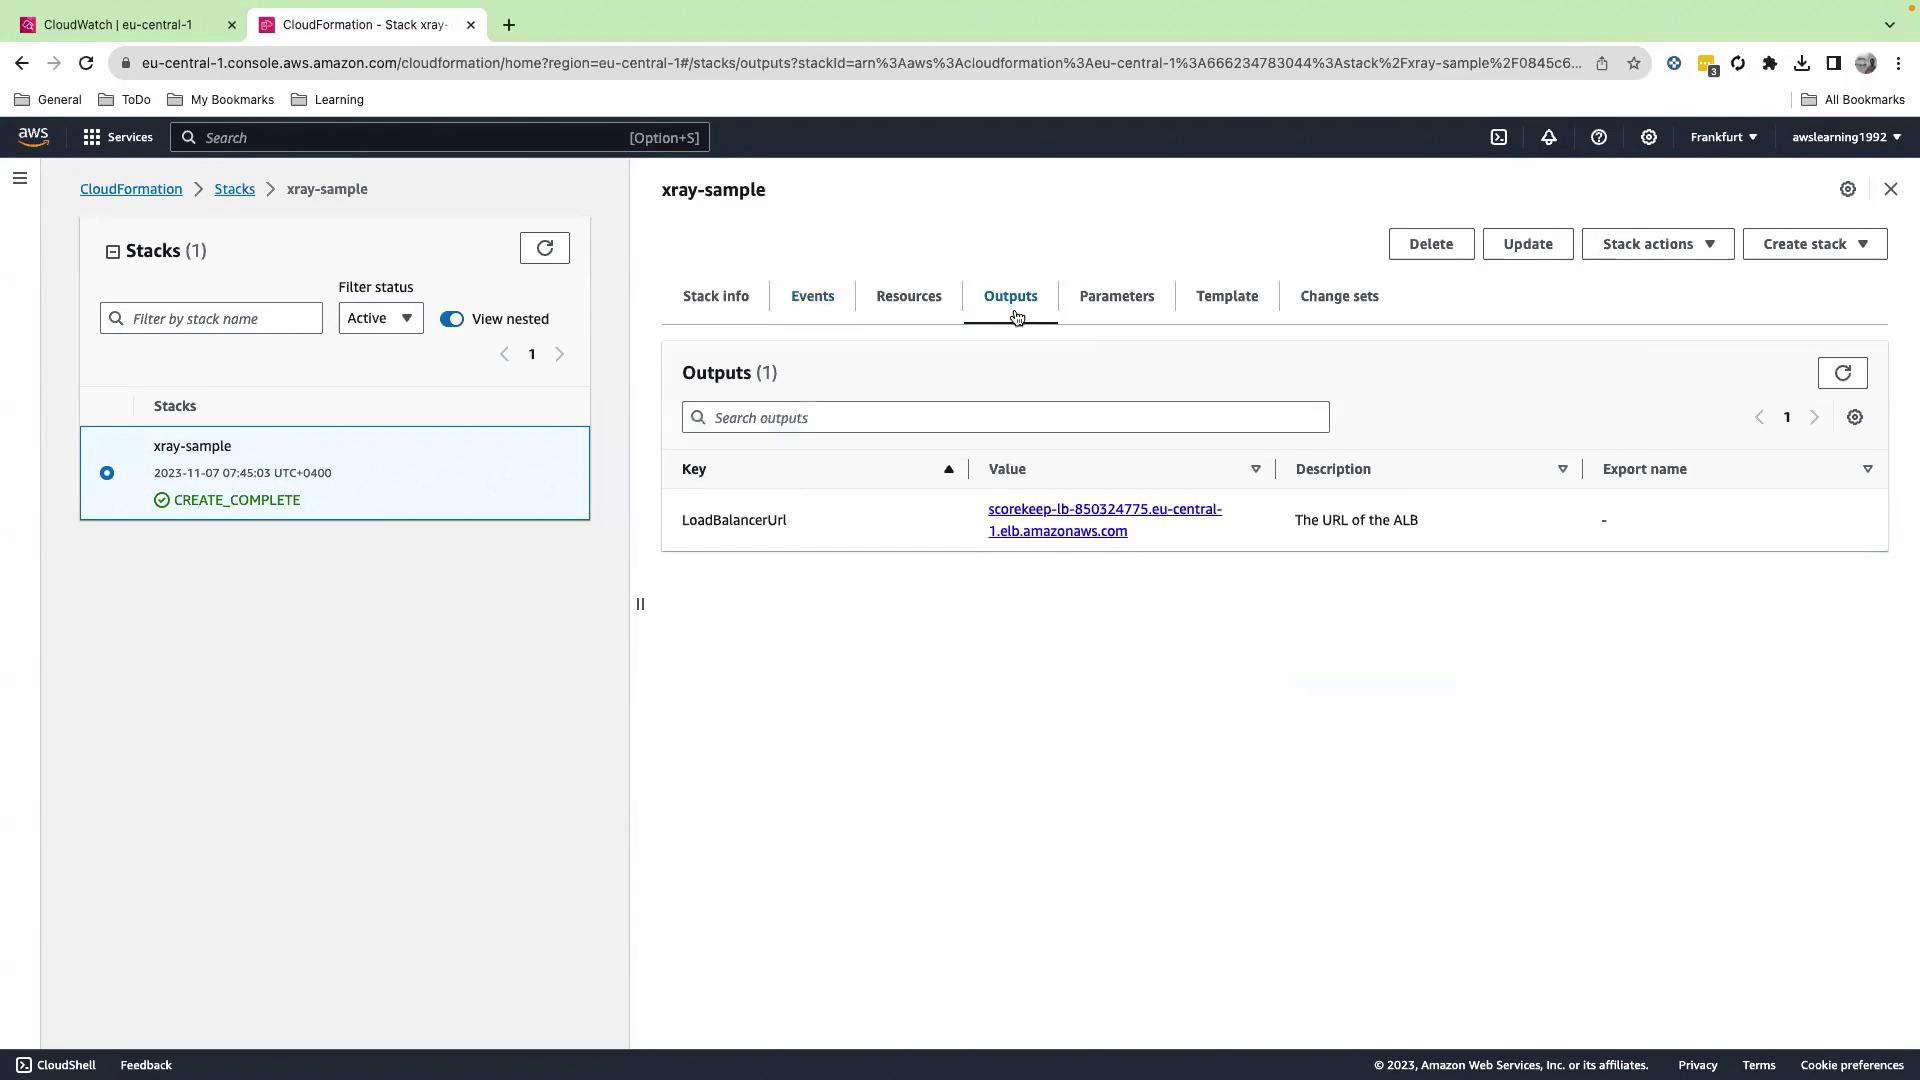
Step 3: Retrieve the Load Balancer URL

  1. Once complete, switch to the Outputs tab.
  2. Copy the LoadBalancerUrl value.

The image shows an AWS CloudFormation console with a stack named "xray-sample" that has a status of "CREATE_COMPLETE." The Outputs tab displays a LoadBalancerUrl with a specific URL value.

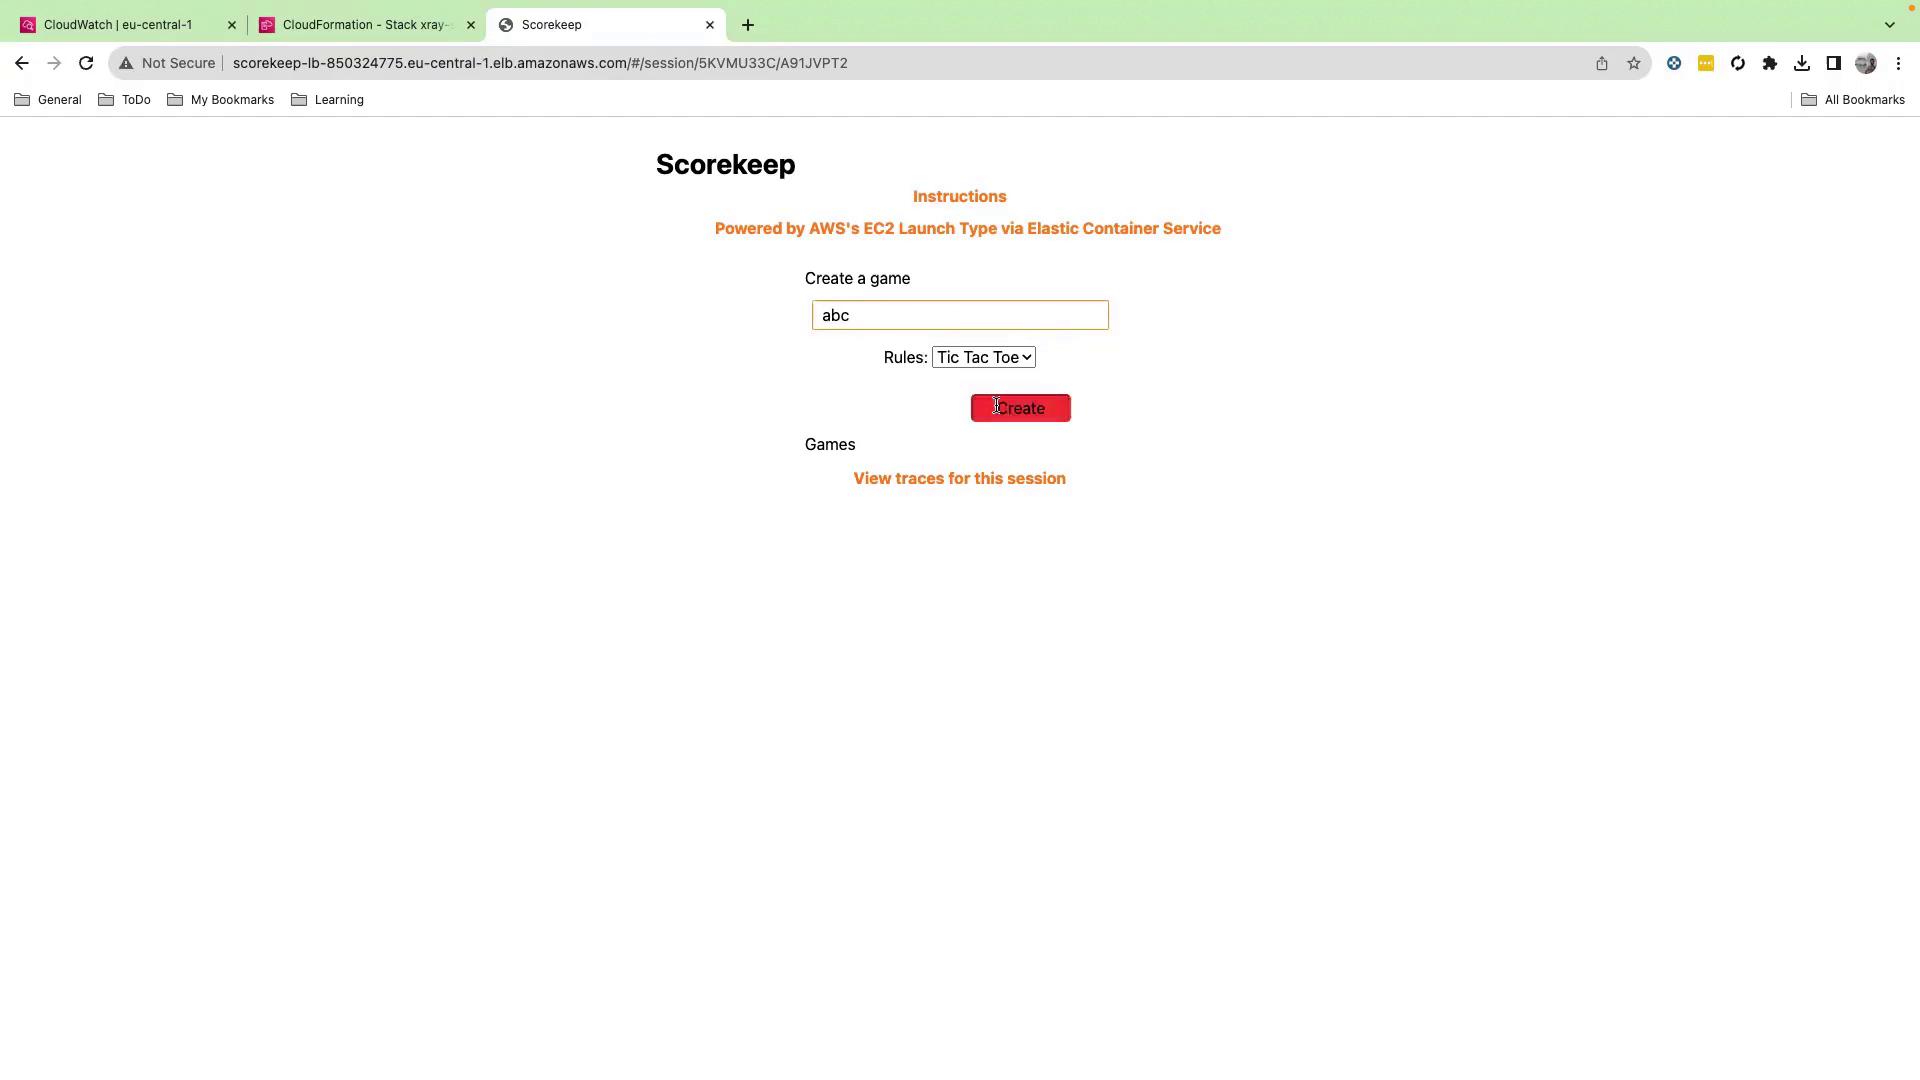
Step 4: Launch the Scorekeep Web App

Paste the LoadBalancerUrl into your browser to open the Scorekeep application.

The image shows a web page titled "Scorekeep" with options to create or join a session, powered by AWS's EC2 Launch Type via Elastic Container Service. There are input fields for a session name and session ID, along with "Create" and "Join" buttons.

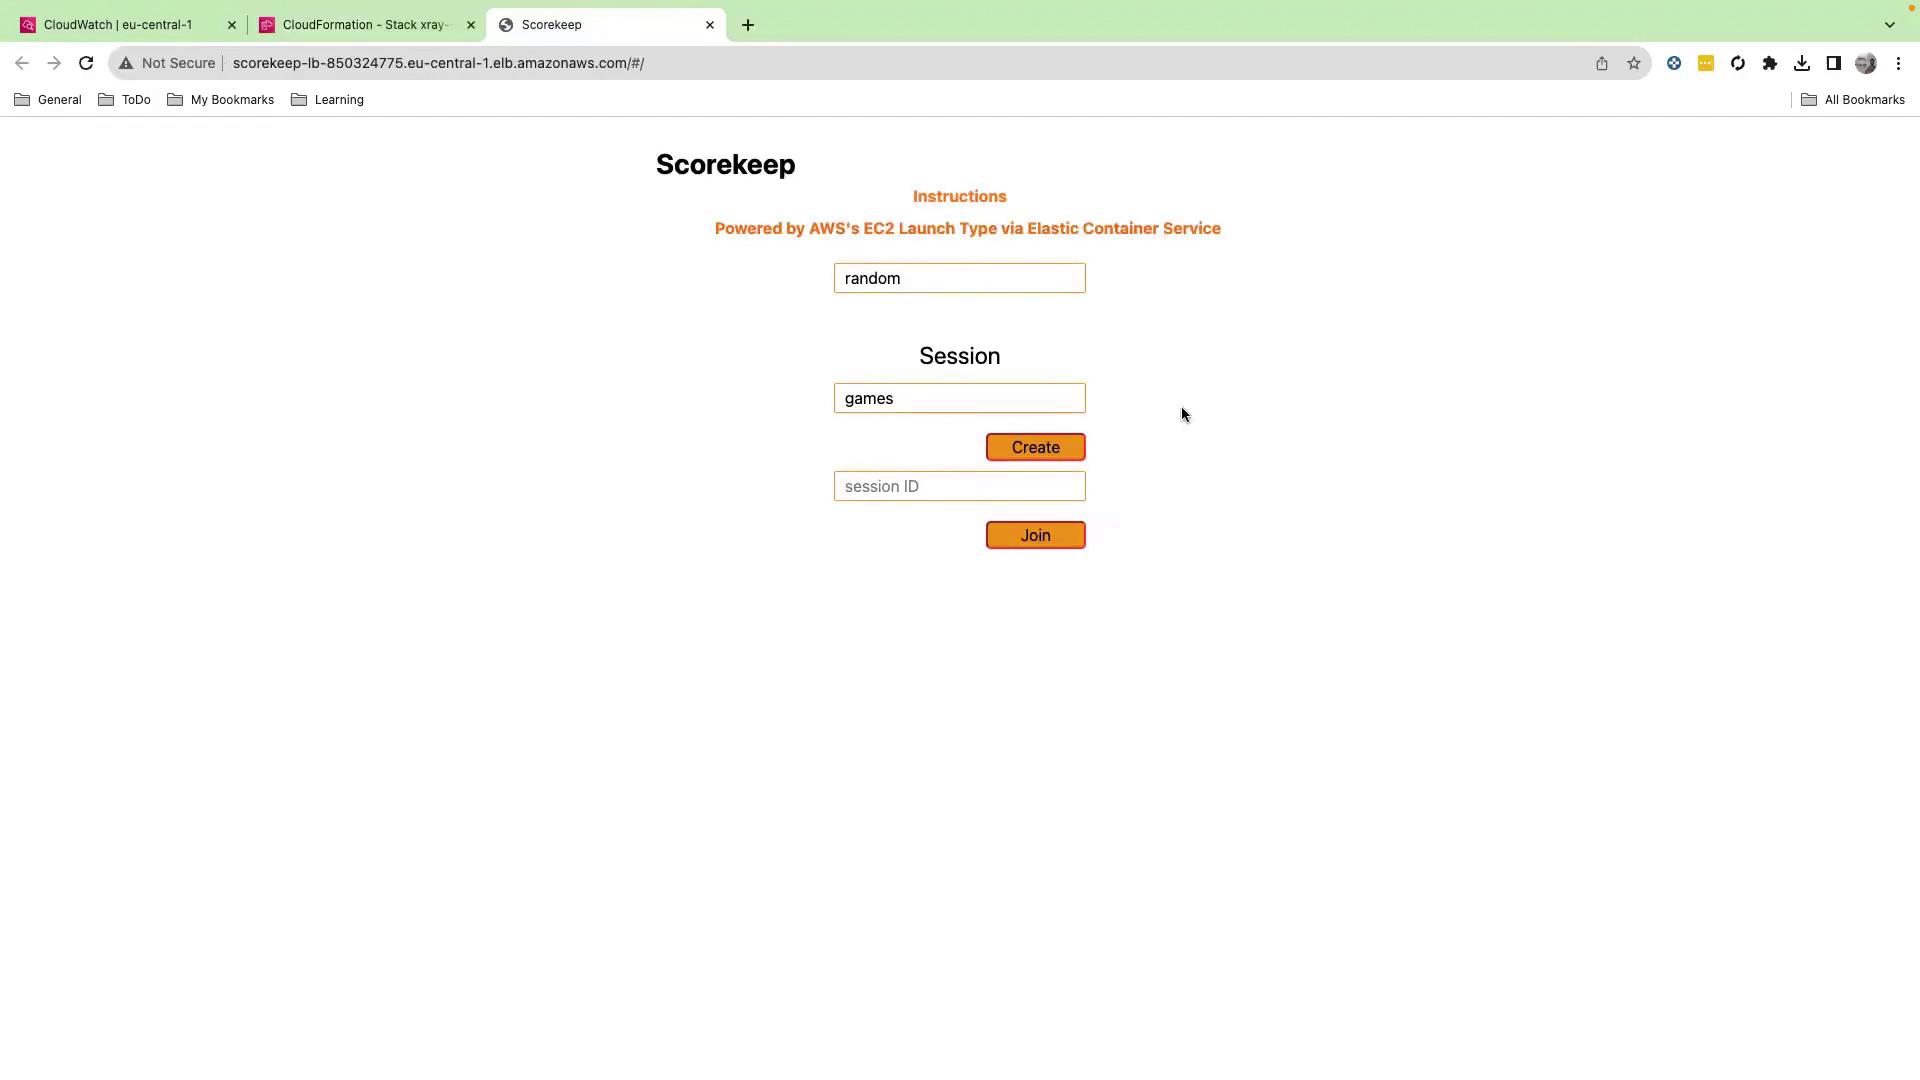
Step 5: Create and Play a Game Session

  1. Click Create.
  2. Enter a session name (e.g., “ABC Tools Tic-Tac-Toe”).
  3. Click Create, then Play.

The image shows a web page titled "Scorekeep" where users can create a game by entering a name and selecting rules, with an option to view session traces. It is powered by AWS's EC2 Launch Type via Elastic Container Service.

Play several rounds of tic-tac-toe. AWS X-Ray collects traces for every request behind the scenes.

The image shows a tic-tac-toe game where "X" has won. It is displayed on a webpage with options to view game traces and a service map.

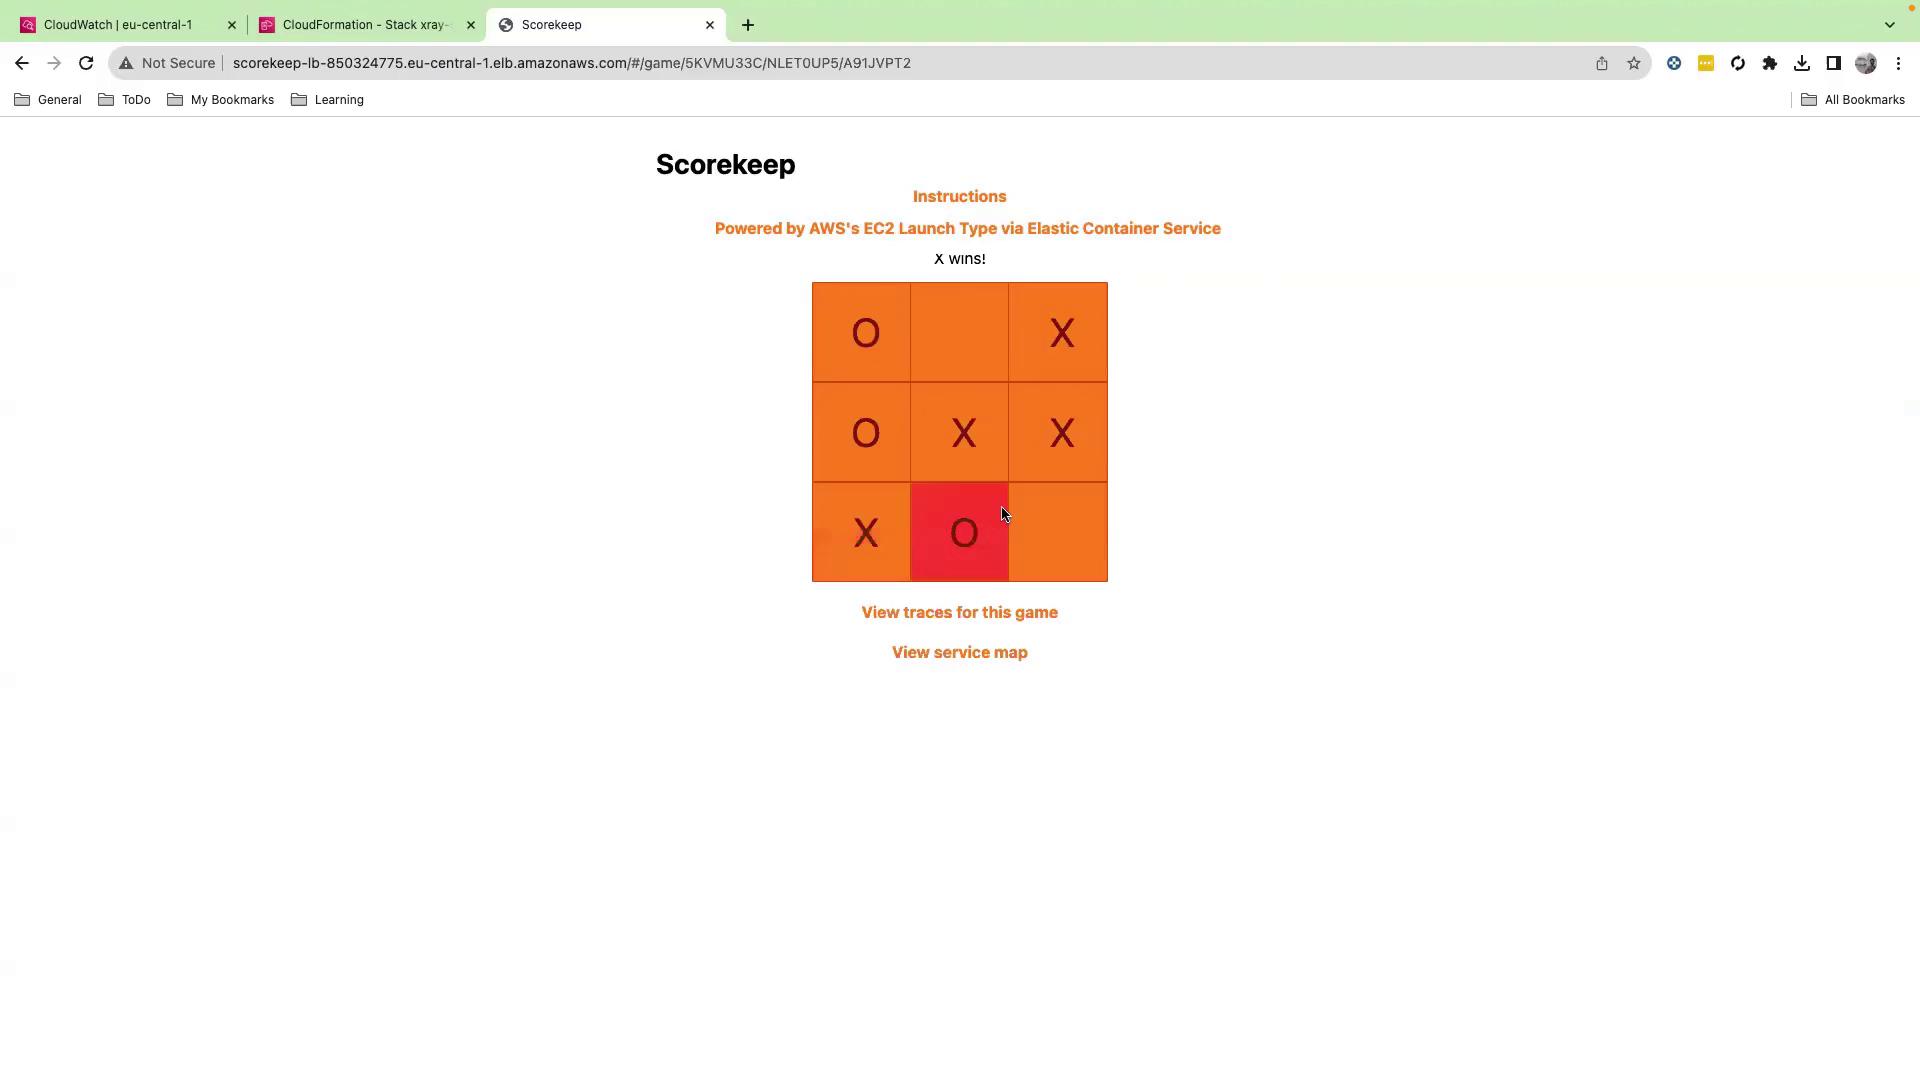
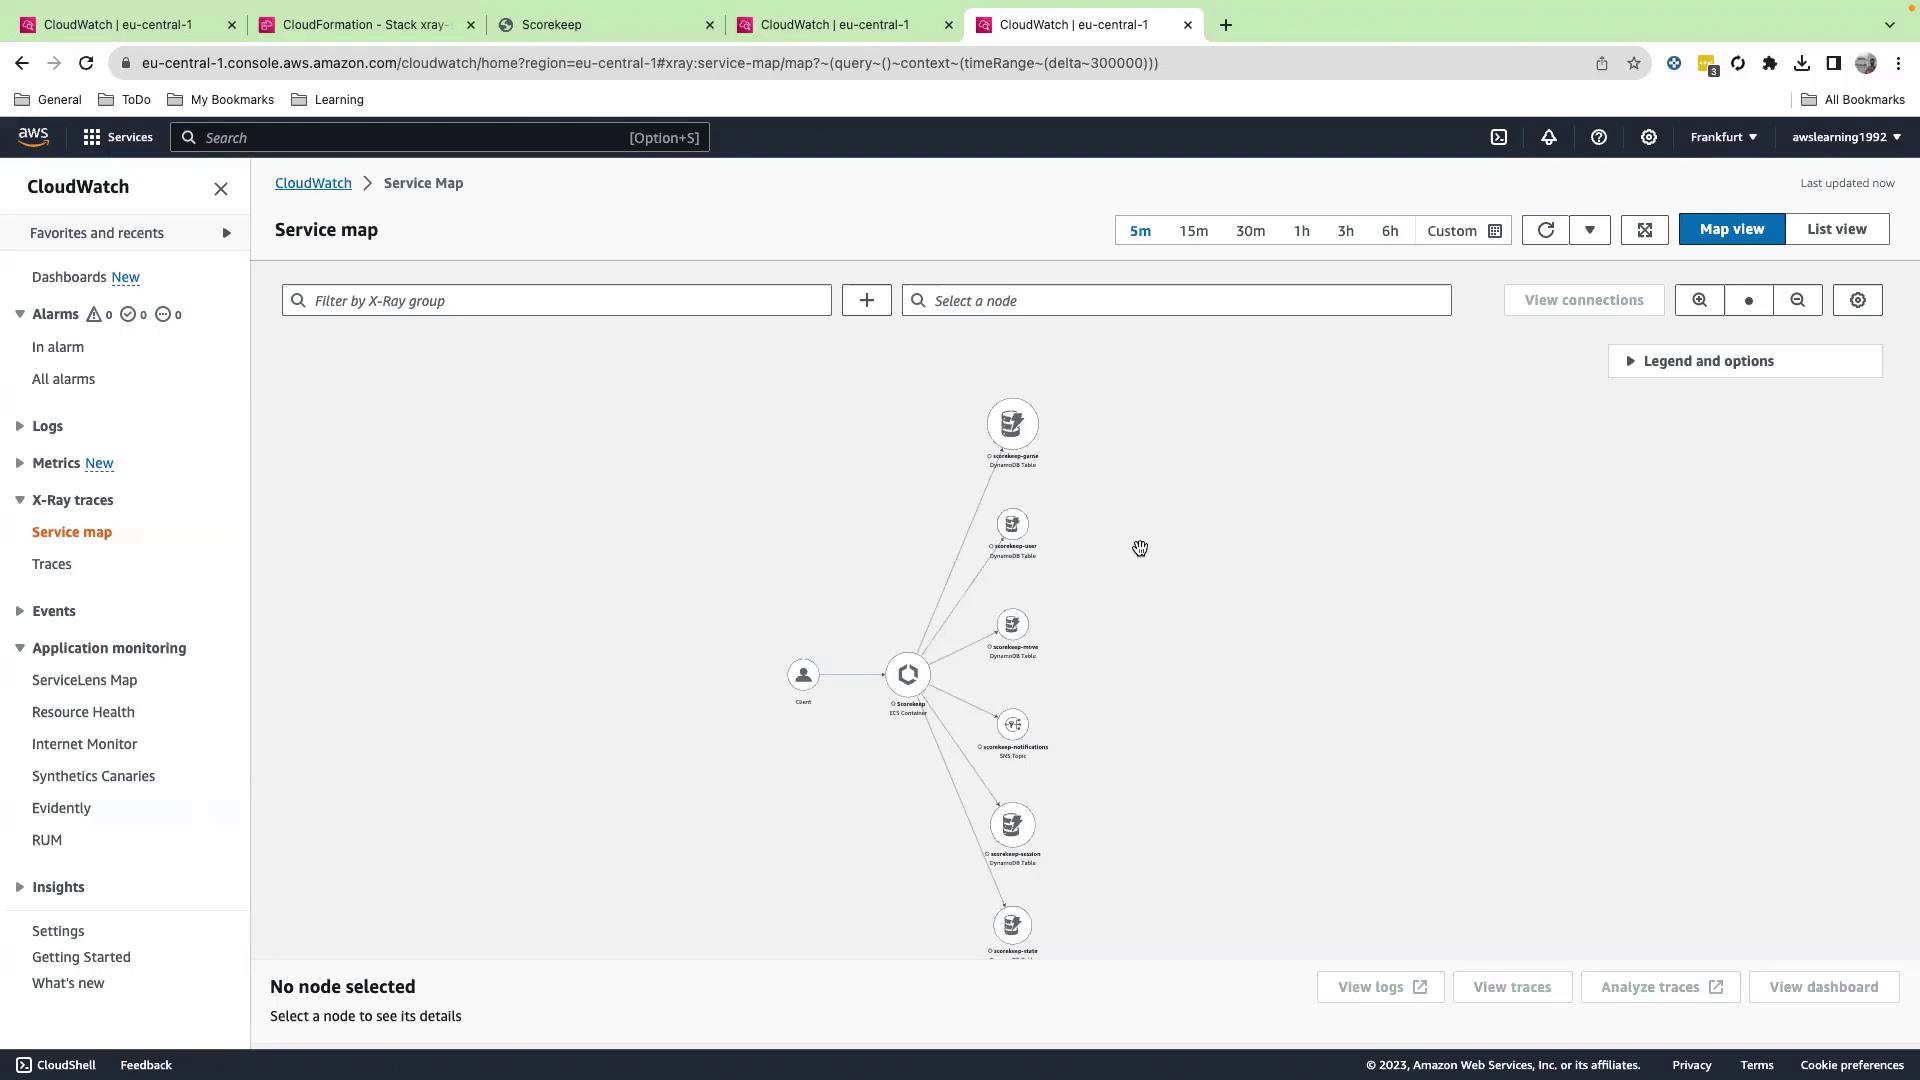
Step 6: View the Service Map

  1. In the Scorekeep UI, click View Service Map.
  2. This opens the X-Ray console displaying your microservices topology.

The image shows an AWS CloudWatch service map interface, displaying connections between various services like ECS containers, SNS topics, and DynamoDB tables. The interface includes options for filtering and viewing logs, traces, and dashboards.

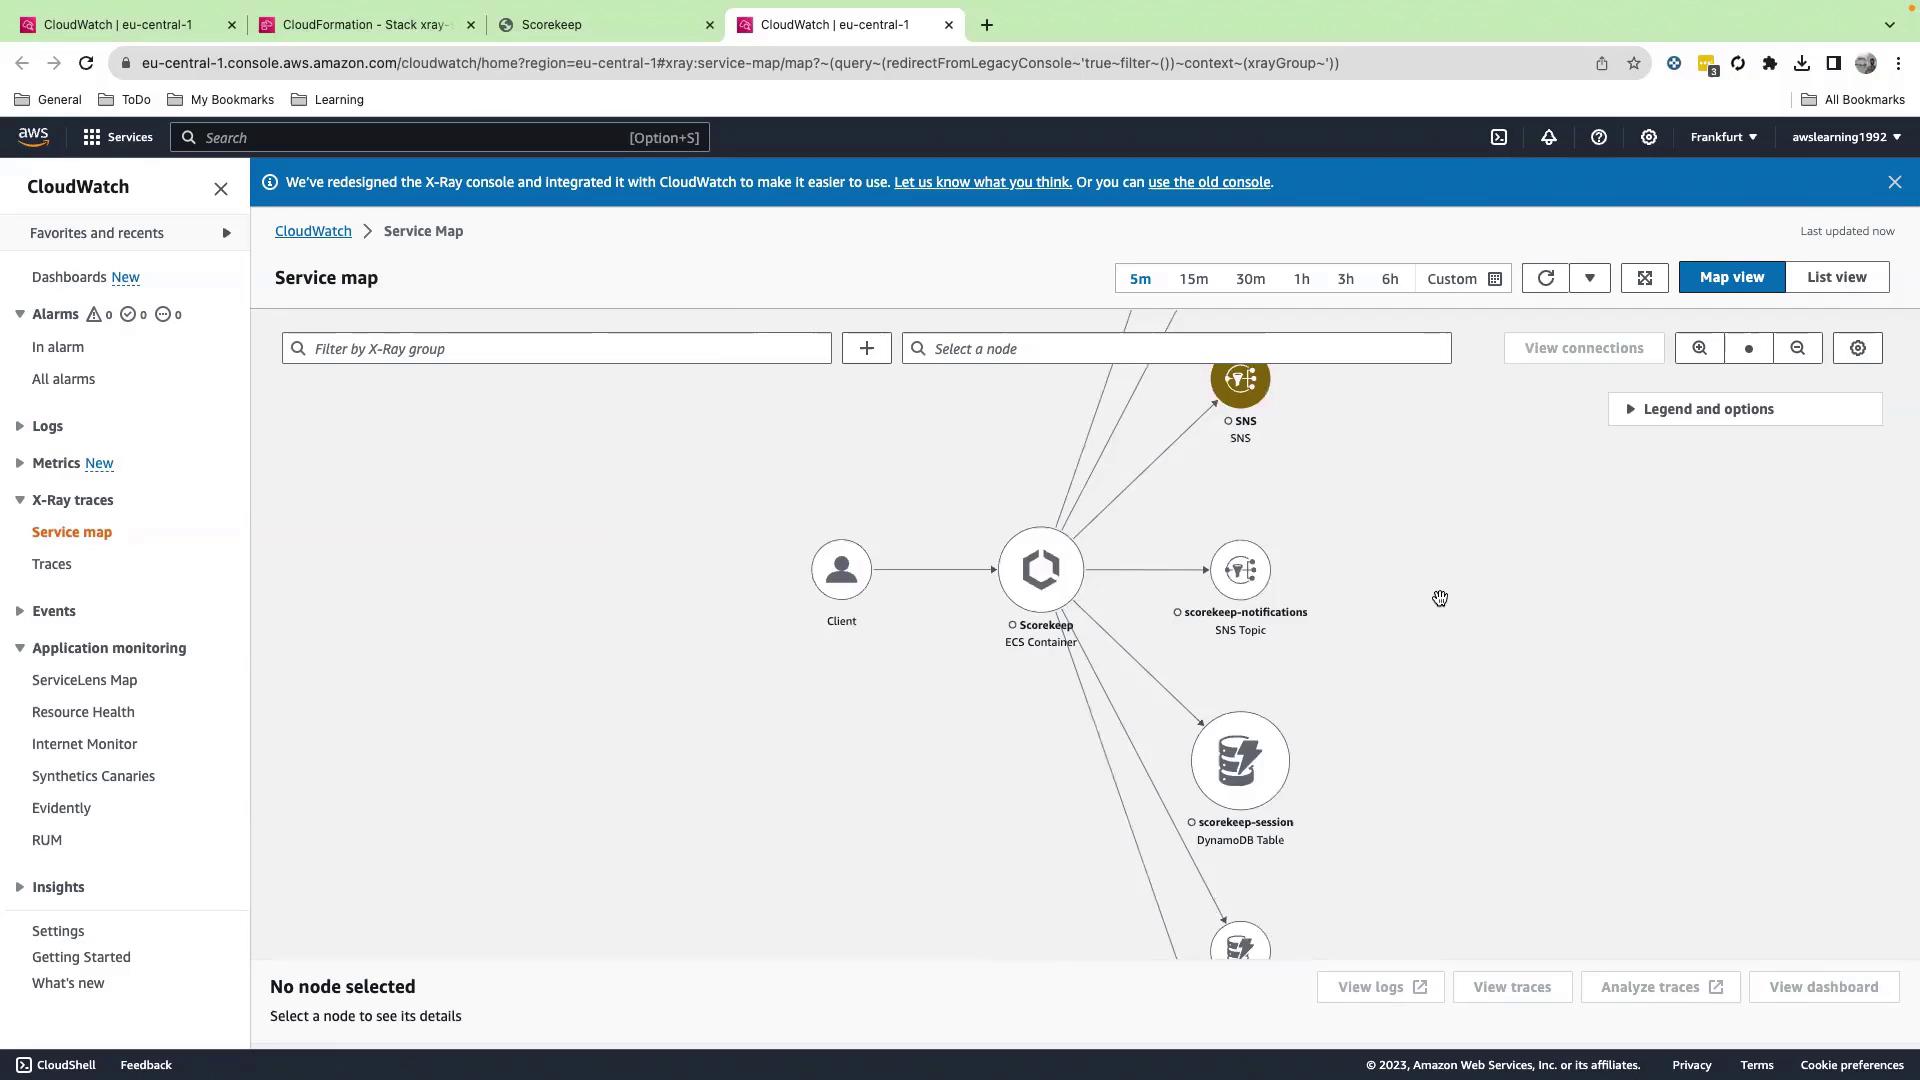
Drill Into Nodes and Traces

  • Select any node (e.g., DynamoDB for user data).
  • View metrics, latency distributions, and HTTP metadata.
  • Click View traces to access individual X-Ray segments.
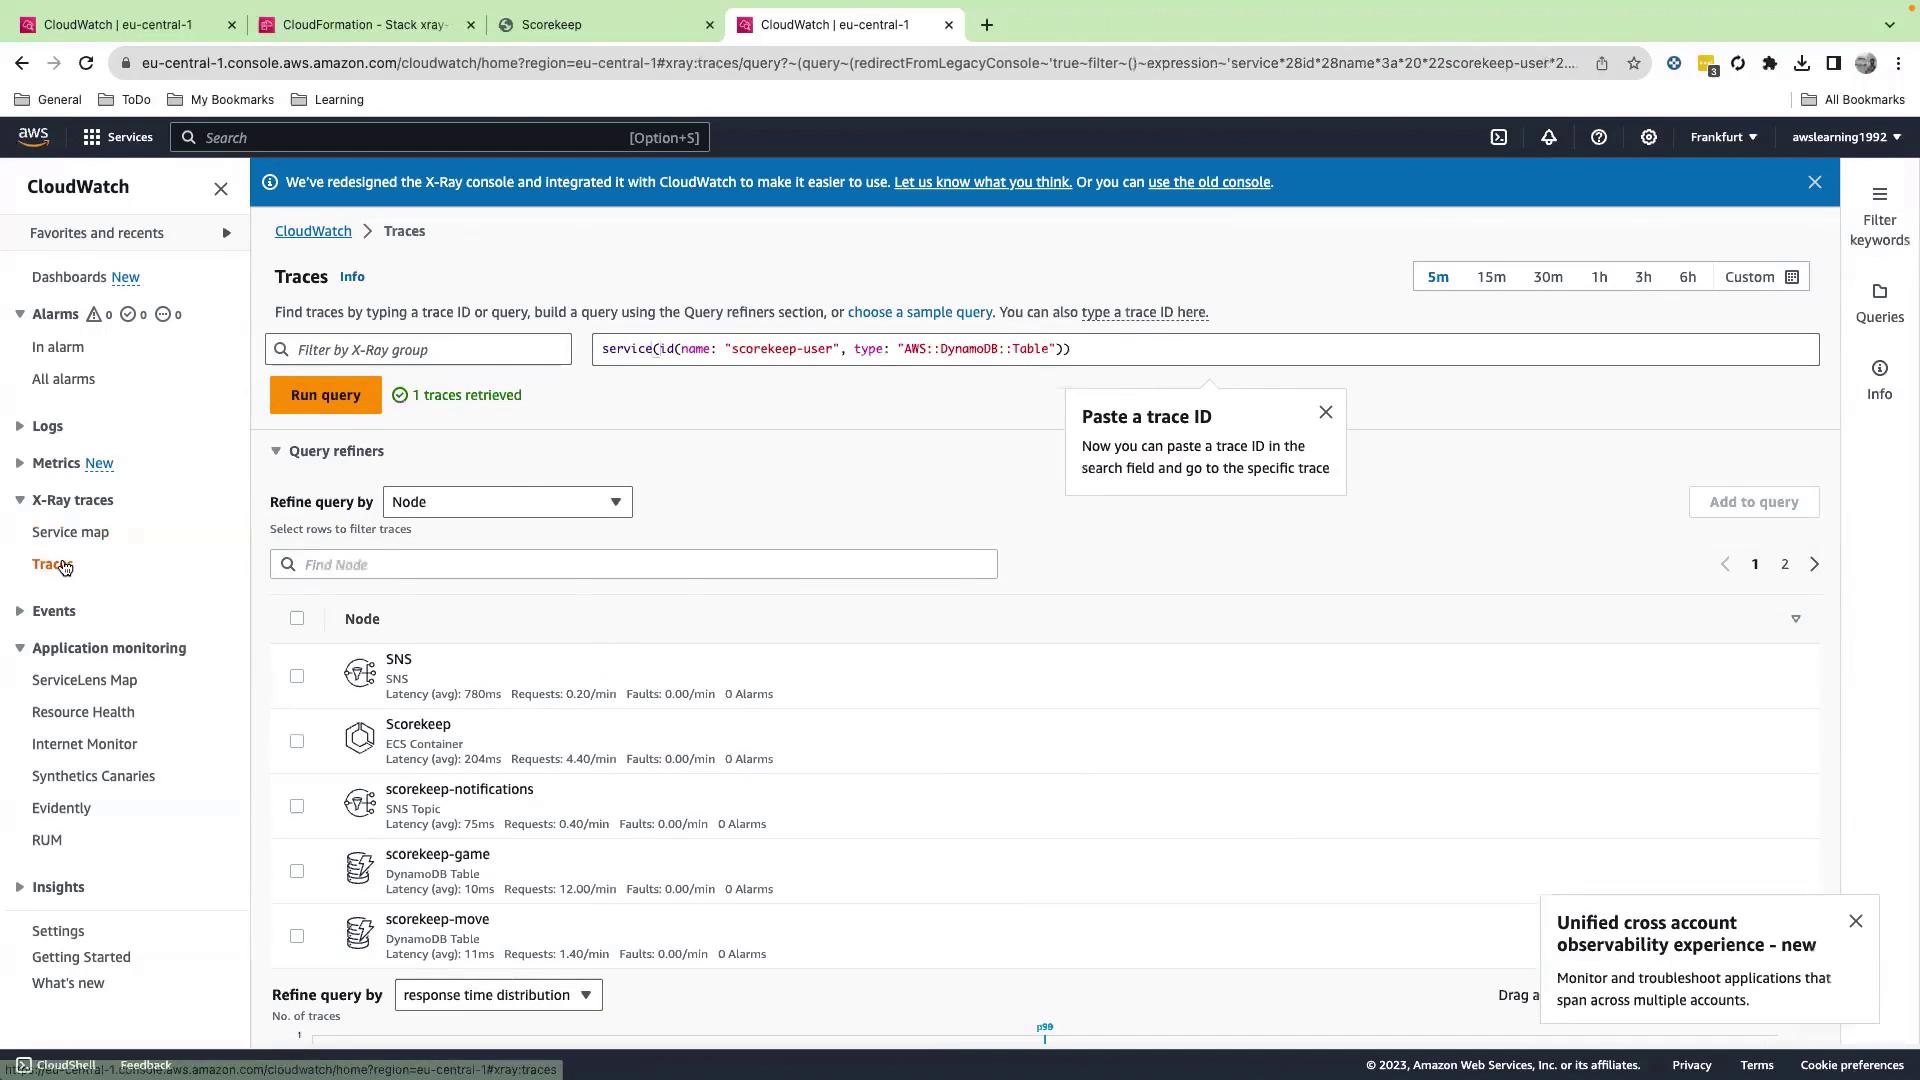
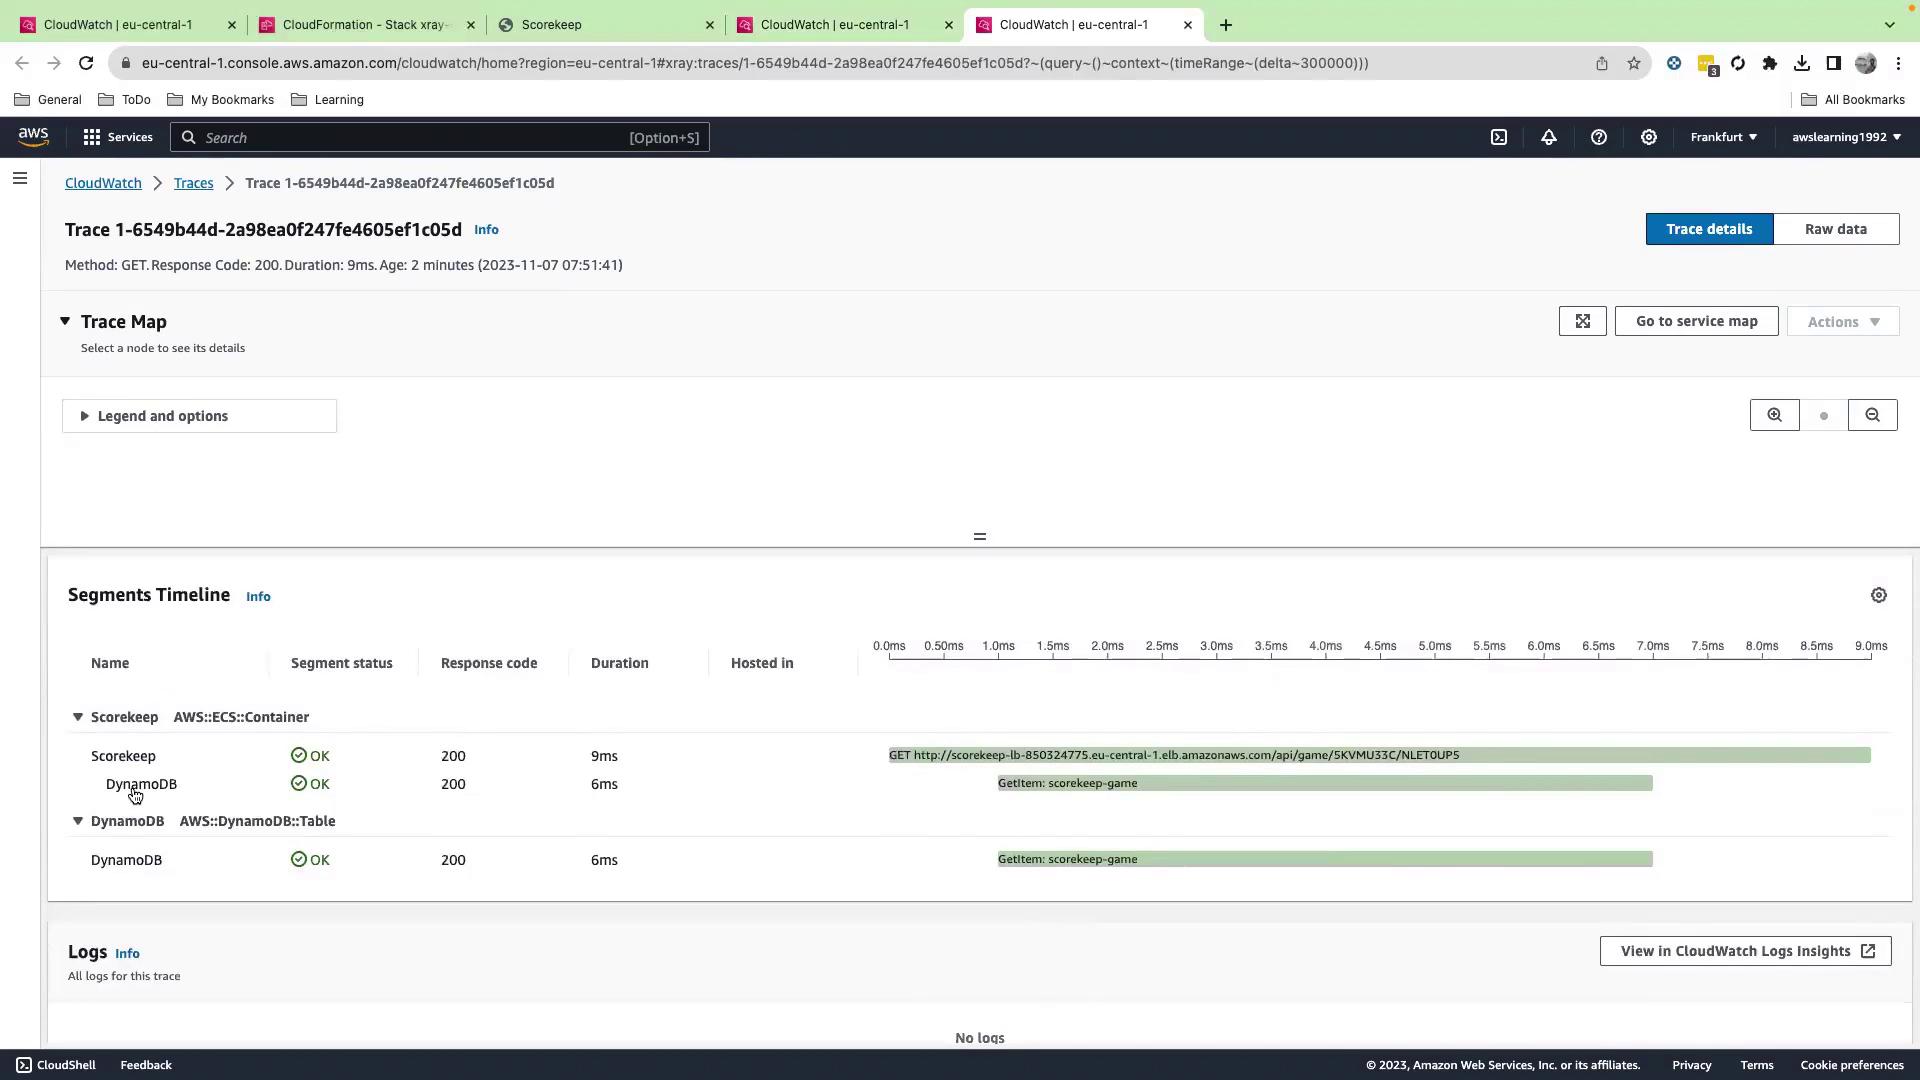
The image shows an AWS CloudWatch interface displaying X-Ray traces with details about various nodes, including latency and request metrics. The interface includes options for refining queries and viewing trace details.

Opening a specific trace reveals each segment’s timeline:

The image shows an AWS CloudWatch X-Ray trace view, detailing a trace with segments for "Scorekeep" and "DynamoDB," including response codes and durations. The timeline visualizes the execution time of each segment.

Here you’ll see:

  • A GET call to the Scorekeep endpoint
  • The corresponding GetItem action on DynamoDB
  • Latency and HTTP status codes for each segment

This full-stack visibility helps you pinpoint latency spikes, errors, and resource bottlenecks.

The image shows an AWS CloudWatch service map interface, displaying a network of connected nodes representing different services and resources.

AWS X-Ray Key Components

ResourcePurposeAWS Service
ECS ContainerHosts the Scorekeep applicationAmazon ECS
Load BalancerRoutes HTTP traffic to containersApplication Load Balancer
DynamoDB TableStores game session and move dataAmazon DynamoDB
SNS TopicPublishes game events notificationsAmazon SNS

Best Practices

  • Enable X-Ray tracing in production by integrating the AWS X-Ray SDK into your code.
  • Use sampling rules to control data volume and cost.
  • Tag resources for trace grouping and filtering.

Note

Regularly review your service map to detect anomalies and optimize the performance of microservices.


References

Watch Video

Watch video content

Previous
Introduction to AWS X Ray and Service map