AWS - IAM

Configure AWS IAM at Scale

Demo CloudWatch

In this guide, you’ll configure an Amazon CloudWatch alarm that notifies you via email whenever an EC2 instance’s average CPU usage exceeds 70% over a five-minute period. This is essential for maintaining optimal performance and responding swiftly to resource bottlenecks.

Prerequisites

RequirementDescription
AWS account with CloudWatch accessPermissions to view metrics and create alarms
Running EC2 instanceThe instance you intend to monitor
Verified email subscription for SNSConfirmed subscription to receive alarm notifications

Warning

Make sure your IAM user or role has the following managed policies:

  • CloudWatchFullAccess
  • AmazonSNSFullAccess

Without these permissions, you won’t be able to create alarms or SNS topics.

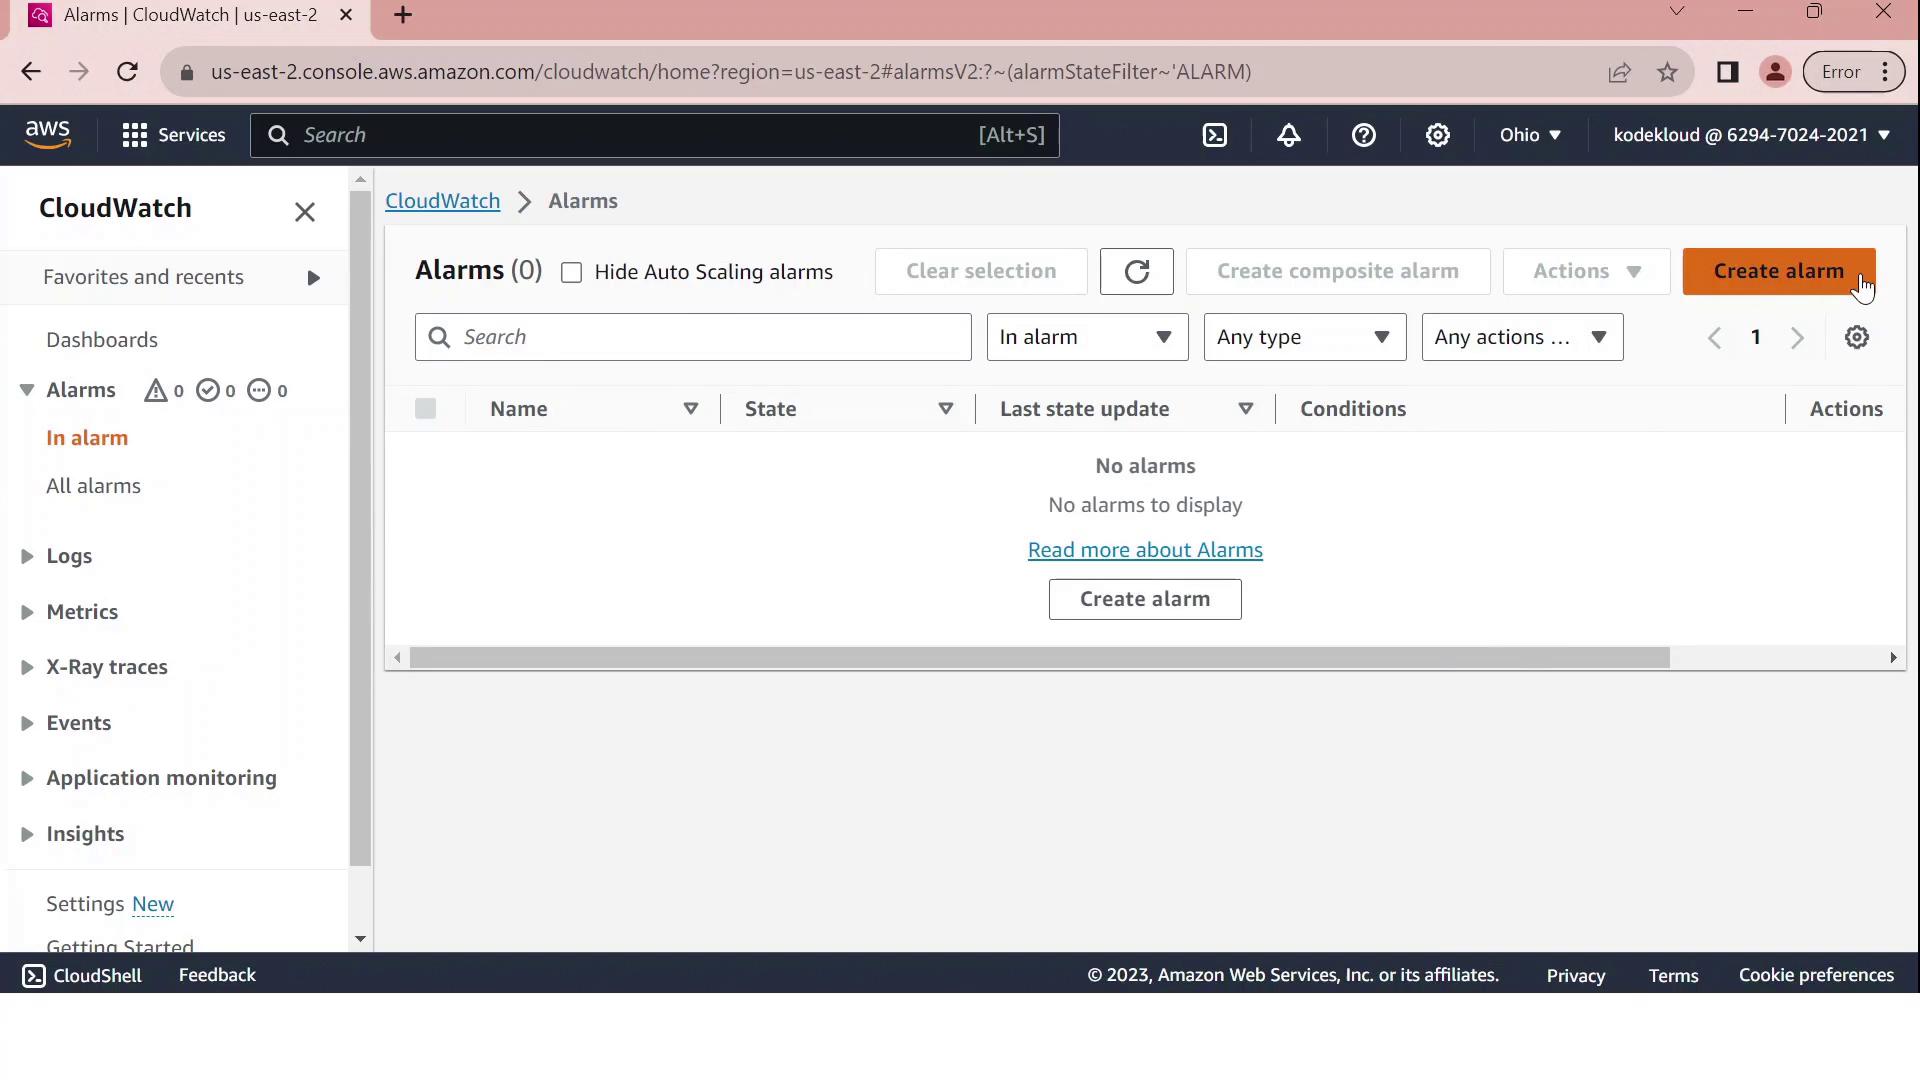
1. Open the Alarms Dashboard

  1. Sign in to the AWS Management Console and open CloudWatch.
  2. In the left navigation pane, choose Alarms, then click Create alarm.

The image shows the AWS CloudWatch Alarms dashboard with no alarms currently displayed. There is an option to create a new alarm.

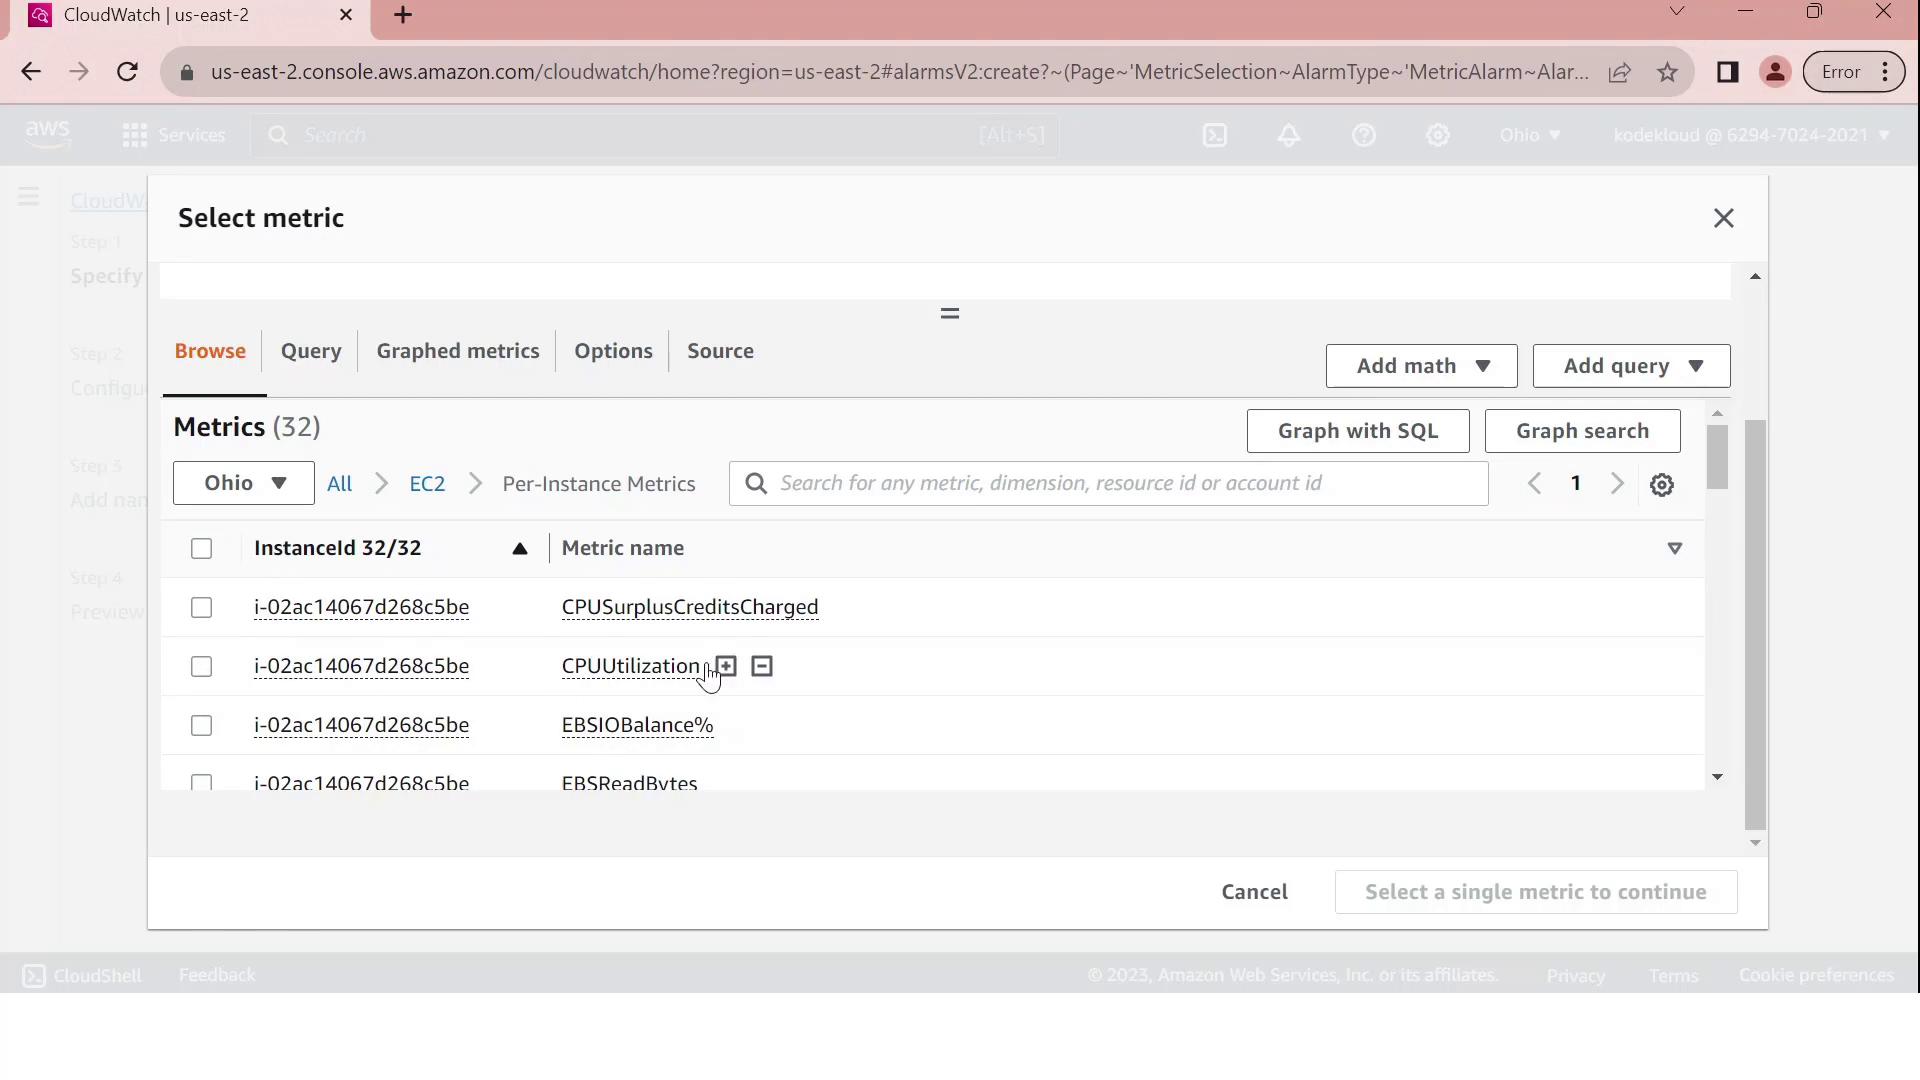
2. Select the EC2 CPUUtilization Metric

  1. On Select metric, pick EC2.
  2. Under Per-Instance Metrics, locate and select your instance’s CPUUtilization metric.
  3. Click Select metric.

The image shows an AWS CloudWatch interface where metrics for an EC2 instance are being selected. It lists various metrics like CPUUtilization and EBSIOBalance% for a specific instance.

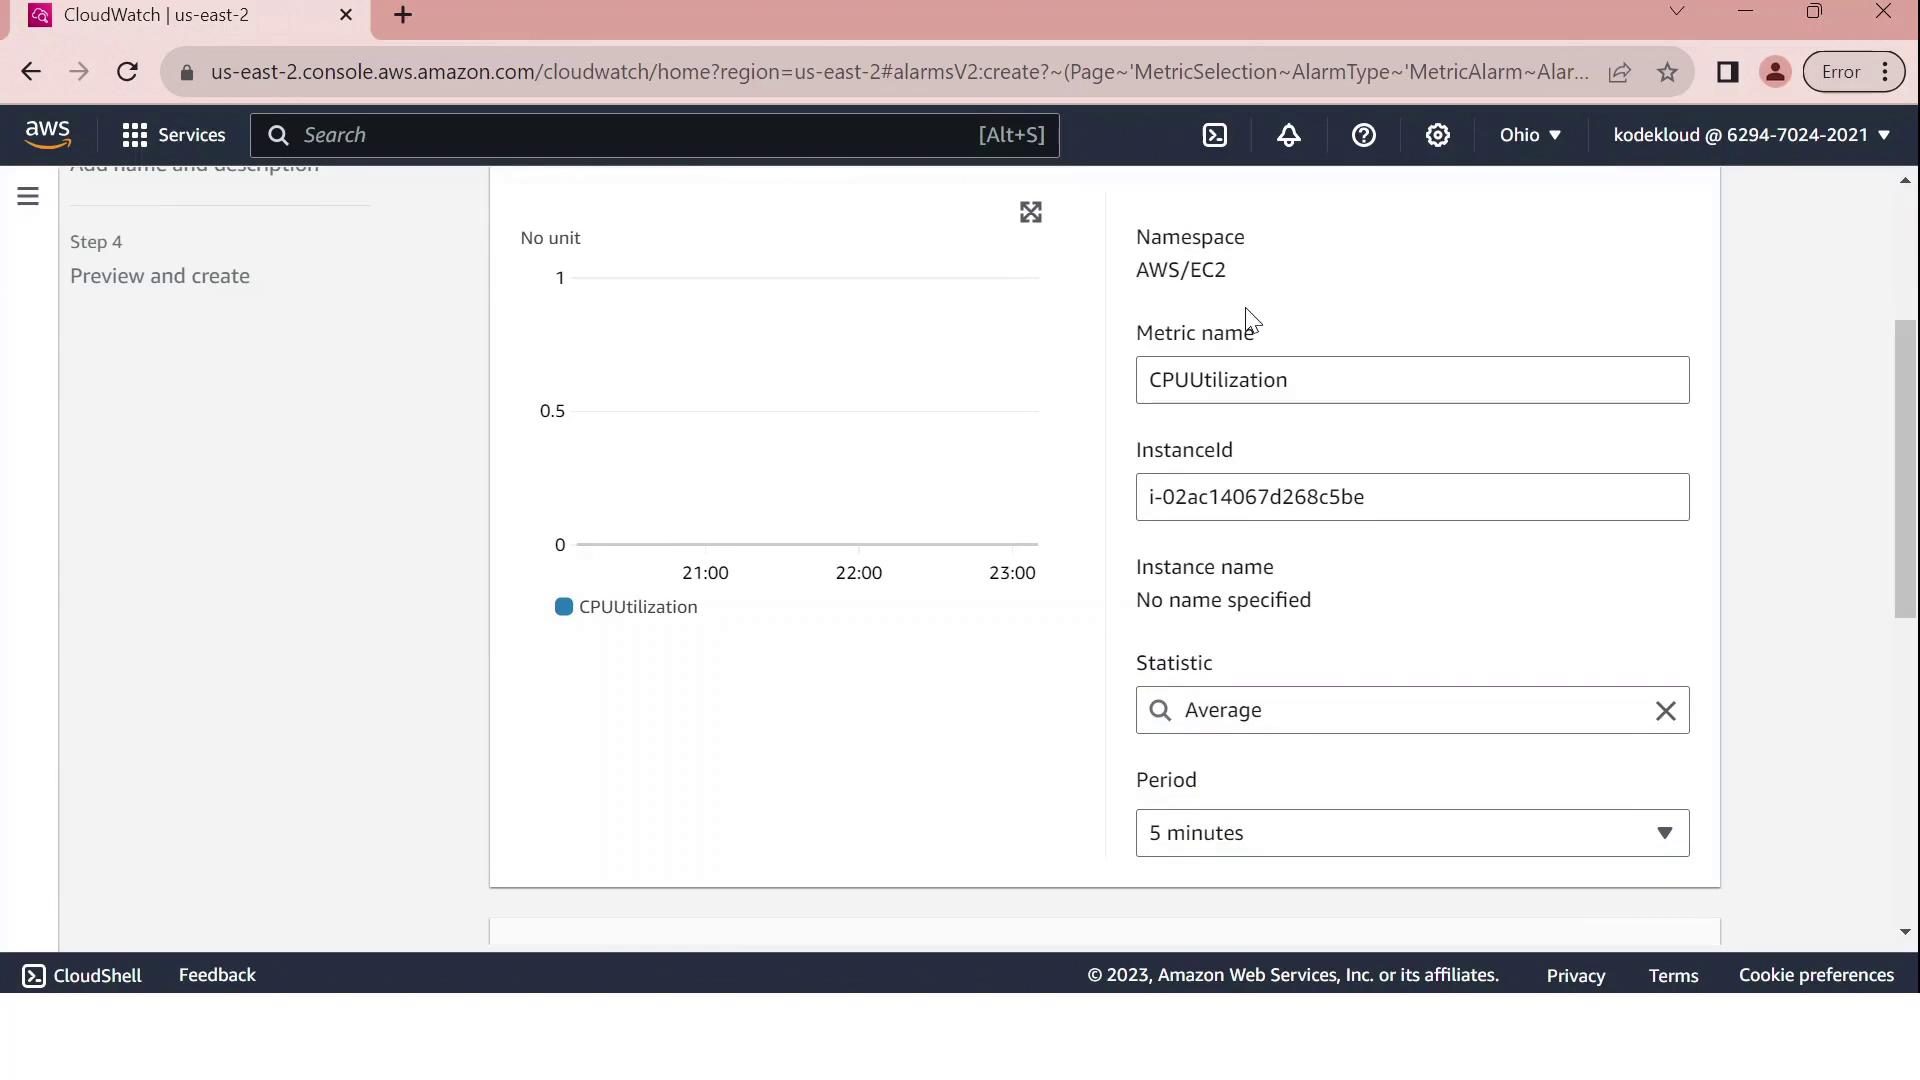
3. Define the Alarm Threshold

Configure the alarm conditions on the Configure metric page:

SettingValue
Statistic period5 minutes
Threshold typeStatic
ConditionGreaterThanThreshold
Threshold value70

This setup tells CloudWatch to evaluate the average CPU utilization over each 5-minute interval and fire the alarm if it exceeds 70%.

The image shows an AWS CloudWatch interface for creating a metric alarm, specifically monitoring CPU utilization for an EC2 instance. It includes a graph and configuration details like namespace, metric name, instance ID, and statistic period.

Note

Custom metrics and long-term storage can incur additional charges. Review CloudWatch pricing before enabling high-frequency monitoring.

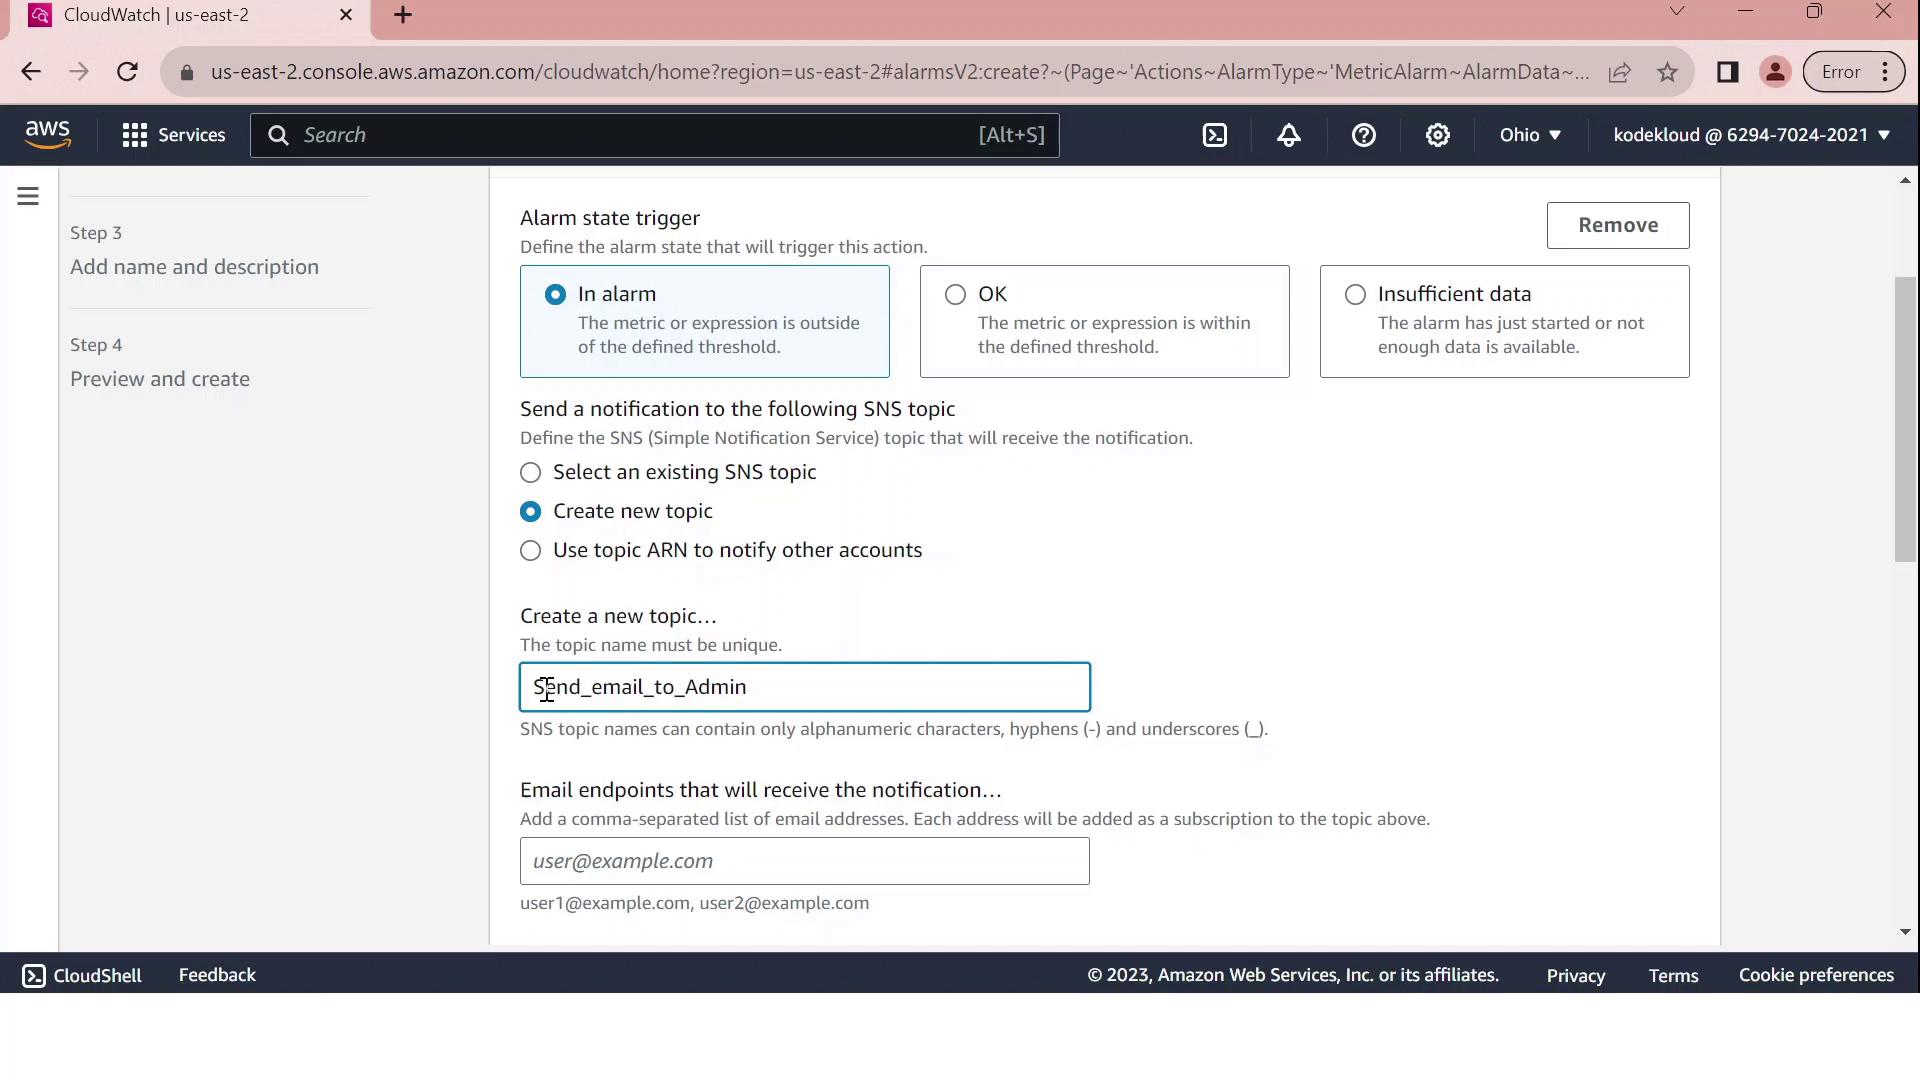
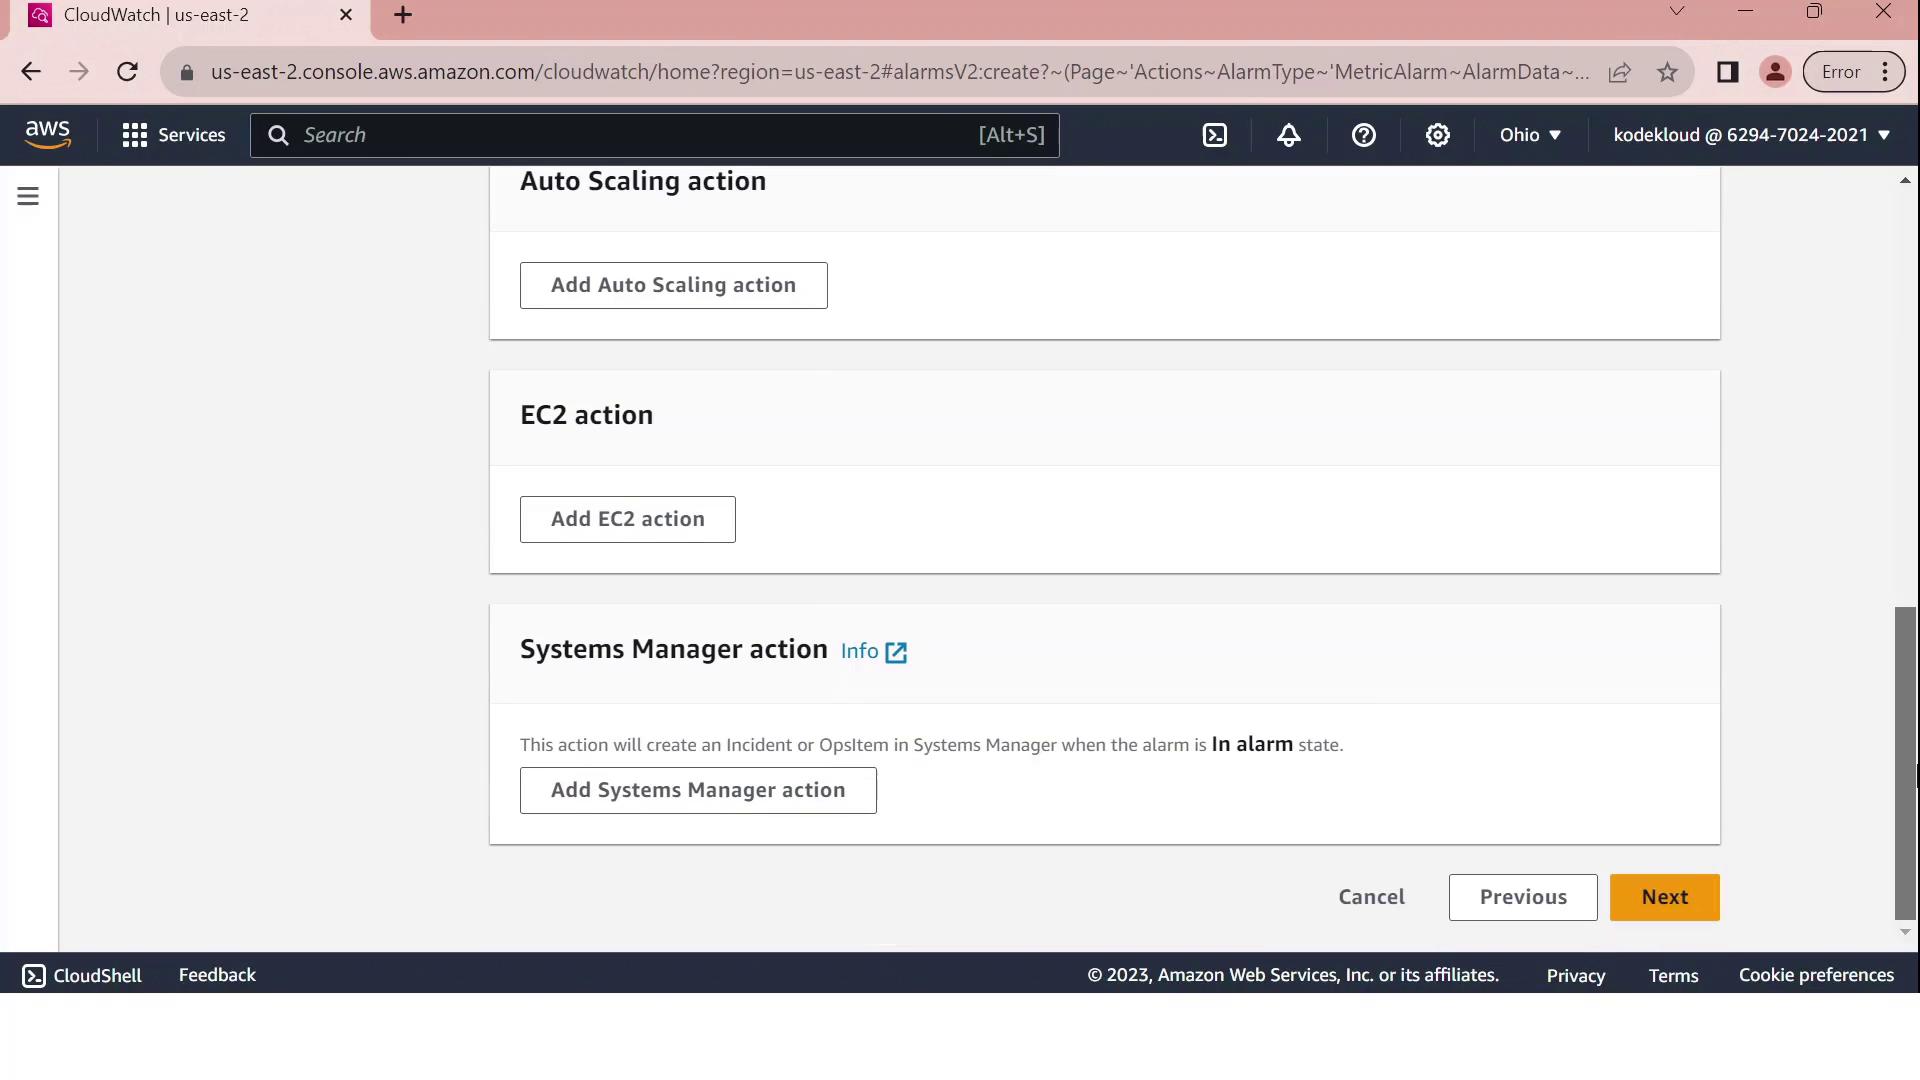
4. Configure Notifications via SNS

Under Notification, choose Create new topic and enter:

Click Create topic to confirm. You can also attach automated actions for Auto Scaling, EC2, or Systems Manager.

The image shows an AWS CloudWatch console screen where an alarm state trigger is being configured. It includes options for sending notifications via SNS, with a new topic being created named "Send_email_to_Admin."

The image shows an AWS CloudWatch interface with options to add actions for Auto Scaling, EC2, and Systems Manager. There are buttons for "Add Auto Scaling action," "Add EC2 action," and "Add Systems Manager action."

Click Next to proceed.

5. Name, Review, and Create

  1. Provide a name such as CPUUtilizationAbove70 and an optional description.
  2. Review all settings:
    • Metric: CPUUtilization for your EC2 instance
    • Period and statistic
    • Threshold: GreaterThan 70
    • Notification: SNS email to [email protected]
  3. Click Create alarm.

Upon successful creation, you’ll see a confirmation message in the Alarms dashboard.

The image shows an AWS CloudWatch dashboard with a notification indicating a successfully created alarm for CPU utilization above 70 percent. The alarms section currently displays no active alarms.


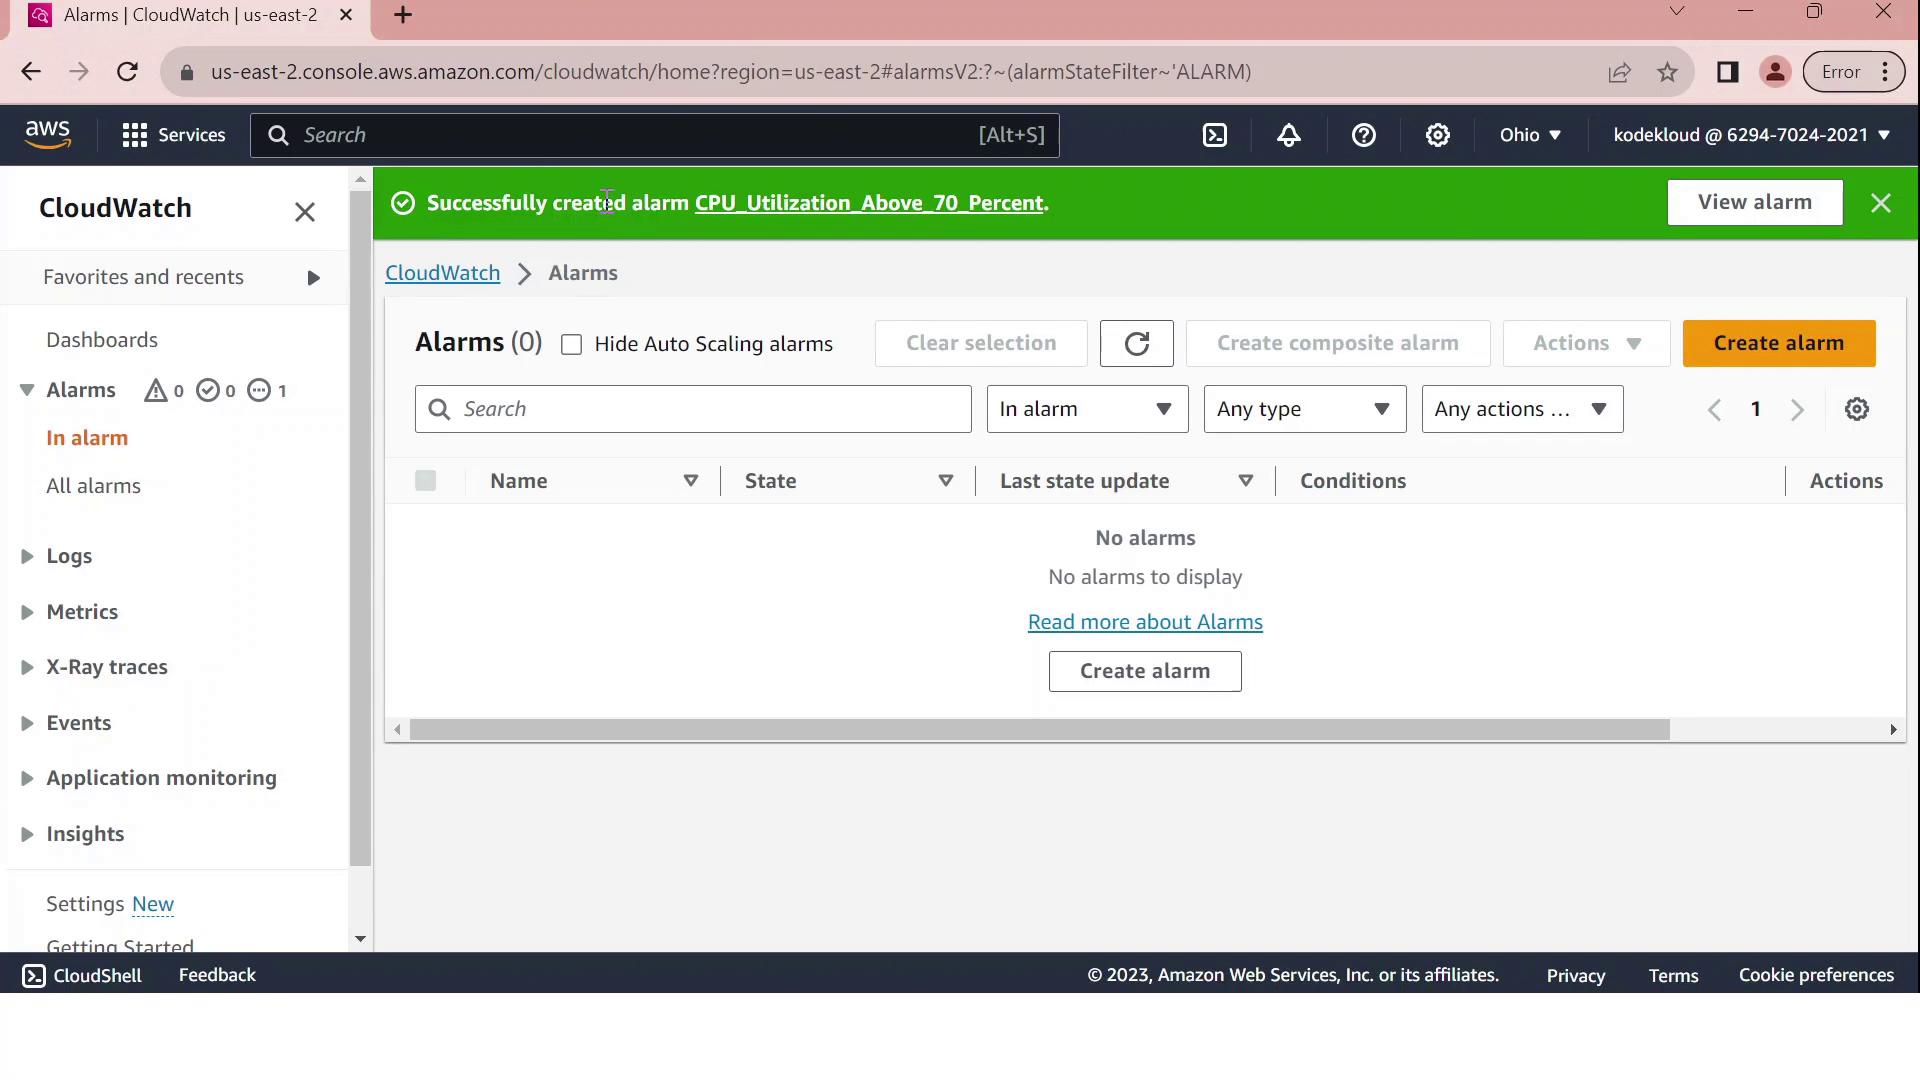
Your CloudWatch alarm is now active. When the average CPU utilization exceeds 70% over a five-minute span, an email is sent to the administrator. Monitor and adjust thresholds as needed to align with your application’s performance requirements.

References

Watch Video

Watch video content

Previous
CloudWatch