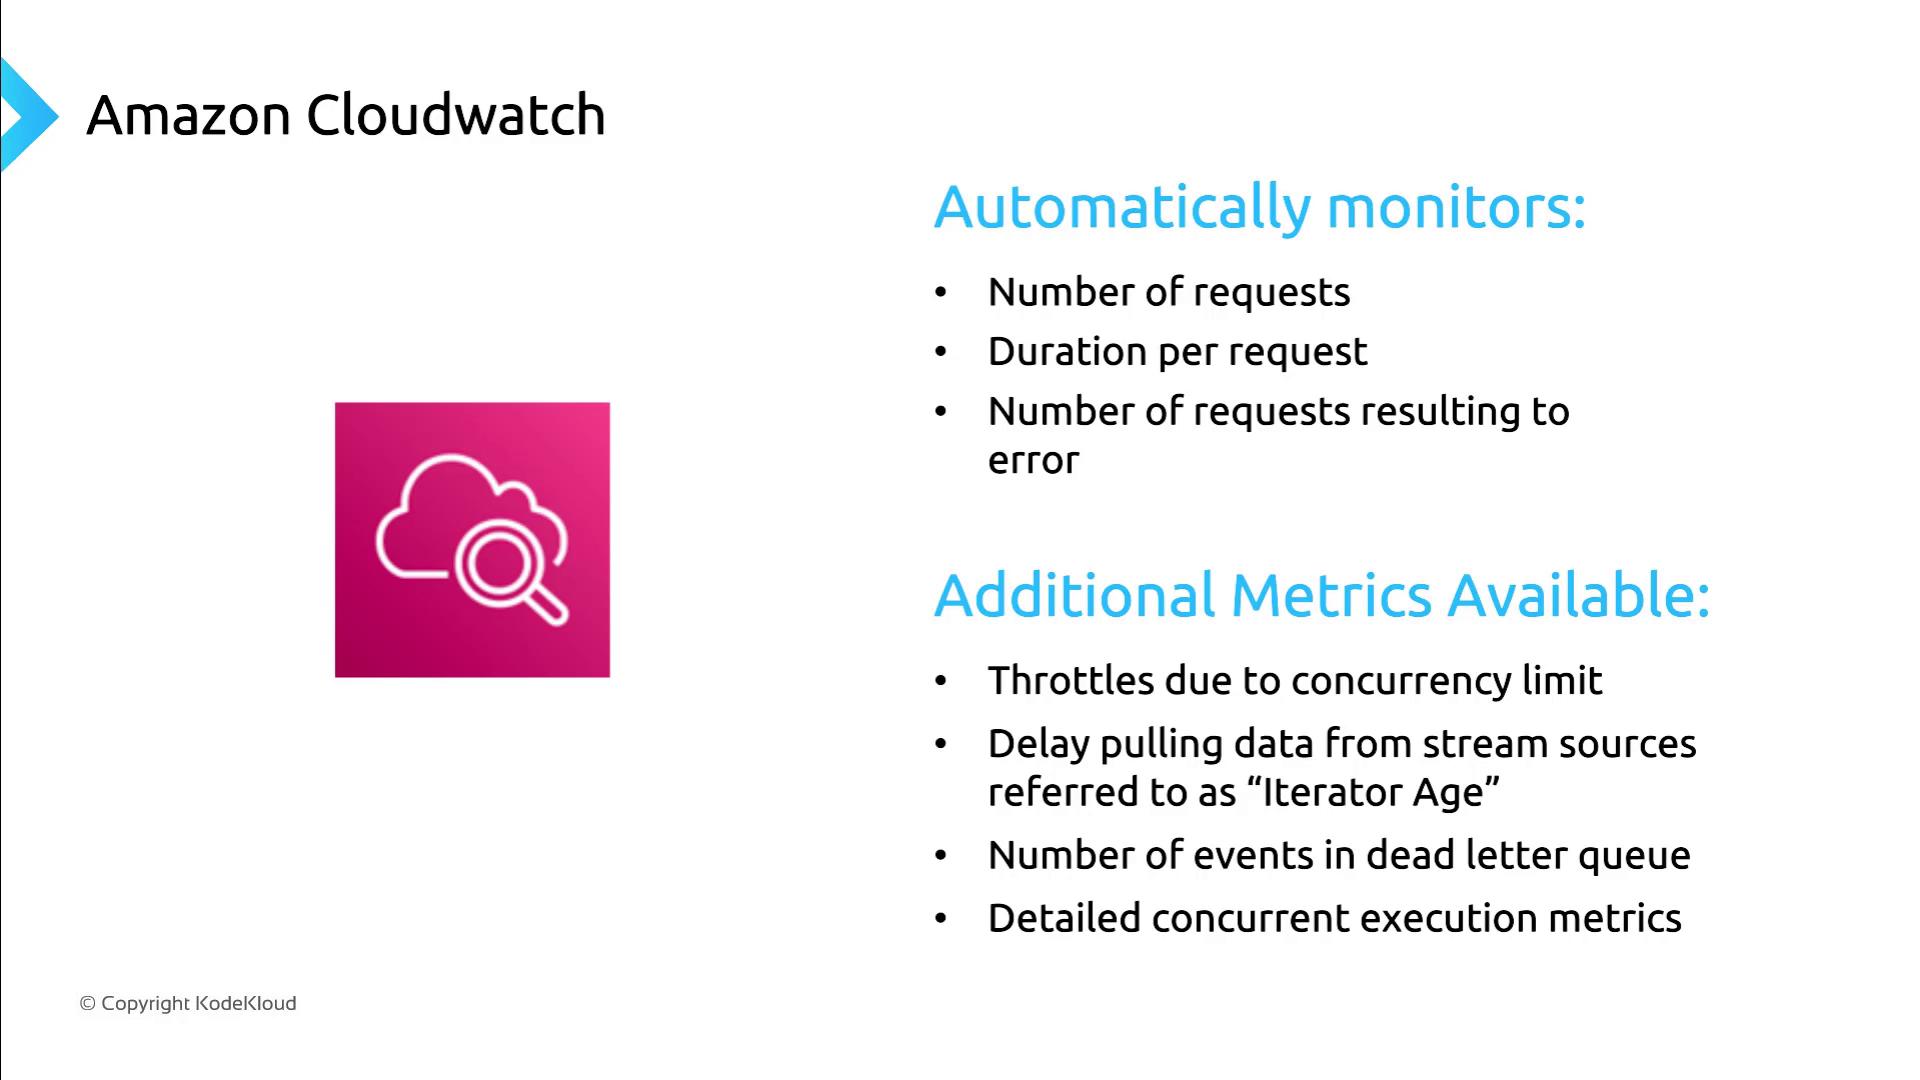
Amazon CloudWatch Metrics
AWS Lambda automatically sends key performance metrics to Amazon CloudWatch, allowing you to track function execution, errors, and performance trends.| Metric | Description | Default |
|---|---|---|
| Invocations | Total number of function calls | ✔️ |
| Duration | Time taken per invocation (in milliseconds) | ✔️ |
| Errors | Number of failed invocations | ✔️ |
| Throttles | Invocations throttled due to concurrency limit | ☐ |
| IteratorAge | Lag time for stream-based event sources | ☐ |
| DeadLetterErrors | Failures delivering to a dead-letter queue | ☐ |
| ConcurrentExecutions | Real-time concurrency usage | ☐ |
If you need an aggregated view across all functions, CloudWatch dashboards can display combined metrics and alert on threshold breaches:
Lambda Insights
Lambda Insights extends CloudWatch with deeper visibility into function behavior, resource utilization, and performance anomalies. Key benefits:- Comprehensive dashboard for all functions in an AWS account or region
- Detailed per-function views of CPU, memory, disk, and network usage
- Customizable alerts on unusual trends or resource spikes

- Troubleshoot individual functions efficiently
- Analyze resource utilization over time
- Detect performance bottlenecks and anomalies
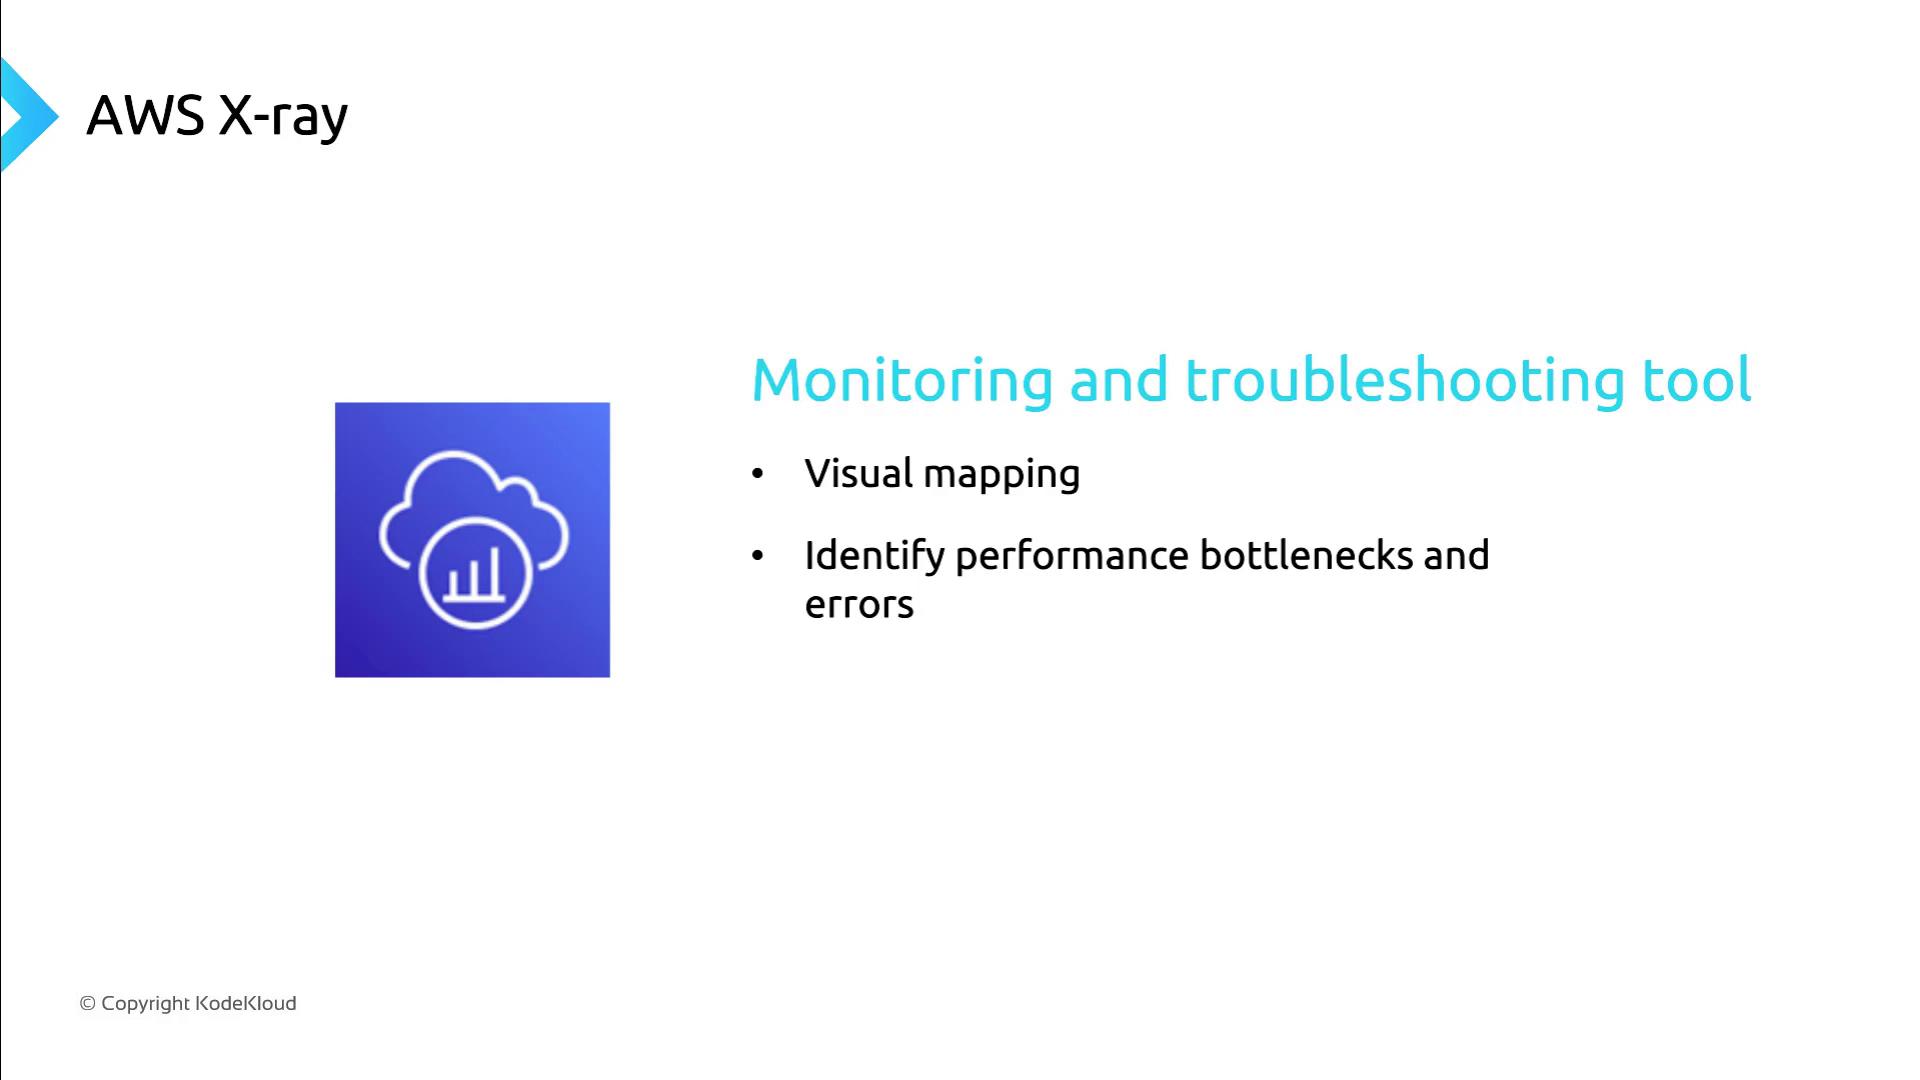
AWS X-Ray Tracing
AWS X-Ray provides distributed tracing for end-to-end request analysis. By instrumenting your Lambda functions with X-Ray, you can:- Visualize service maps and trace requests through microservices
- Measure latency and identify performance hotspots
- Pinpoint errors across the execution flow
Enabling AWS X-Ray may incur additional costs and slight latency overhead. Evaluate tracing requirements before enabling in production.
VPC Flow Logs for Network Monitoring
To capture TCP/IP-level details such as source and destination IP addresses, use VPC Flow Logs. Since Lambda functions run outside your VPC by default, you must configure them to run within a VPC to generate flow logs. Steps to enable:- Attach your Lambda function to a VPC subnet and security group.
- Create a VPC Flow Log to an Amazon CloudWatch Logs group or Amazon S3 bucket.
- Analyze logs for network performance and security insights.
Ensure your Lambda execution role has permissions for both VPC configuration and flow log creation (
ec2:CreateFlowLogs, logs:CreateLogGroup, logs:PutLogEvents).