Advanced Jenkins
Jenkins Administration and Monitoring
Forward Audit Logs to External Server
In this guide, you’ll learn how to ship Jenkins audit trail logs from your controller node to an external Elastic Cloud server. We’ll cover setting up the Elastic Agent, configuring it to pick up Jenkins logs, and visualizing them in Kibana.
1. Elastic Cloud: Collect and Analyze Logs
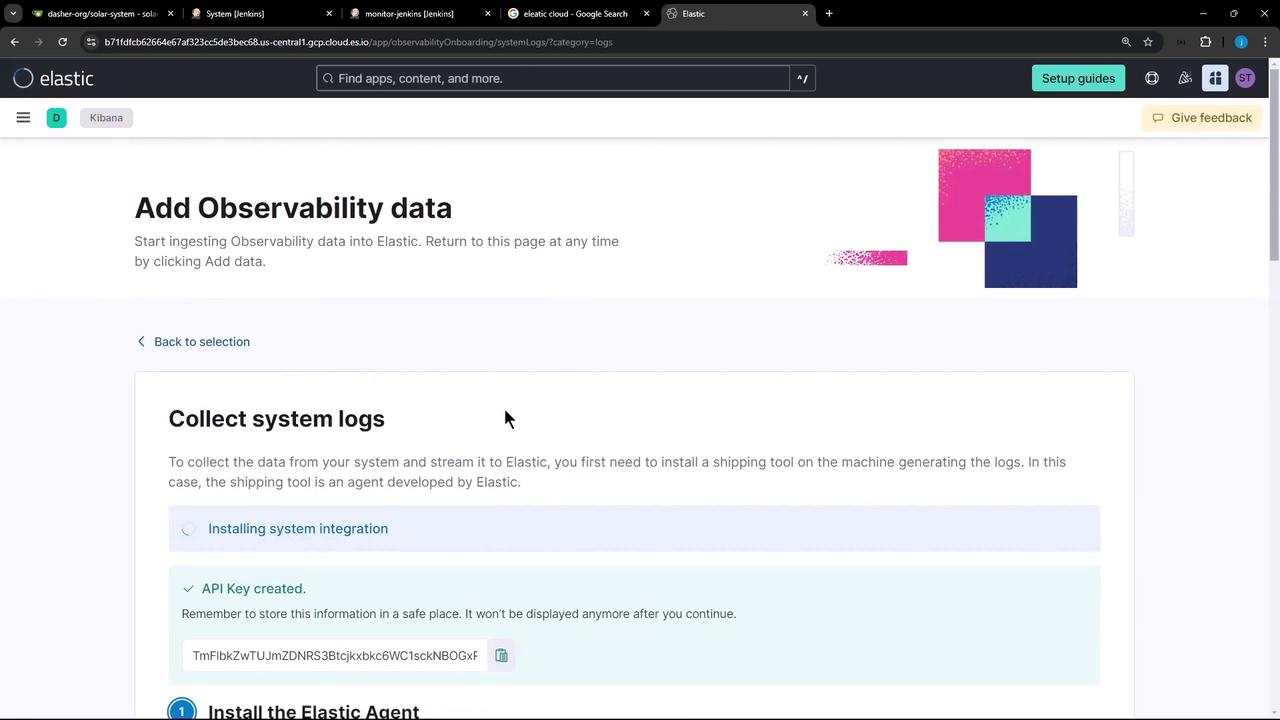
First, sign in to your Elastic Cloud account and navigate to Observability » Collect and Analyze Logs. This onboarding flow walks you through creating an API key and preparing the Elastic Agent for log collection.
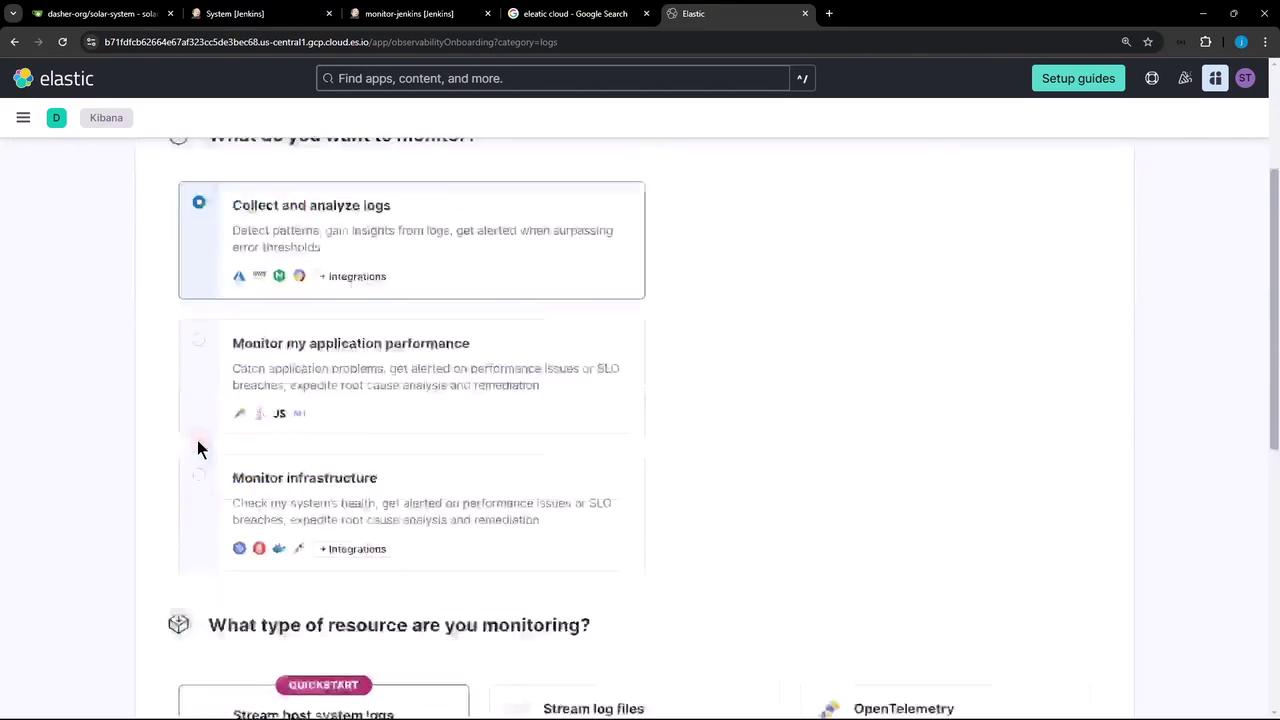
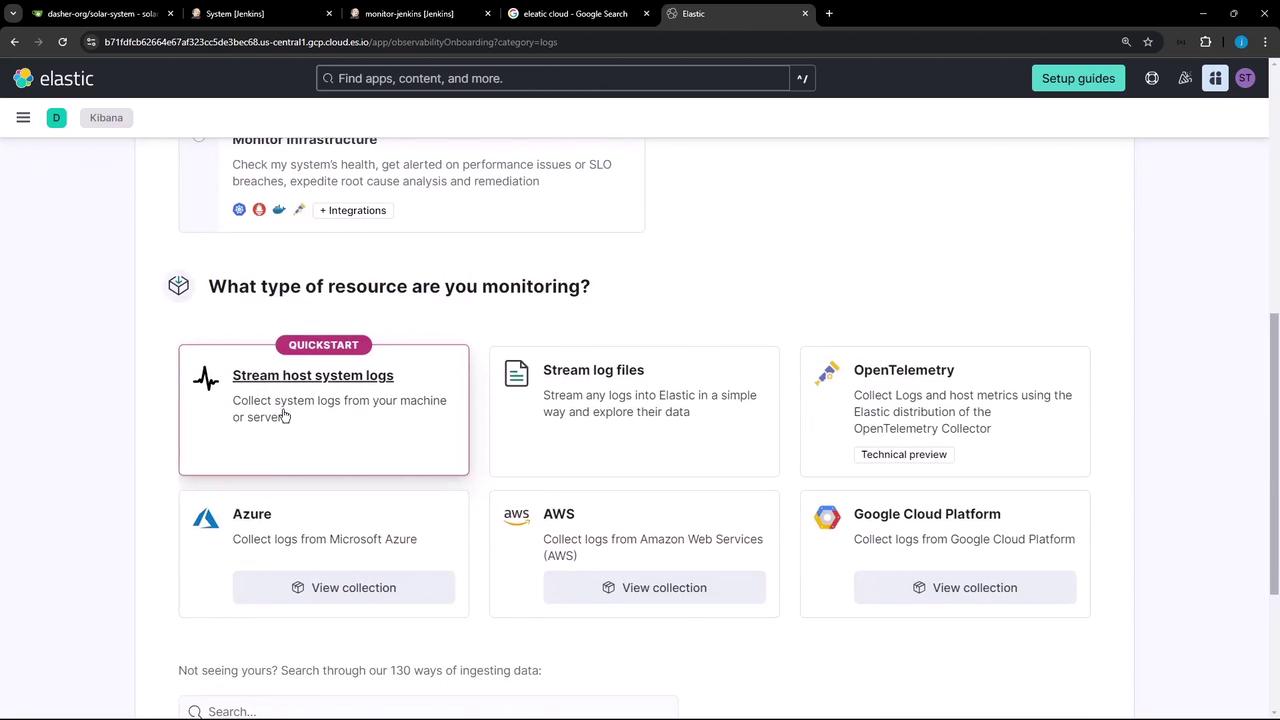
- Click Host system logs under Resource Type.
- Copy the generated API key and endpoint URL; you’ll need these in the next step.
Follow the steps to install the Elastic Agent. When prompted, the console displays a command with your API key embedded.
Note
Make sure you have sufficient permissions to generate API keys. If you lose the key, regenerate it in the Elastic Cloud console.
2. Download and Install the Elastic Agent
SSH into your Jenkins controller (Linux) and run the standalone install script. Replace the placeholders with your actual API key and endpoint URL.
curl https://b711dfdc62646e7af323cc5de3bec68.us-central1.gcp.cloud.es.io/3933429968a/plugins/observabilityOnboarding/assets/standalone_agent_setup.sh \
  -o standalone_agent_setup.sh && \
sudo bash standalone_agent_setup.sh \
  TfIkbXTuJm2DnRS3tBjtkybk6CWi6KNB0KRVzMHZNjLHeXxAQ== \
  https://b711dfdc62646e7af323cc5de3bec68.us-central1.gcp.cloud.es.io/internal/observability_onboarding \
  8.15.3 \
  41f90c24-3644-4edc-ad7a-763b3202a211
Sample output:
Downloading Elastic Agent archive from:
https://artifacts.elastic.co/downloads/beats/elastic-agent/elastic-agent-8.15.3-linux-x86_64.tar.gz
...
Elastic Agent successfully installed, starting enrollment.
Elastic Agent running (id: 45023cea-1f89-40b6-b5e6-32a749382edd)
Done. Configuration saved at /opt/Elastic/Agent/elastic-agent.yml
3. Configure the Elastic Agent to Stream Jenkins Audit Logs
Open the main agent config file and add your Jenkins audit log path under inputs:
outputs:
  default:
    type: elasticsearch
    hosts: ['https://17c4dc99654624076c92fc52f34b.us-central1.gcp.cloud.es.io:443']
    apikey: 'NaemPMfB4d30Kpm9n16K-1rCAB10Yus69VgxlZA'

inputs:
  - id: jenkins-audit-logs
    type: logfile
    data_stream:
      namespace: default
    streams:
      - id: logfile-jenkins-audit
        data_stream:
          dataset: system.auth
        type: logs
        paths:
          - /var/log/jenkins/custom-audit-*.log
        exclude_files:
          - '.gz$'
        multiline:
          pattern: '^'
          match: after
        tags:
          - jenkins-audit
        processors:
          - add_locale: {}
Warning
Editing elastic-agent.yml with incorrect indentation or syntax will prevent the agent from starting. Always back up the original file before making changes.
Restart the agent to apply your updates:
sudo systemctl restart elastic-agent
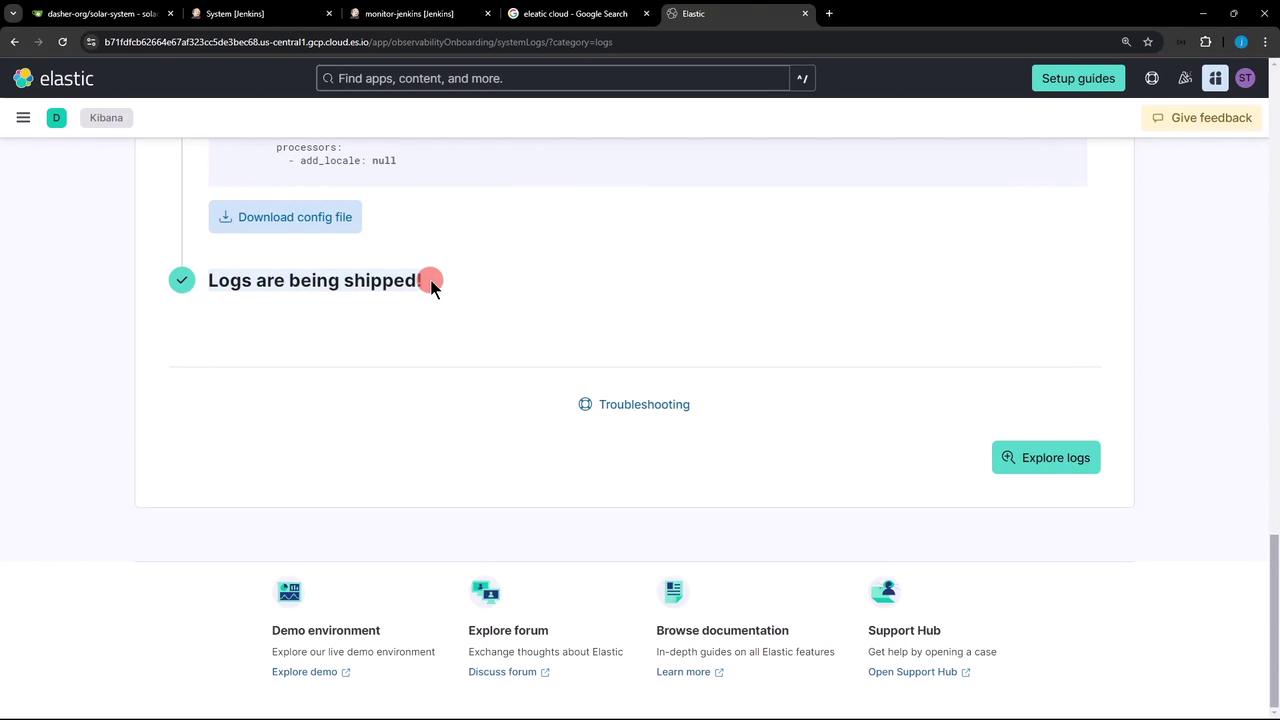
4. Verify Logs in Kibana
Return to Observability » Logs in Kibana. Within seconds, your Jenkins audit entries should appear in the stream. If you don’t see any data, open the Troubleshooting panel for diagnostics.
5. Explore Jenkins Audit Logs
In Logs Explorer, filter by the jenkins-audit tag or system.auth dataset. Click on individual events to inspect metadata such as user, timestamp, and action.
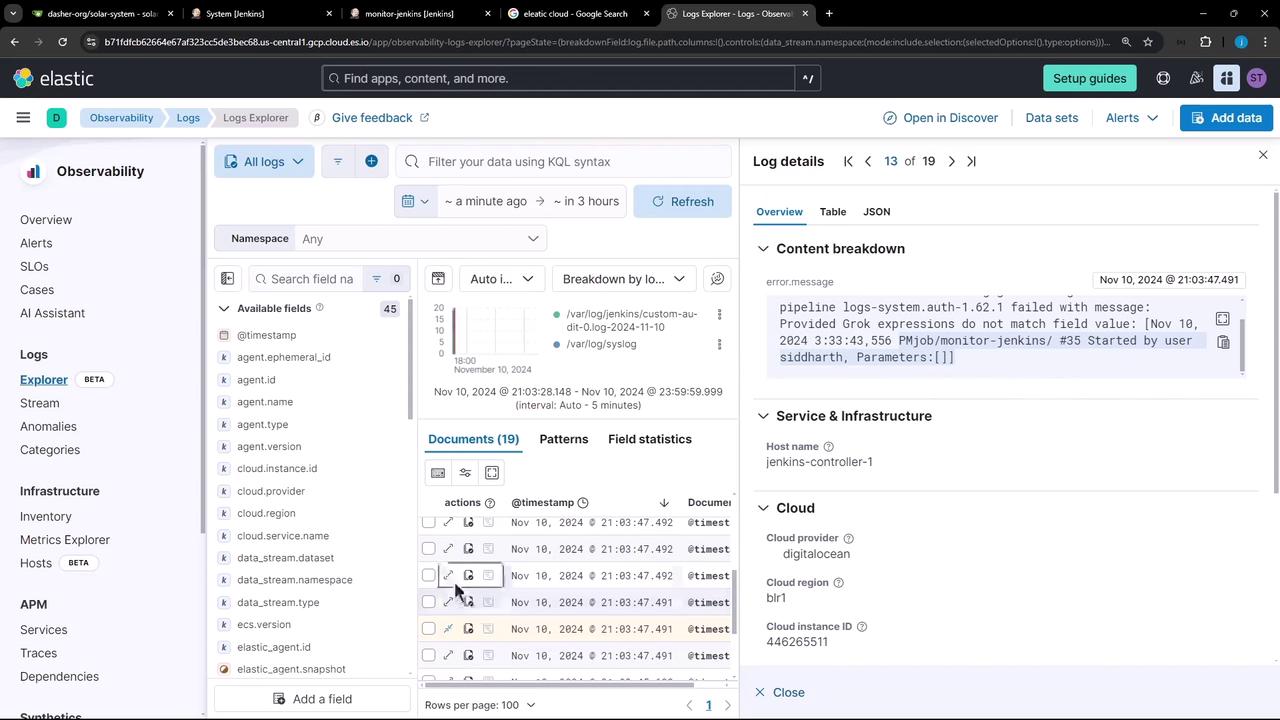
Example log entry:
[Nov 10, 2024 3:33:43,556 PM] job/monitor-jenkins/#35 Started by user siddharth, Parameters:[]
Configuration Summary
| Section | Purpose | Example |
|---|---|---|
| outputs | Elasticsearch endpoint & API key | hosts: […]; apikey: 'NaemPMfB…' |
| inputs | Defines log file path and parsing rules | paths: /var/log/jenkins/custom-audit-*.log |
Links and References
- Elastic Cloud Observability
- Elastic Agent Documentation
- Jenkins Audit Trail Plugin
- Kibana Logs Explorer
Watch Video
Watch video content