Why Folder-Level Health Matters
By default, Jenkins folder icons display an aggregate health based only on direct children. This means a failure deep inside a nested folder might not be visible at a glance on your main dashboard.Make sure you have the Folder Health Metrics Plugin installed before proceeding.
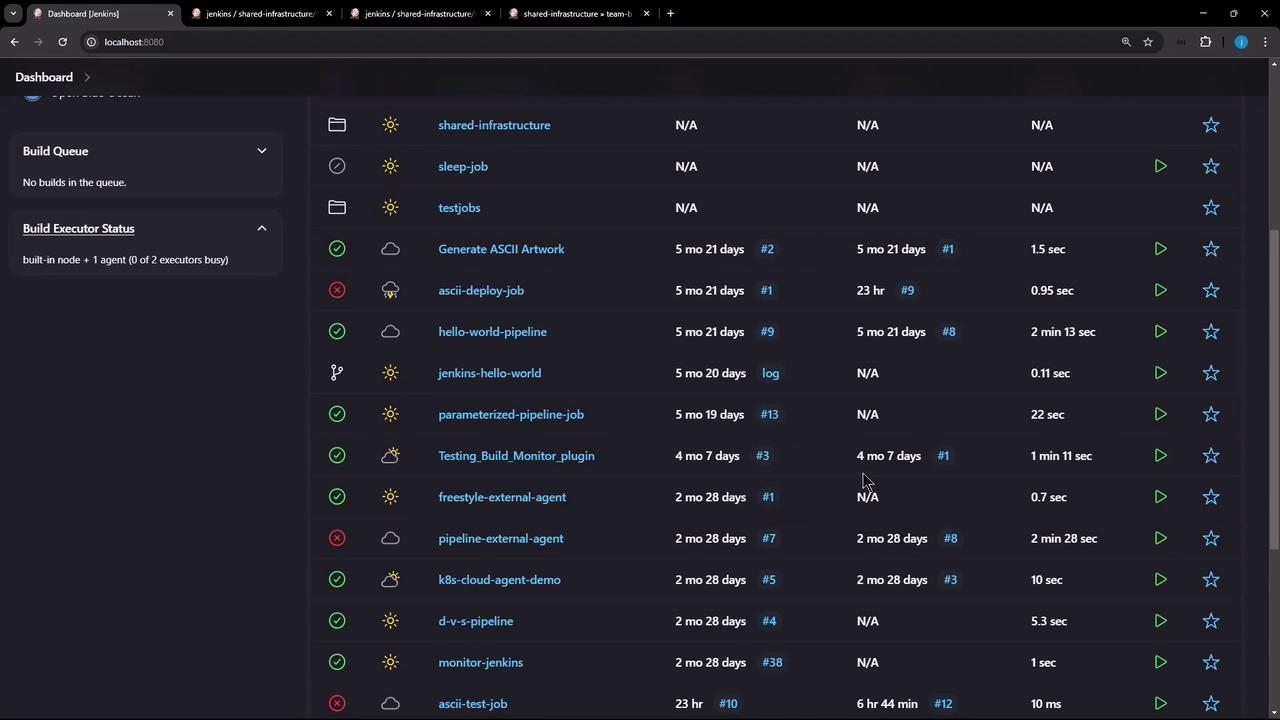
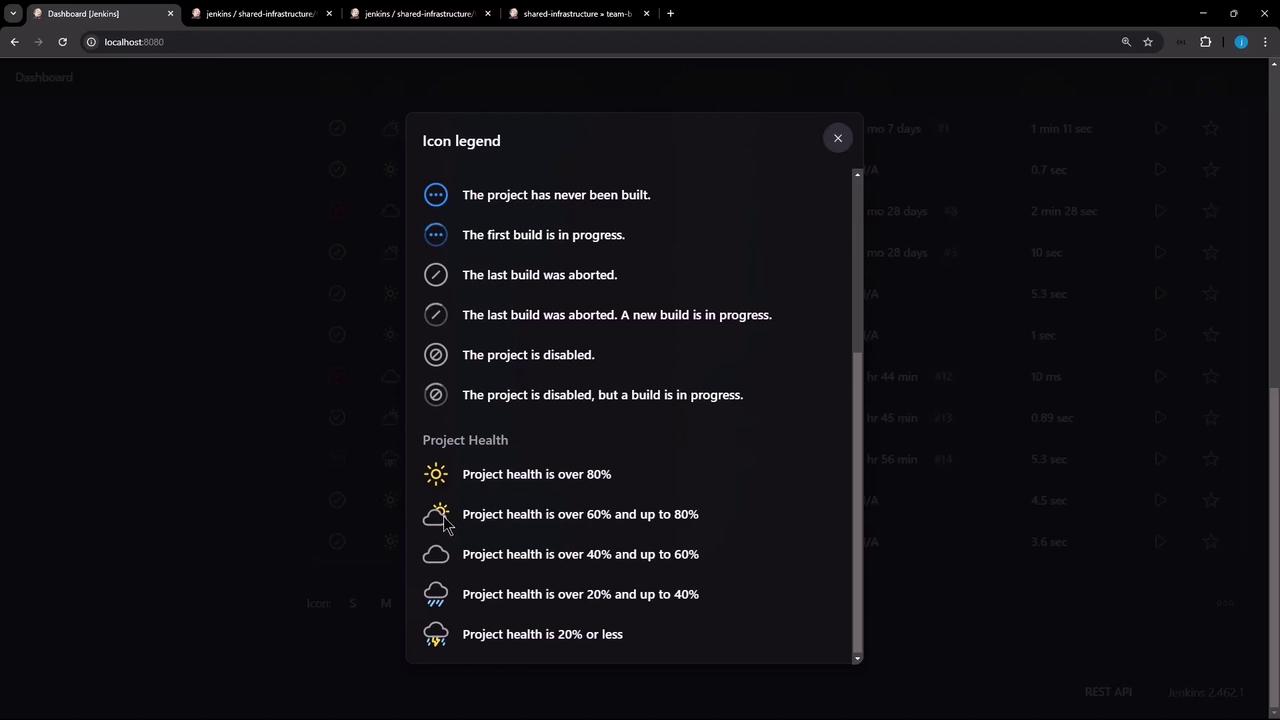
Understanding Jenkins Weather Icons
On the Jenkins dashboard, each job and folder shows a “weather” icon indicating its health:| Weather Icon | Health % | Meaning |
|---|---|---|
| ☀️ Sunny | > 80% | Excellent stability |
| 🌤️ Partly Sunny | 60–80% | Good stability |
| ☁️ Cloudy | 40–60% | Moderate stability |
| 🌧️ Rainy | 20–40% | Unstable |
| ⛈️ Stormy | < 20% | Critical failures |
Default vs. Worst-Child Health
Consider the Shared Infrastructure folder:- It shows a ☀️ sunny icon (≥ 80% healthy), yet the nested Team B folder inside has a failing build.
- When you open Team B, you see a stormy icon and the message “build stability: all recent builds failed.”
Step-by-Step: Propagate Worst-Child Health
Follow these steps to ensure a parent folder reflects the worst health of all nested items:- From the dashboard, click the target folder (e.g., Team B).
- Select Configure from the sidebar.
- Scroll to the Health metrics section.
- Click Add and choose Worst child health.
- Check the Recursive box to include all nested descendants.
- Click Apply and then Save.
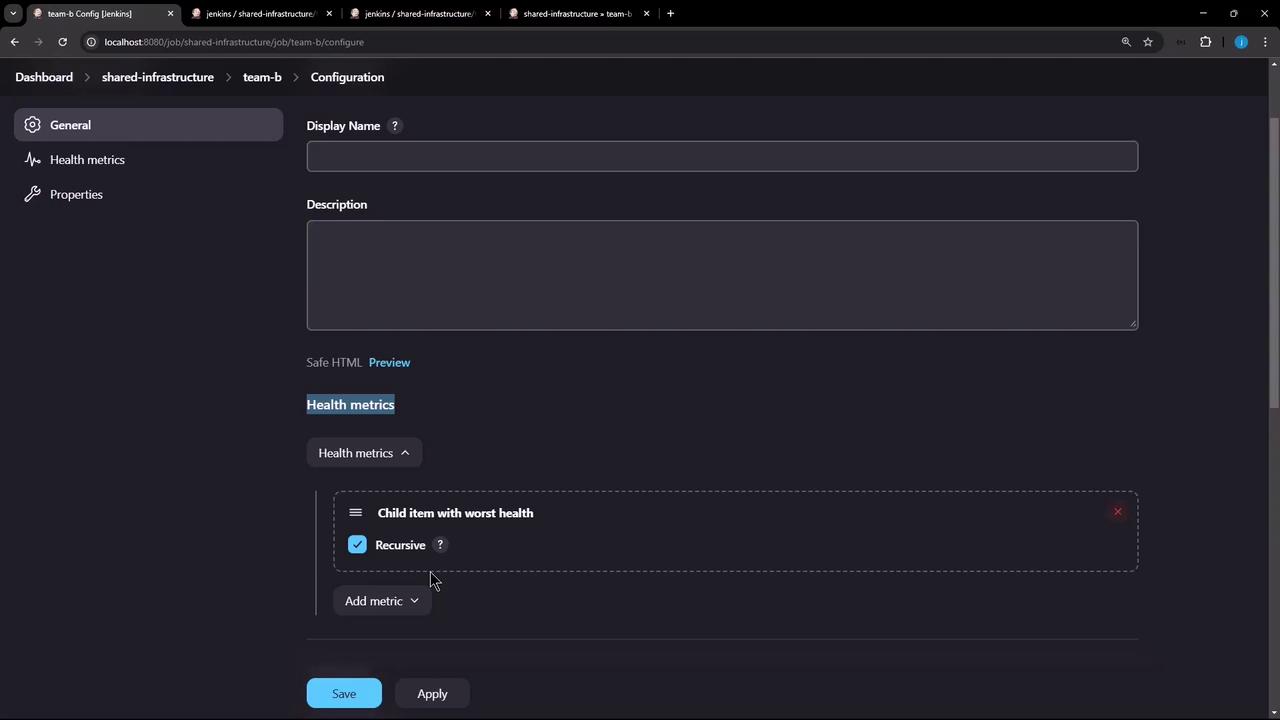
The Recursive option ensures that failures at any depth are included in the parent folder’s health calculation.
Verify the Result
- Return to Shared Infrastructure view.
- Confirm the folder icon now matches the worst status of its children (including Team B failures).
- Repeat this configuration for any other folders in your hierarchy.